
Why did my leads decline while rankings and traffic stayed stable?
Short answer
Traffic volume held and traffic composition changed. The same number of sessions arriving from different queries, different pages, or different devices will convert at a different rate, and every aggregate report hides that. Check the query and landing-page mix first, because it explains most cases, and only investigate the form once you've ruled composition out.
Conversion rate is a weighted average
Your site conversion rate isn't a property of your site. It's the average of every page's conversion rate, weighted by how much traffic each page received.
That means it can fall with no page getting worse. If your pricing page converts at 6% and your blog at 0.4%, and the traffic mix shifts five points from pricing toward blog, your blended rate falls while both pages perform exactly as before.
So the first question is never "what broke on the form." It's "did the mix move."
Check composition in four cuts
Run all four before touching anything. Each takes minutes and each rules out a different cause.
| Cut | What you compare | Shift that matters |
|---|---|---|
| Landing page | Sessions and conversions per page | 5-point share move between pages with different rates |
| Query intent | Commercial vs comparison vs informational share | Any move toward informational |
| Branded vs non-brand | Branded share of total sessions | Branded share falling |
| Device and geography | Mobile versus desktop split | Mobile share rising on a desktop-optimised form |
By landing page. Pull sessions and conversions per landing page for this period and the comparison period. Look for pages whose share of total traffic moved more than a few points. See Why did conversions fall after traffic shifted to different landing pages?.
By query intent. Split Search Console queries into commercial, comparison, and informational. A stable click total with a shift from commercial toward informational will drop leads without moving a single ranking.
By branded versus non-brand. Branded visitors convert several times better than non-brand. A fall in branded share lowers your rate with no other change. Method in Is our non-brand visibility falling while branded traffic hides the loss?.
By device and geography. Mobile converts worse than desktop on most B2B forms. A device-mix shift is a real cause that looks like nothing in a traffic report.
If composition held, then look downstream
Only now is it worth examining the conversion path itself. Four things break quietly.
The form. A field added, a validation rule tightened, a third-party script failing on one browser. Test it yourself on mobile and desktop, and check whether form-submission events are still firing in analytics at all.
The offer. A demo request converts differently from a trial signup. If anyone changed the CTA wording or the destination, that's your candidate.
Tracking. A conversion event that stopped firing produces an identical chart to a conversion that stopped happening. Verify the event fires before diagnosing the funnel, because this accounts for more false alarms than any other cause.
Qualification. Sometimes leads didn't fall, the definition did. If someone tightened MQL criteria, the top of the funnel is unchanged and your reporting moved.
The composition shift that's now common
There's a newer mechanism worth checking explicitly, because it produces exactly this pattern.
Buyers increasingly resolve the early part of their research inside an AI answer, then arrive later and further along. Our own state of AI search research, covering more than 22,000 answers, found Google AI Mode returns a citation-rich answer in 97.4% of matched B2B queries and Perplexity in 93.2%, while Pew Research found that when an AI summary appears, users click a source link in only about 1% of visits.
Two consequences that look like a lead decline. Some of the visitors who used to fill in a form to get information now get it from the answer and never arrive. And some of the ones who do arrive skip your gated content entirely because they already have the context it offered.
If your gated top-funnel assets are converting worse while demo requests hold steady, that's this pattern rather than a broken funnel.
Run the diagnosis in order
1. Verify the conversion event still fires. Two minutes. Rules out the most common false alarm.
2. Compare landing-page mix. Sessions and conversions per page, both periods.
3. Compare query intent mix. Commercial, comparison, informational shares.
4. Compare branded share and device mix.
5. Recompute conversion rate holding mix constant. Apply last period's traffic weights to this period's per-page rates. If the blended rate is now flat, composition explains it entirely.
Step 5 is the one that settles the argument, because it separates "our pages got worse" from "our traffic changed" with a single number.
Where Analyze AI fits
The composition analysis is a GA4 and Search Console join, and the newer AI-driven cause needs a third source.
GSC Page-Keyword Breakdown returns every query driving clicks to a page, which is how you build the intent mix per landing page rather than site-wide. GA4 AI Traffic Overview and AI Landing Pages separate AI-referred sessions, which matters because those visitors arrive at a different funnel stage and dilute a blended rate.
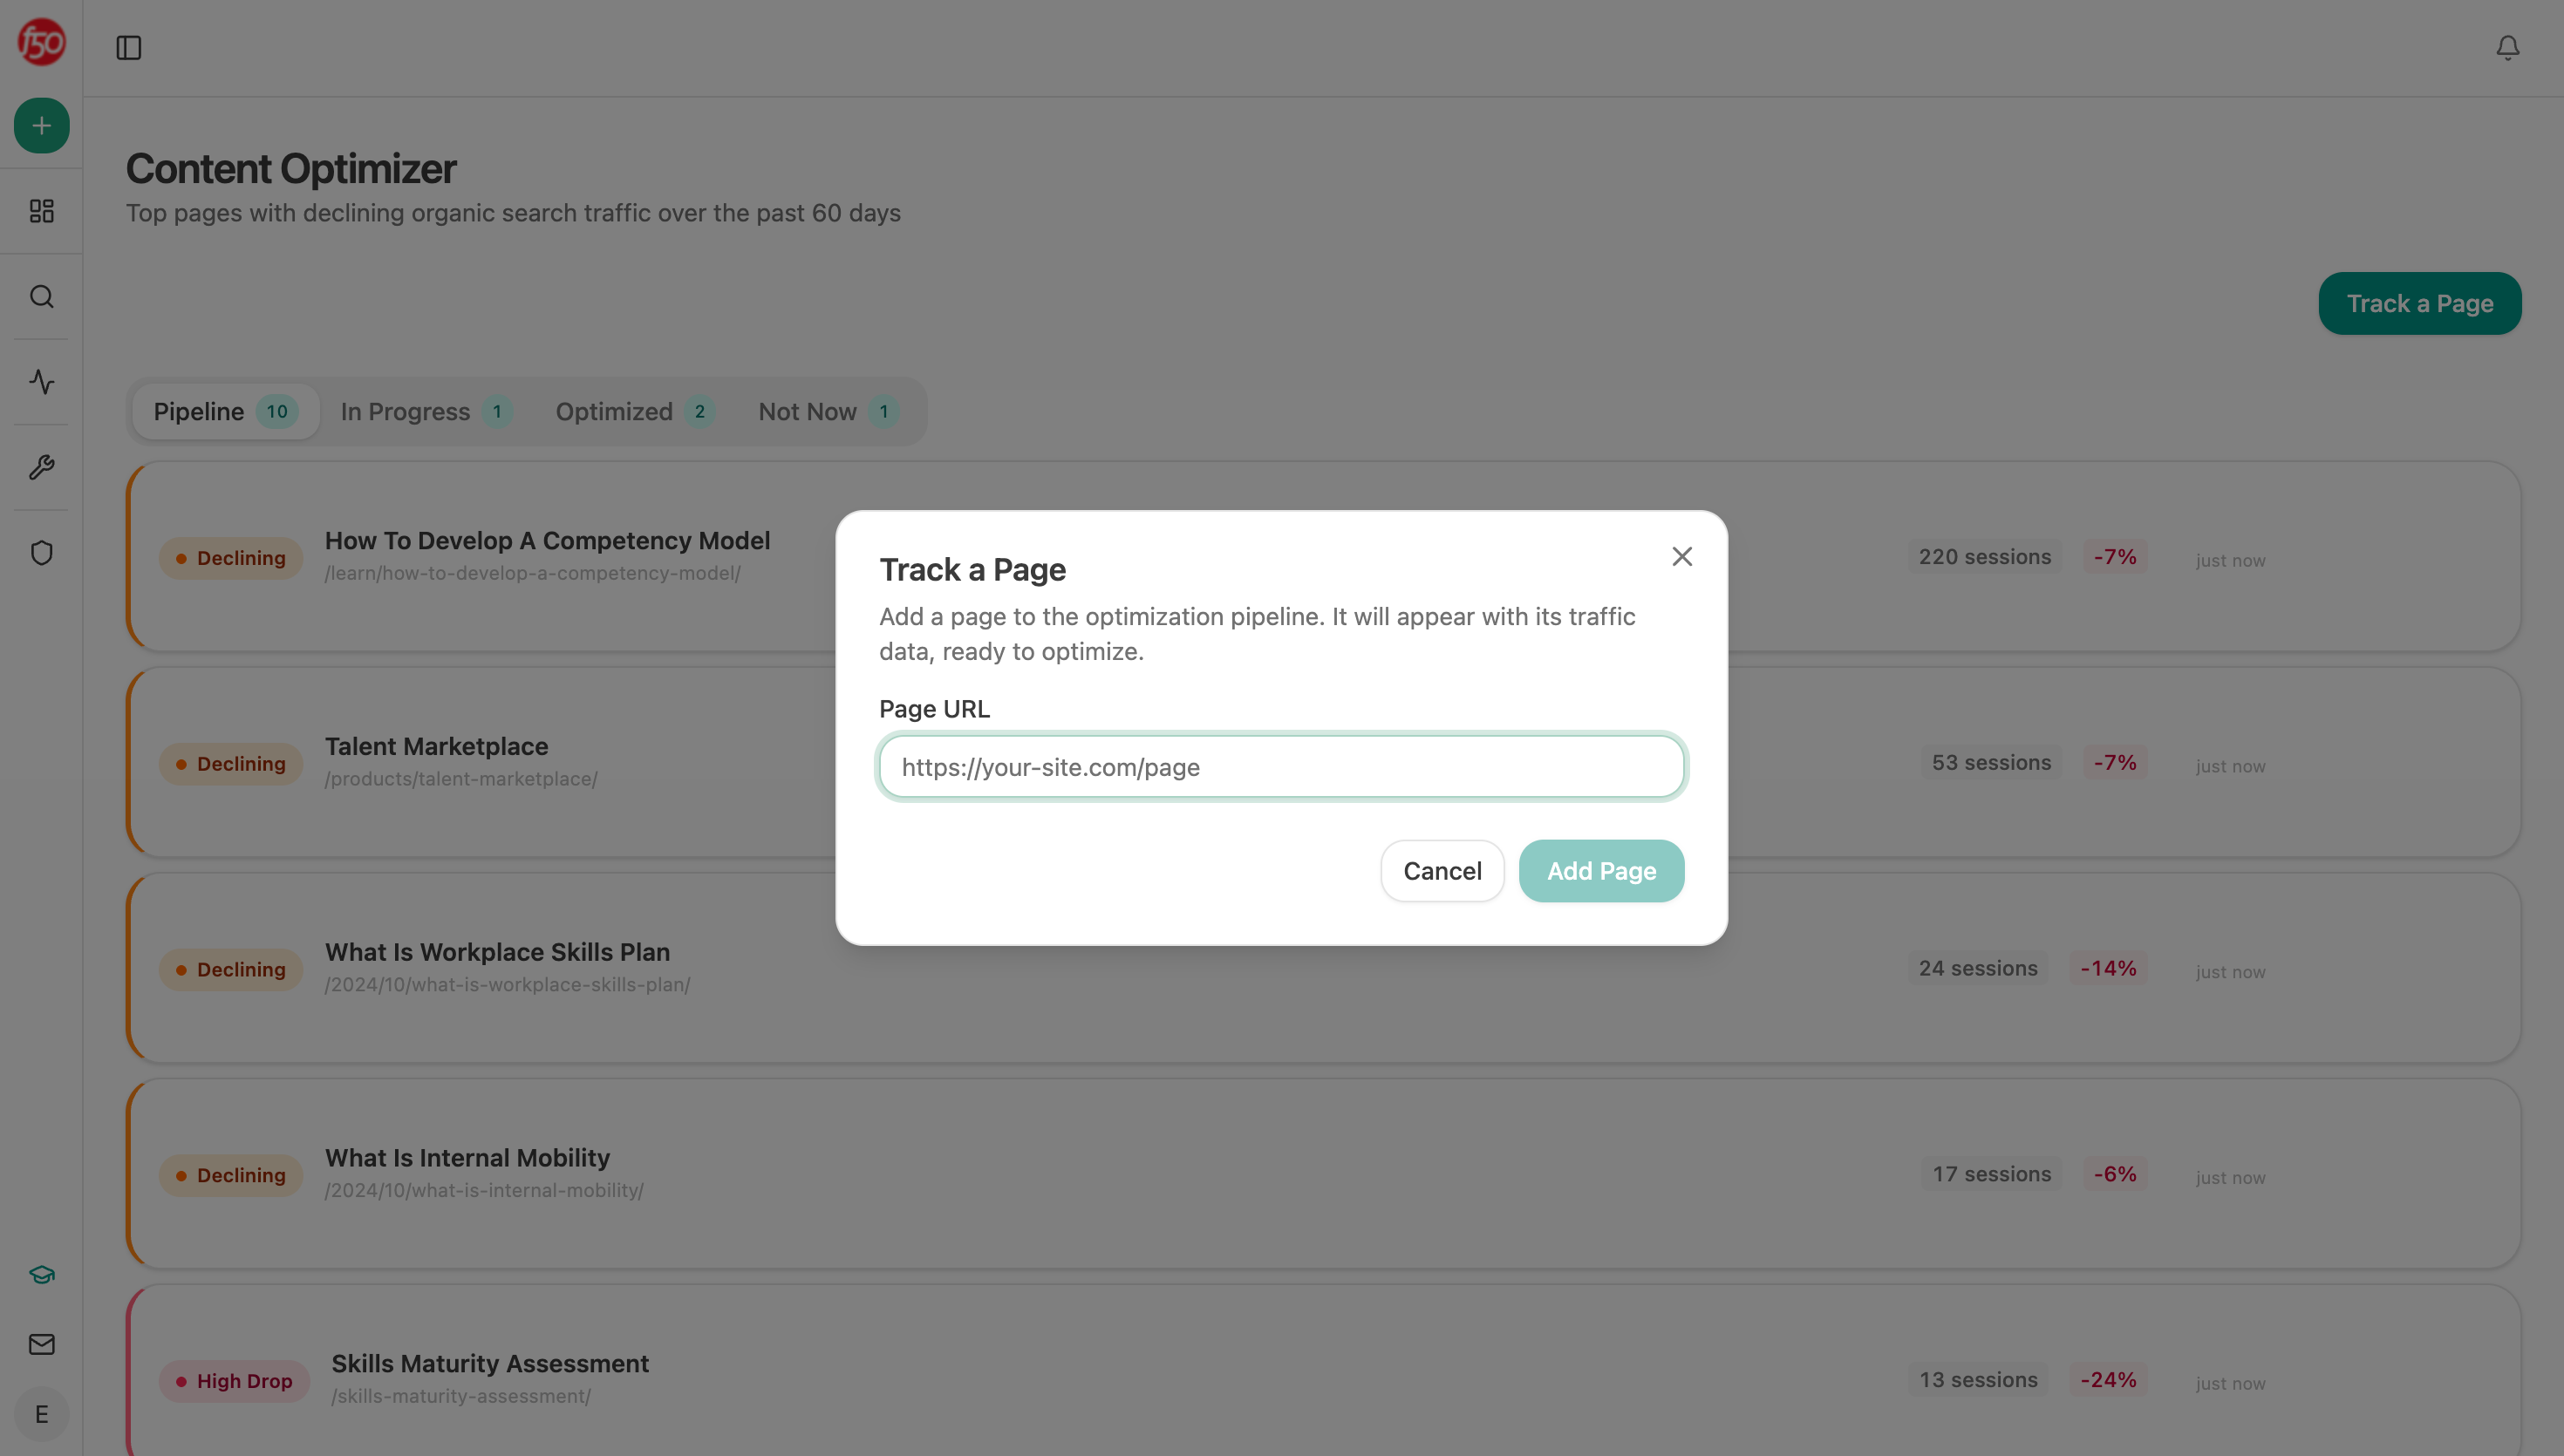
For the gated-content question specifically, the Content Optimizer audits whether a page is still the best available answer, and the AEO Content Scorecard scores it on structure, freshness, claim density, and proof integration. A gated asset losing conversions because the ungated AI answer is now better is a content problem with a content fix.
A monthly agent that produces the mix-adjusted number:
Start (schedule, monthly) → GSC Top Pages for Site and Page-Keyword Breakdown (top 50 pages) → GA4 AI Traffic Overview and AI Landing Pages → HubSpot Get CRM Objects (leads by landing page, both periods) → Code (compute per-page conversion rates, then recompute the blended rate holding last period's traffic weights constant) → Prompt LLM (report how much of the decline is composition versus per-page performance, and flag pages where AI-referred share grew) → Excel export → Send Email to CMO.
The mix-held-constant figure in that Code node is the whole point. It converts a month of debate into one sentence: composition explains 80% of the decline, and these four pages account for the rest.
FAQ
Related answers
- Why did conversions fall after traffic shifted to different landing pages?
- Is our non-brand visibility falling while branded traffic hides the loss?
- Is bot traffic masking a real conversion problem?
- How do I find the most likely cause of a traffic anomaly?
Want a conversion report that separates traffic mix from page performance? Start a free Analyze AI trial and connect GA4, GSC, and your CRM.