
How do I keep track of which site changes caused which traffic changes?
Short answer
Log every change automatically at the moment it ships, with the URLs affected and a timestamp, rather than relying on anyone to maintain a spreadsheet. Traffic effects surface two to eight weeks later, by which point nobody remembers what shipped when. Then annotate your analytics with the same log, so a dip in September can be checked against a template change in July instead of guessed at.
Why manual change logs always fail
Every team starts one. It survives about six weeks.
The reason isn't discipline, it's timing. The person shipping a template change has no reason to think it'll matter, and the person investigating a traffic dip two months later doesn't know the change happened. Between them sits a spreadsheet that was last updated in the first fortnight.
The fix is to remove the human step. If the log is written by the same event that ships the change, it can't fall behind.
What each entry needs
Four fields, and skipping any one of them makes the log unusable later.
| Field | Why |
|---|---|
| Timestamp | Effects lag by weeks, so precise dating is the whole point |
| URLs affected | A template change hitting 1,200 pages reads differently from one page |
| Change type | Content, technical, template, navigation, or redirect |
| Expected effect | Recorded before you know the outcome, which prevents rewriting history |
That last field is the one that separates a log from an alibi. Writing down what you expected before the data arrives is what lets you learn from the times you were wrong.
Categorise by expected lag
Different change types surface on different timelines, and comparing a change to the wrong window produces false conclusions.
Immediate, days. Redirects, noindex, robots.txt, canonical changes. If traffic doesn't move within a week, something else caused what you're seeing.
Short, two to four weeks. Title and meta rewrites, internal linking, on-page content updates.
Medium, four to twelve weeks. New content, template changes, site architecture, Core Web Vitals work.
Long, three months or more. Domain migrations, large-scale pruning, brand changes.
A traffic dip in week three cannot be caused by a content refresh published in week two if content refreshes normally take a month to register. Knowing the expected lag per type stops most of the wrong attributions.
The confounders to record alongside
Your own changes aren't the only cause, and a log that only contains your work will over-attribute to it.
Record algorithm updates, competitor launches and redesigns, seasonality markers, paid campaign starts and stops, and PR events. When a dip has three candidate causes, having all three dated in one place is what makes the analysis honest.
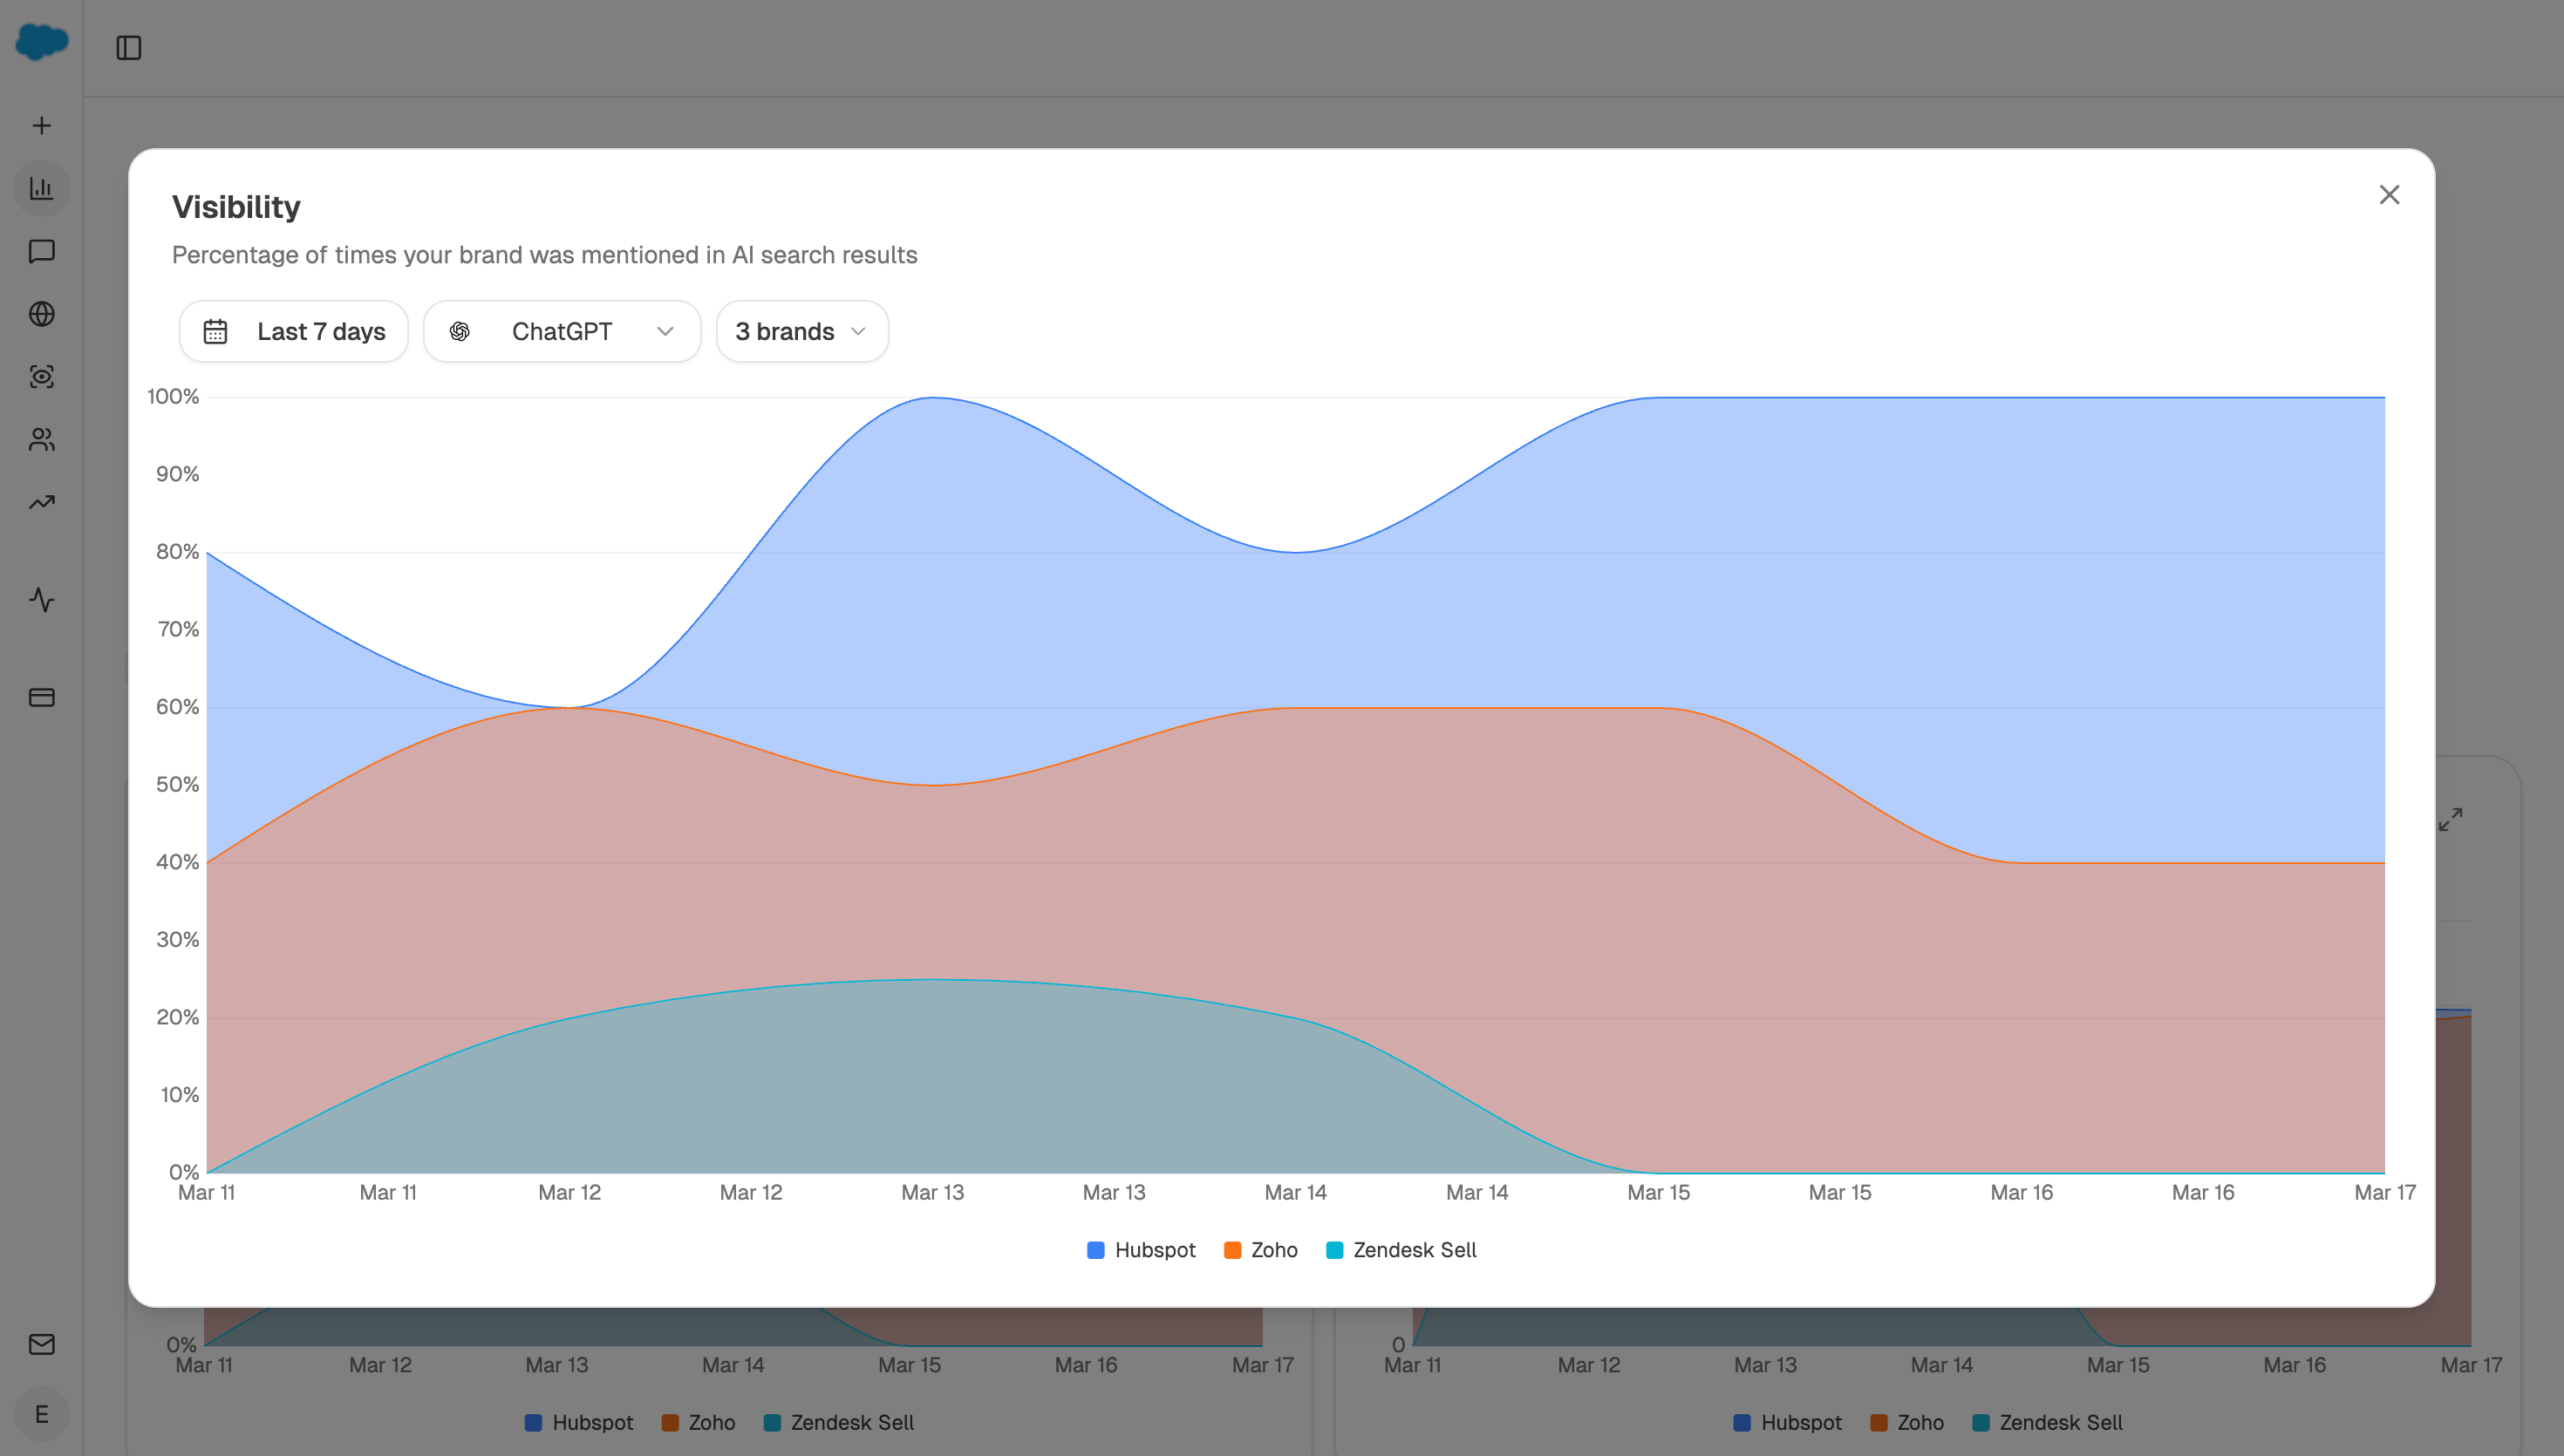
Add one more that most logs miss: AI visibility movement. Our own state of AI search research, covering more than 22,000 answers, found citation presence reaches 97.4% on Google AI Mode and 93.2% on Perplexity, and that presence is path-dependent. A page can lose organic clicks because an AI surface started answering the query directly, with nothing about your site having changed at all. Google's own documentation on AI features notes that AI Overviews and AI Mode may fan a query out across subtopics, which means the surface answering your query may not even be the one you were tracking. Without AI visibility in the log, that shows up as an unexplained dip and someone rolls back a change that was fine.
How Analyze AI writes the log for you
The mechanics that matter here are the trigger mode and the write surface, because the goal is a log that maintains itself.
Webhook triggers let a CMS publish event fire an agent directly. The endpoint is HMAC-signed and accepts a payload, so WordPress, Contentful, Sanity, or your deployment pipeline can post the change as it happens.
CMS and workspace write nodes give the log somewhere to live. Notion has six nodes including Append Blocks and Query Database, so the change log can be a Notion database that the agent appends to, queryable later by date range or URL.
The logging agent:
Start (webhook, fired on CMS publish or deploy) → Code (parse payload for URLs, change type, author) → GSC Page Performance Summary on the affected URLs (capture the pre-change daily series as the before-state) → Prompt LLM (classify change type, assign expected lag window) → Notion Append Blocks (write the entry with timestamp, URLs, type, expected effect, and the frozen before-state).
The investigation agent, run when something moves:
Start (schedule, weekly) → GSC Page Performance Summary (daily time series, affected URLs) → Get Visibility Events (month-over-month AI visibility per provider) → Notion Query Database (retrieve log entries in the relevant lag window) → Conditional (branch on whether the movement falls inside an expected lag window for any logged change) → Prompt LLM (list candidate causes ranked by lag fit, flag where AI visibility moved but the site did not) → Send Notification to the SEO lead.
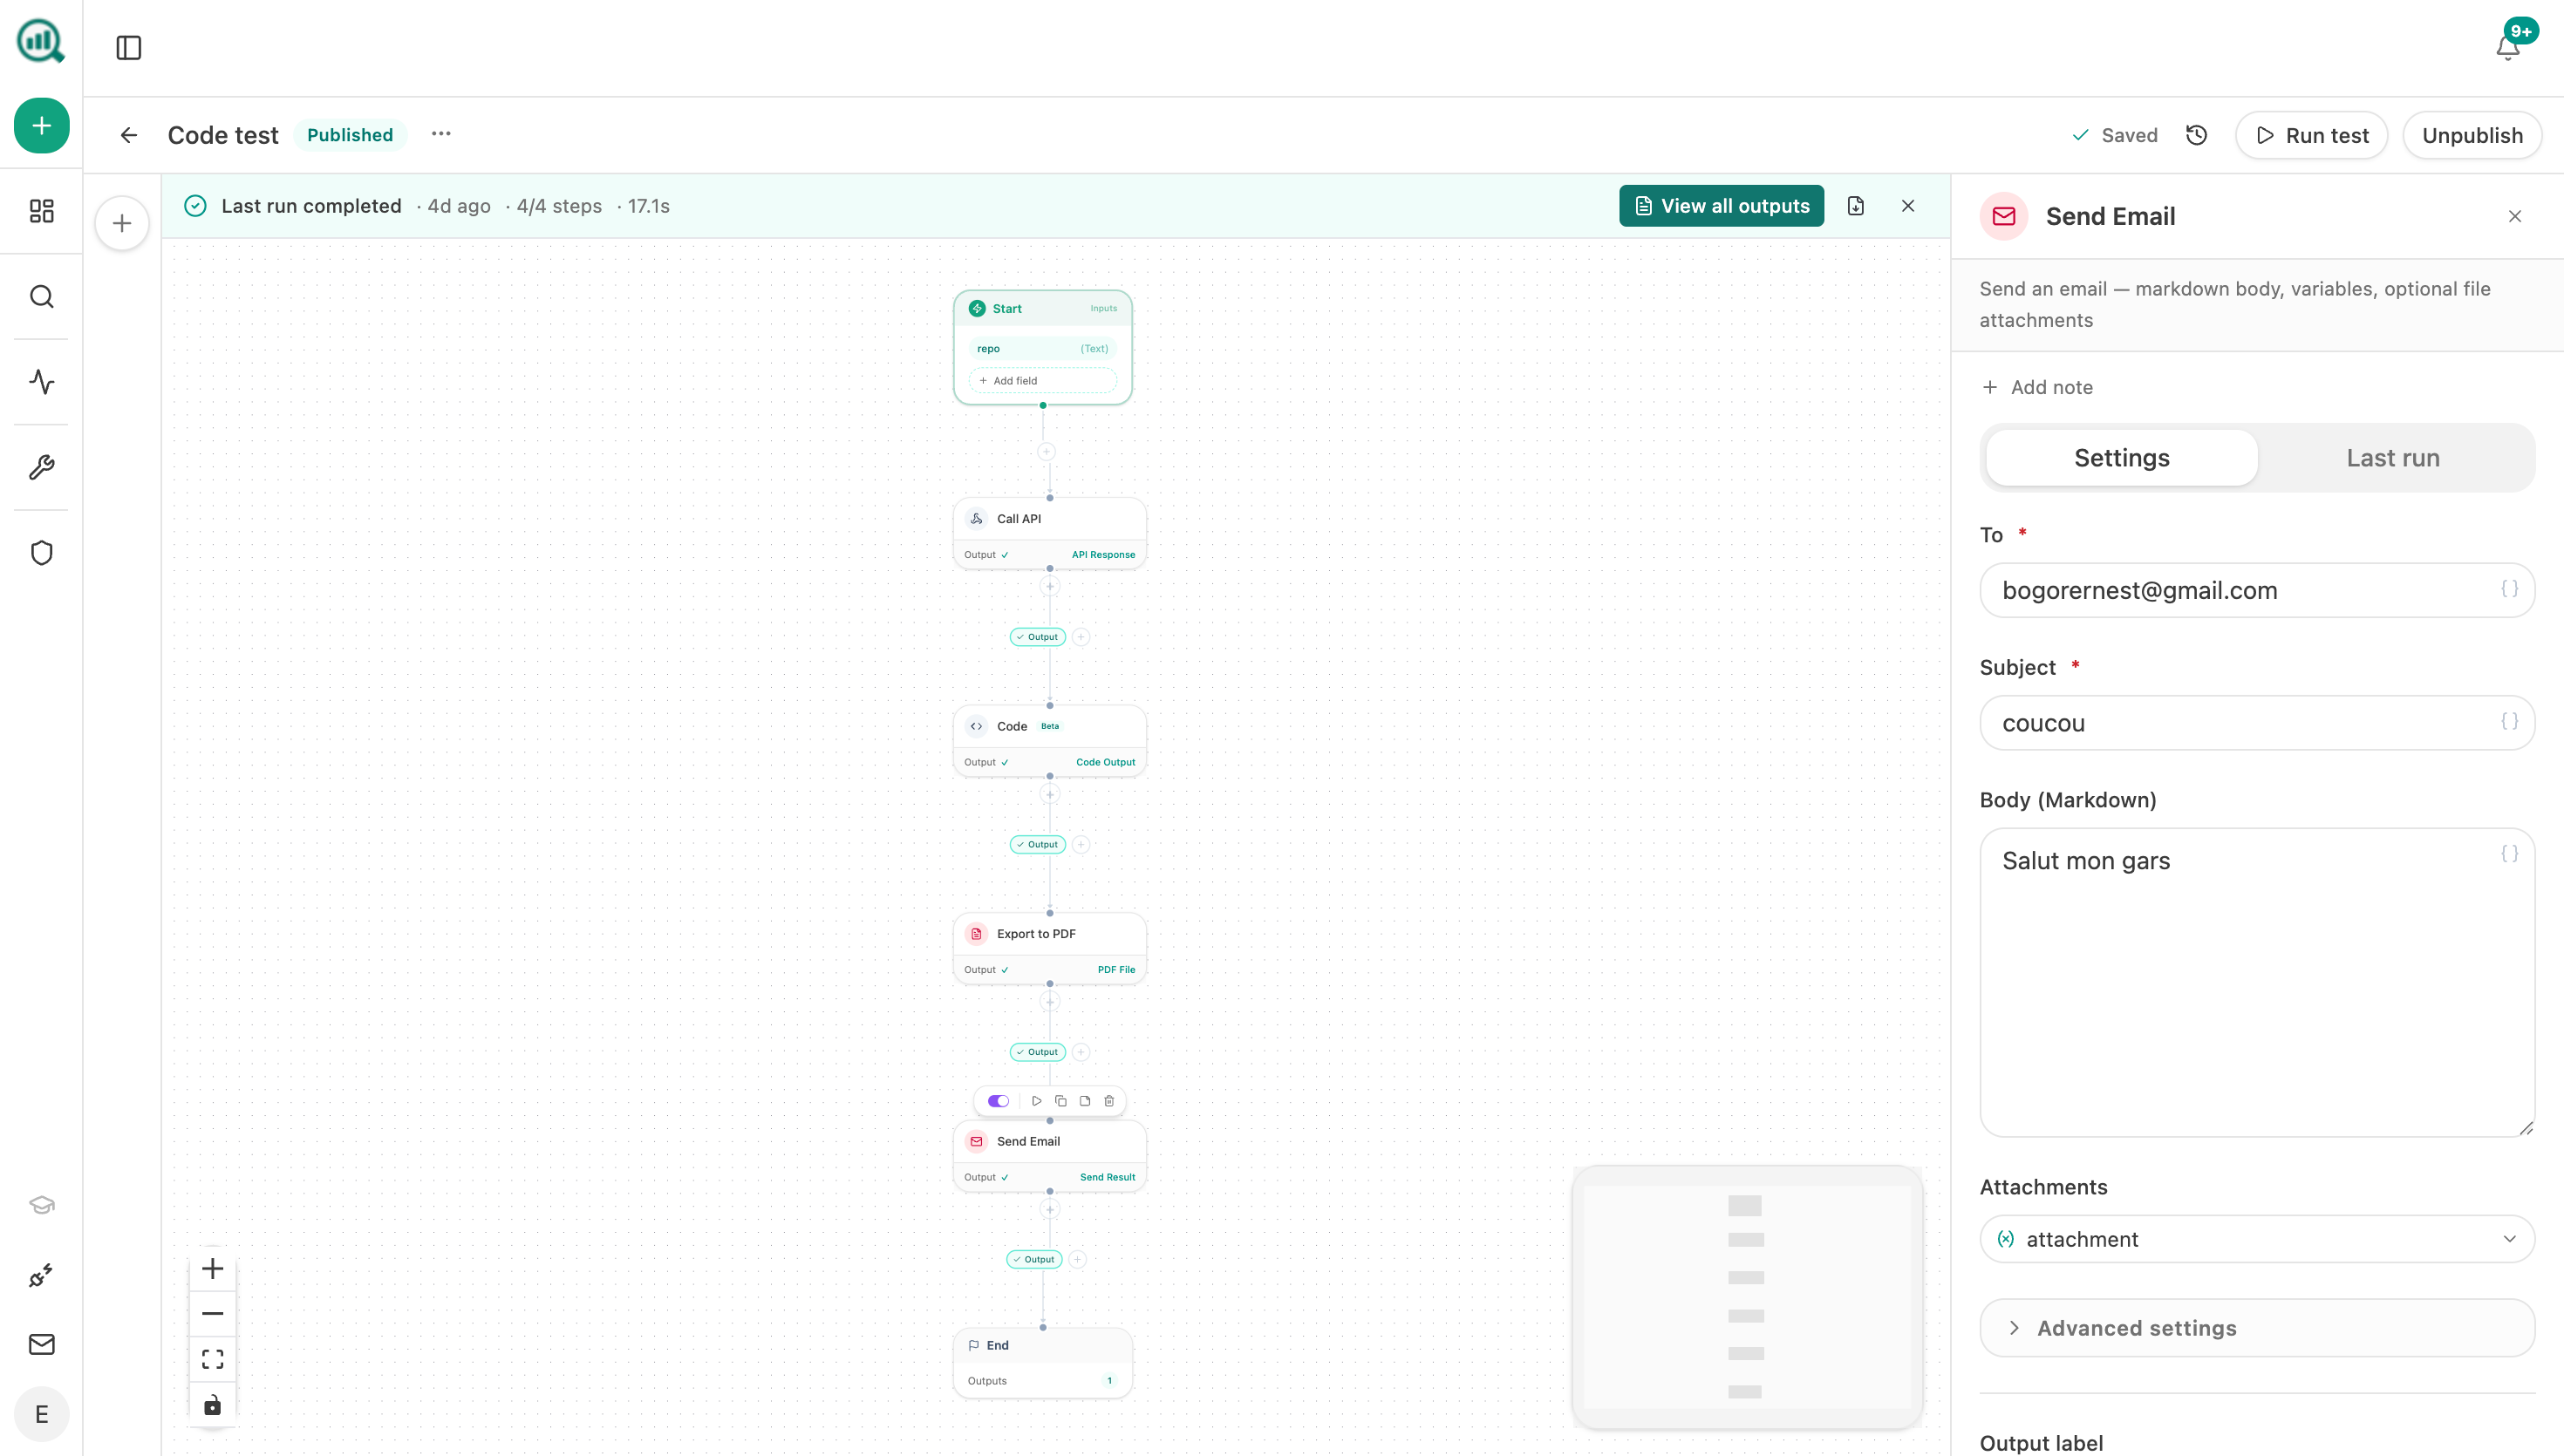
Two details worth copying. Capturing the before-state at publish time rather than reconstructing it later means you always have a clean pre-change series, which is the thing manual logs never have. And the Conditional branching on lag fit is what stops the report offering a change from four days ago as the explanation for a dip that takes six weeks to appear.
The AI visibility line in that investigation agent is increasingly the one that resolves otherwise inexplicable dips.
FAQ
Related answers
- What can I honestly claim from an SEO before-and-after analysis?
- How do I test whether an organic lift was real and not seasonal or brand-driven?
- How do I set an attribution baseline before changing our content strategy?
- How do I calculate the revenue at risk from an unresolved SEO problem?
Want a change log that writes itself at publish time? Start a free Analyze AI trial and wire it to your CMS as a webhook agent.