
How do I test whether an organic lift was real and not seasonal or brand-driven?
Short answer
Run four tests in ascending order of strength: index the lift against the same period last year, strip branded queries out, compare against a control set of pages you didn't touch, and check whether the category moved. A lift that survives all four is real. Most apparent lifts fail at test two or three, usually because branded search grew or the whole category did.
Test 1: year-over-year indexing
The cheapest test, and it eliminates the most false positives.
Compare the lift period against the same weeks last year rather than against the preceding period. If your category peaks in September every year, a September-over-August comparison will show a lift that has nothing to do with your work.
Compute the year-over-year growth rate for the affected pages and for your site overall. If the affected pages grew at roughly the site rate, you've found seasonality rather than an effect.
Test 2: strip branded queries
Branded search is downstream of everything, so a lift driven by branded volume tells you a brand event happened, not that your SEO worked.
Apply your saved branded regex in Search Console and recompute the lift on non-brand clicks only. If the lift disappears, the cause is upstream of search: a funding announcement, a podcast, a competitor's outage, PR.
The regex needs to be the same one you used at baseline. A regex that quietly grows will shrink your non-brand numbers over time and create the opposite illusion. See How much of our organic revenue is new demand versus branded demand capture?.
Test 3: the control group
This is the test that upgrades your claim from "consistent with" to something close to causal.
Take a set of pages you didn't touch, matched on intent, traffic band, and age. Track them across the identical window. Then difference the two growth rates.
If your refreshed pages grew 34% and matched untouched pages grew 6%, your attributable lift is roughly 28 points, not 34. If the control set grew 31%, you have almost nothing.
Select the control set before you intervene. Choosing it afterwards means choosing pages that flatter the result, and you'll know.
Test 4: category movement
The subtlest failure. Your traffic grew 18%, and the category grew 25%, so you lost share while your chart pointed up.
Check total category search volume for your head terms year-over-year, and check whether competitors moved in the same direction over the same window. Growing slower than your category is a loss dressed as a win, and it's the version most likely to survive an internal review unchallenged.
The fifth test that's now necessary
Add one more before you conclude: did AI visibility move?
Our own state of AI search research, covering more than 22,000 answers, found Google AI Mode returns a citation-rich answer in 97.4% of matched B2B queries and Perplexity in 93.2%. It also found presence is sticky, with next-observation mention probability at 83.2% on ChatGPT after a mention versus 9.9% after a miss.
Two consequences. A click loss can come from an AI surface starting to answer the query directly, with your page unchanged. And a branded-search lift can be the delayed tail of citations earned two months earlier, landing on whatever shipped most recently.
Because presence is lumpy, one reading isn't a measurement. Researchers make the point that visibility should be treated as a distribution across runs, prompts, and time, so check an eight-week average rather than a single week.
What surviving all five entitles you to say
If the lift holds year-over-year, holds on non-brand, exceeds a matched control, outpaces the category, and isn't explained by an AI visibility shift, you can state it as attributable with the method described.
If it fails any one, say which. "Traffic rose 34%, but a matched control set rose 29%, so the attributable lift is around 5 points" is a genuinely useful sentence, and reporting it protects every future number you present.
How Analyze AI runs the five tests
The arithmetic here has right answers, so the goal is a workflow that computes it identically each time rather than an analyst re-deriving it under time pressure.
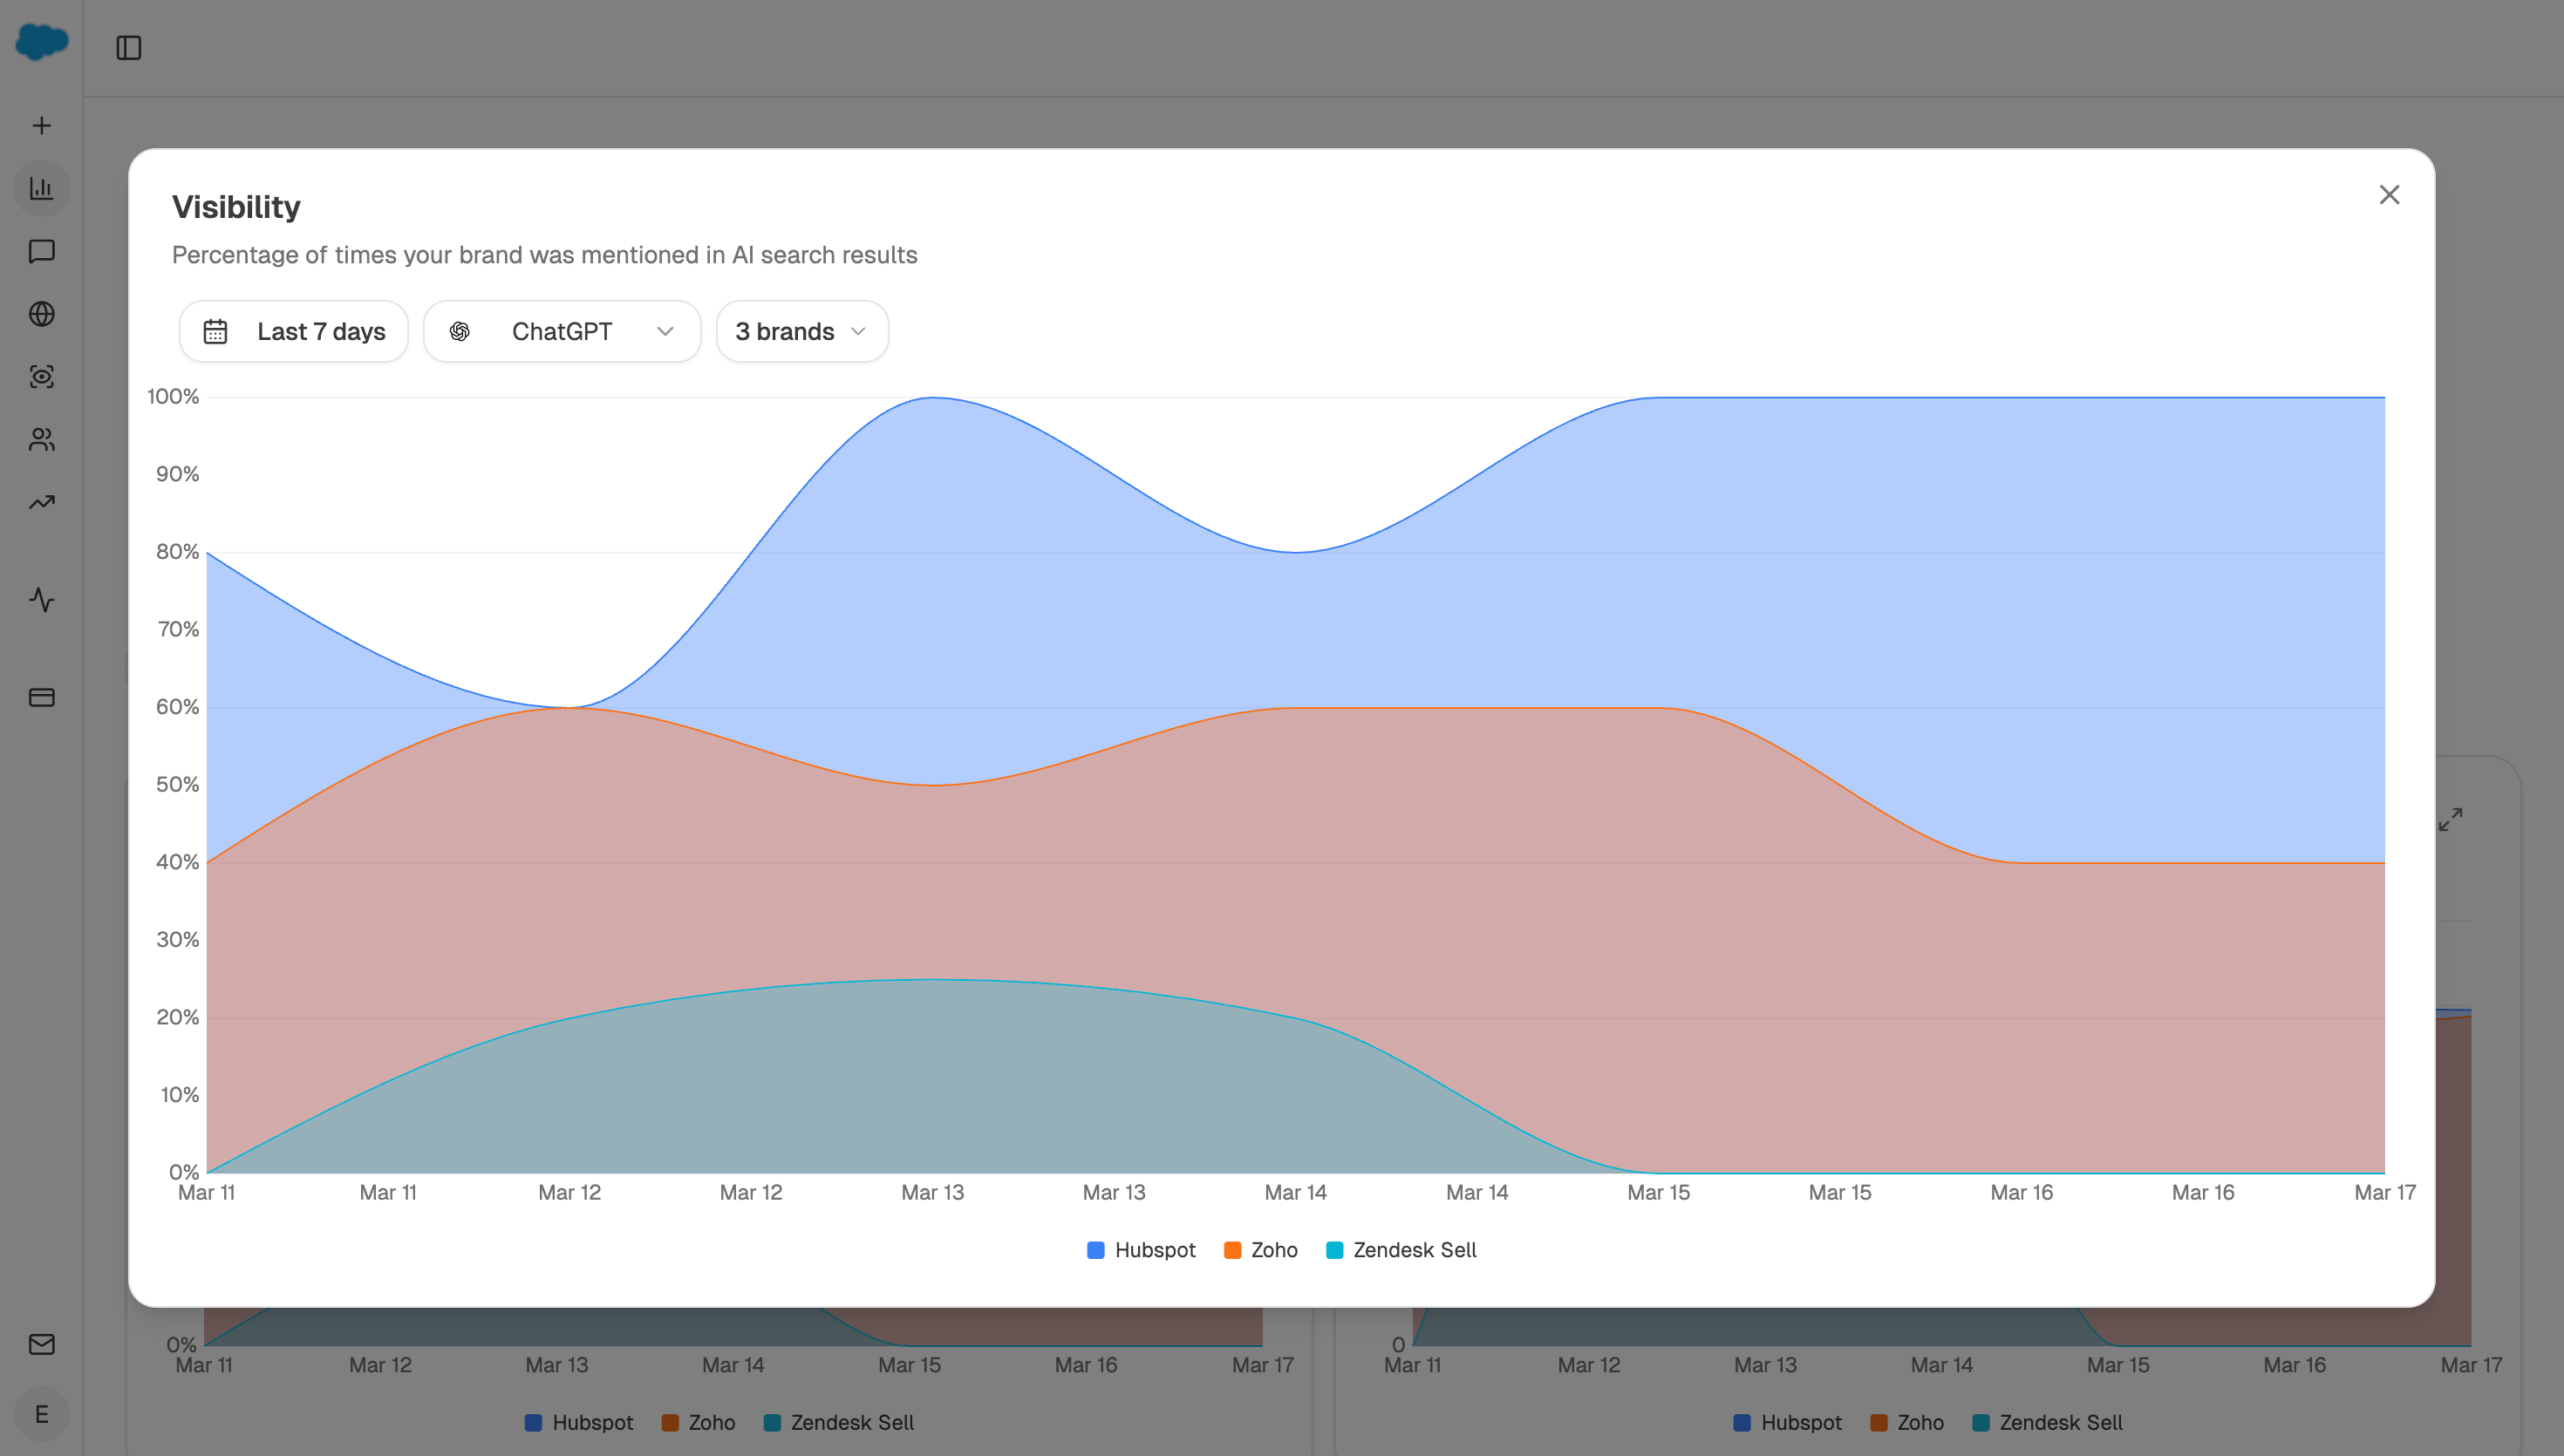
GSC Page Performance Summary returns a daily time series per page, which is what year-over-year indexing and control-group differencing need. Top Keywords for Site with your branded regex supplies test two from the same run. Get Visibility Events returns month-over-month visibility shifts per provider for test five, and share-of-voice gives the level against tracked competitors for test four.
The Code node is where the tests actually live. Year-over-year indexing, branded stripping, control differencing, and category adjustment are all deterministic calculations, and putting them in JavaScript with declared inputs and outputs means the method is reviewable and stable rather than re-described in a prompt each month.
A workable chain:
Start (schedule, monthly) → GSC Page Performance Summary (intervention set, daily, 24 months) → GSC Page Performance Summary (pre-registered control set) → GSC Top Keywords for Site (branded regex) → Get Visibility Events → share-of-voice recipe → Code (run all five tests, return a pass or fail per test with the adjusted lift figure) → Conditional (if any test fails, route to a narrative that names which one) → Prompt LLM (write the claim at the strength the surviving tests support) → DOCX export → Send Email.
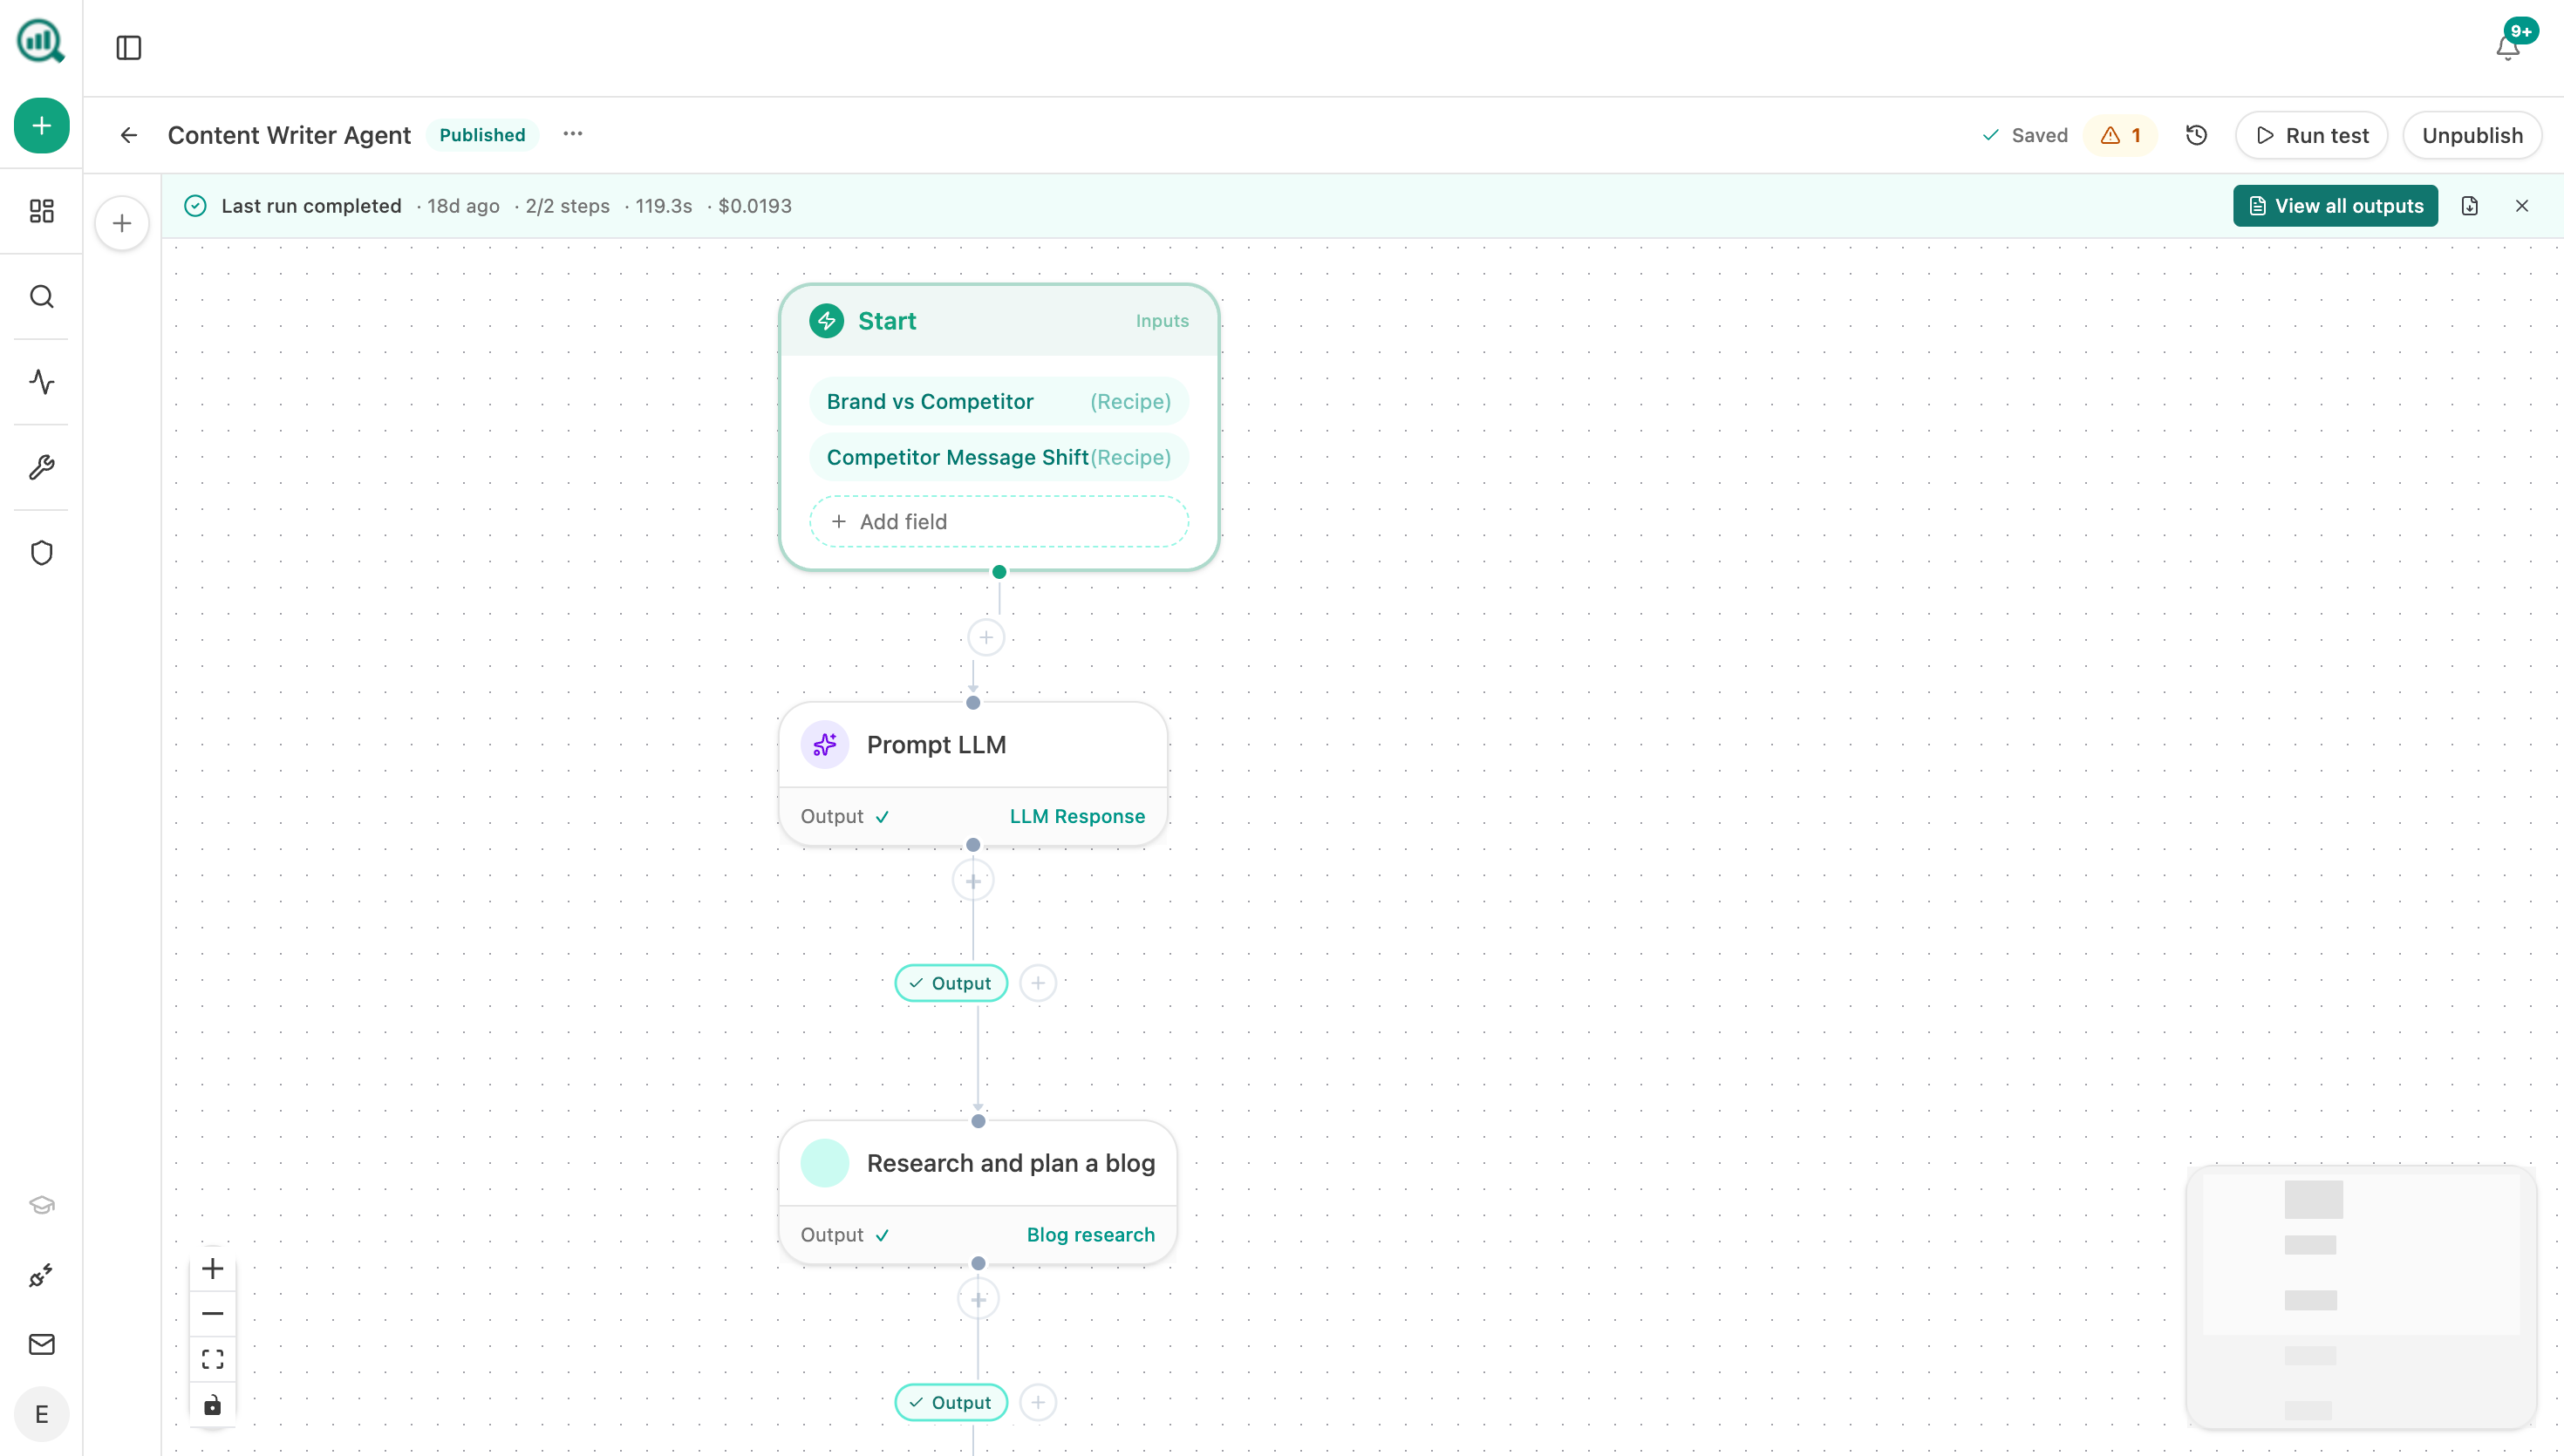
The Conditional is what keeps the report honest under pressure. A month where the control set grew as fast as the intervention set produces a different narrative automatically, rather than depending on whoever is writing the summary to volunteer bad news.
For test five, the AI visibility series comes from the same run, so you never have to reconcile two exports taken on different dates.
FAQ
Related answers
- What can I honestly claim from an SEO before-and-after analysis?
- How do I tell branded organic conversions apart from demand created by paid campaigns?
- How do I set an attribution baseline before changing our content strategy?
- How do I keep track of which site changes caused which traffic changes?
Want the five tests run automatically every month? Start a free Analyze AI trial and connect GSC alongside AI visibility tracking.