
How do I measure the impact of AI Overviews on my site's clicks?
Short answer
Compare click-through rate on queries where an AI Overview appears against comparable queries where it doesn't, holding position constant. Google's generative AI report gives you impressions but no click or CTR data for AI surfaces, so you can't read the impact directly. The workable method is a CTR decay analysis on matched query sets, and the effect is heavily concentrated in informational queries rather than spread evenly.
What Google gives you, and what it withholds
Search Console gained a dedicated generative AI performance report in June 2026. It shows impressions, pages, countries, devices, and dates for AI Overviews, AI Mode, and generative AI features in Discover.
It does not show clicks, CTR, or query data for those surfaces. That's a deliberate boundary rather than a gap that's about to close, and it means "what did AI Overviews cost me in traffic" cannot be answered from the report directly.
Two further constraints matter for any analysis you build on it. AI impressions were always included in your overall performance totals, so this is a breakout rather than new data, and your aggregate numbers don't change. And all links within an AI Overview share a single position, so per-link ranking inside an answer isn't something you can optimise against.
The CTR decay method
Since you can't read the impact, you infer it from CTR on queries you can classify.
Step 1. Classify your queries by AI Overview presence. Search Console won't tell you, so you need SERP data. Sample your top few hundred queries and record whether an Overview appears.
Step 2. Match the two groups. Pair AI-present queries with AI-absent queries at similar average position, similar volume, and similar intent. Position matters most, because CTR falls steeply with rank and an unmatched comparison measures rank rather than Overviews.
Step 3. Compare CTR within position bands. Position 1 to 3 with an Overview against position 1 to 3 without. Then 4 to 10.
Step 4. Read the gap by intent, not in aggregate. This is where the finding actually lives.
The effect is not evenly distributed
Aggregate numbers on this are misleading, because the impact concentrates almost entirely at the top of the funnel.
| Query type | Typical CTR impact |
|---|---|
| Pure informational ("what is X") | Large reduction, the answer resolves the query |
| Product-adjacent JTBD | Moderate reduction |
| Comparison and alternative | Small, sometimes neutral |
| Bottom-funnel commercial | Small, occasionally positive |
The pattern makes sense. An Overview that fully answers a definitional question removes the reason to click. An Overview surfacing three vendors for a commercial query often sends a better-qualified visitor than a blue link did.
So "AI Overviews cost us 18% of clicks" is almost always the wrong summary. "Informational queries lost 40%, commercial queries were flat" is the one that leads to a budget decision.
Two complications to build in
Query fan-out. Google's documentation notes that AI Overviews and AI Mode may issue multiple related searches across subtopics to build a response. Your page can be cited against a subtopic query the user never typed, so impressions may appear against queries with no relationship to your tracked set.
Zero-click exposure still has value. An Overview citing you without a click is brand exposure. Our own state of AI search research, covering more than 22,000 answers, found citation presence reaches 97.4% on Google AI Mode, and Pew Research found that when an AI summary appears, users click a source link in only about 1% of visits. Counting only lost clicks measures the cost and none of the benefit.
How Analyze AI runs the analysis
The hard part is step one, because Search Console won't classify your queries and doing it manually across a few hundred queries is a day of work each time.
The Google Search node runs a DataForSEO SERP request, which returns the SERP features present for a query including AI Overview presence. Wrapped in a Loop, it classifies your whole query set in one run instead of by hand.
GSC Page Performance Summary returns a daily time series per page, and Page-Keyword Breakdown returns every query driving clicks to a page, which together supply the CTR series the comparison needs.
The Query Fanout Estimator estimates how many related long-tail queries a piece could capture through semantic relevance, which is the closest available handle on the fan-out problem. Pages with high fan-out potential are the ones most likely to earn impressions against subtopic queries you never tracked.
The analysis agent:
Start (schedule, monthly) → GSC Top Keywords for Site (top 300 queries, 90d) → Loop / For Each over queries → Google Search node per query (detect AI Overview presence) → Code (match AI-present against AI-absent queries on position, volume, and intent, then compute CTR delta per position band and per intent bucket) → GSC Page Performance Summary on affected pages → Query Fanout Estimator on the top affected pages → Prompt LLM (report CTR impact split by intent, flag pages where impressions rose while clicks fell) → Excel export → Send Email to the SEO lead.
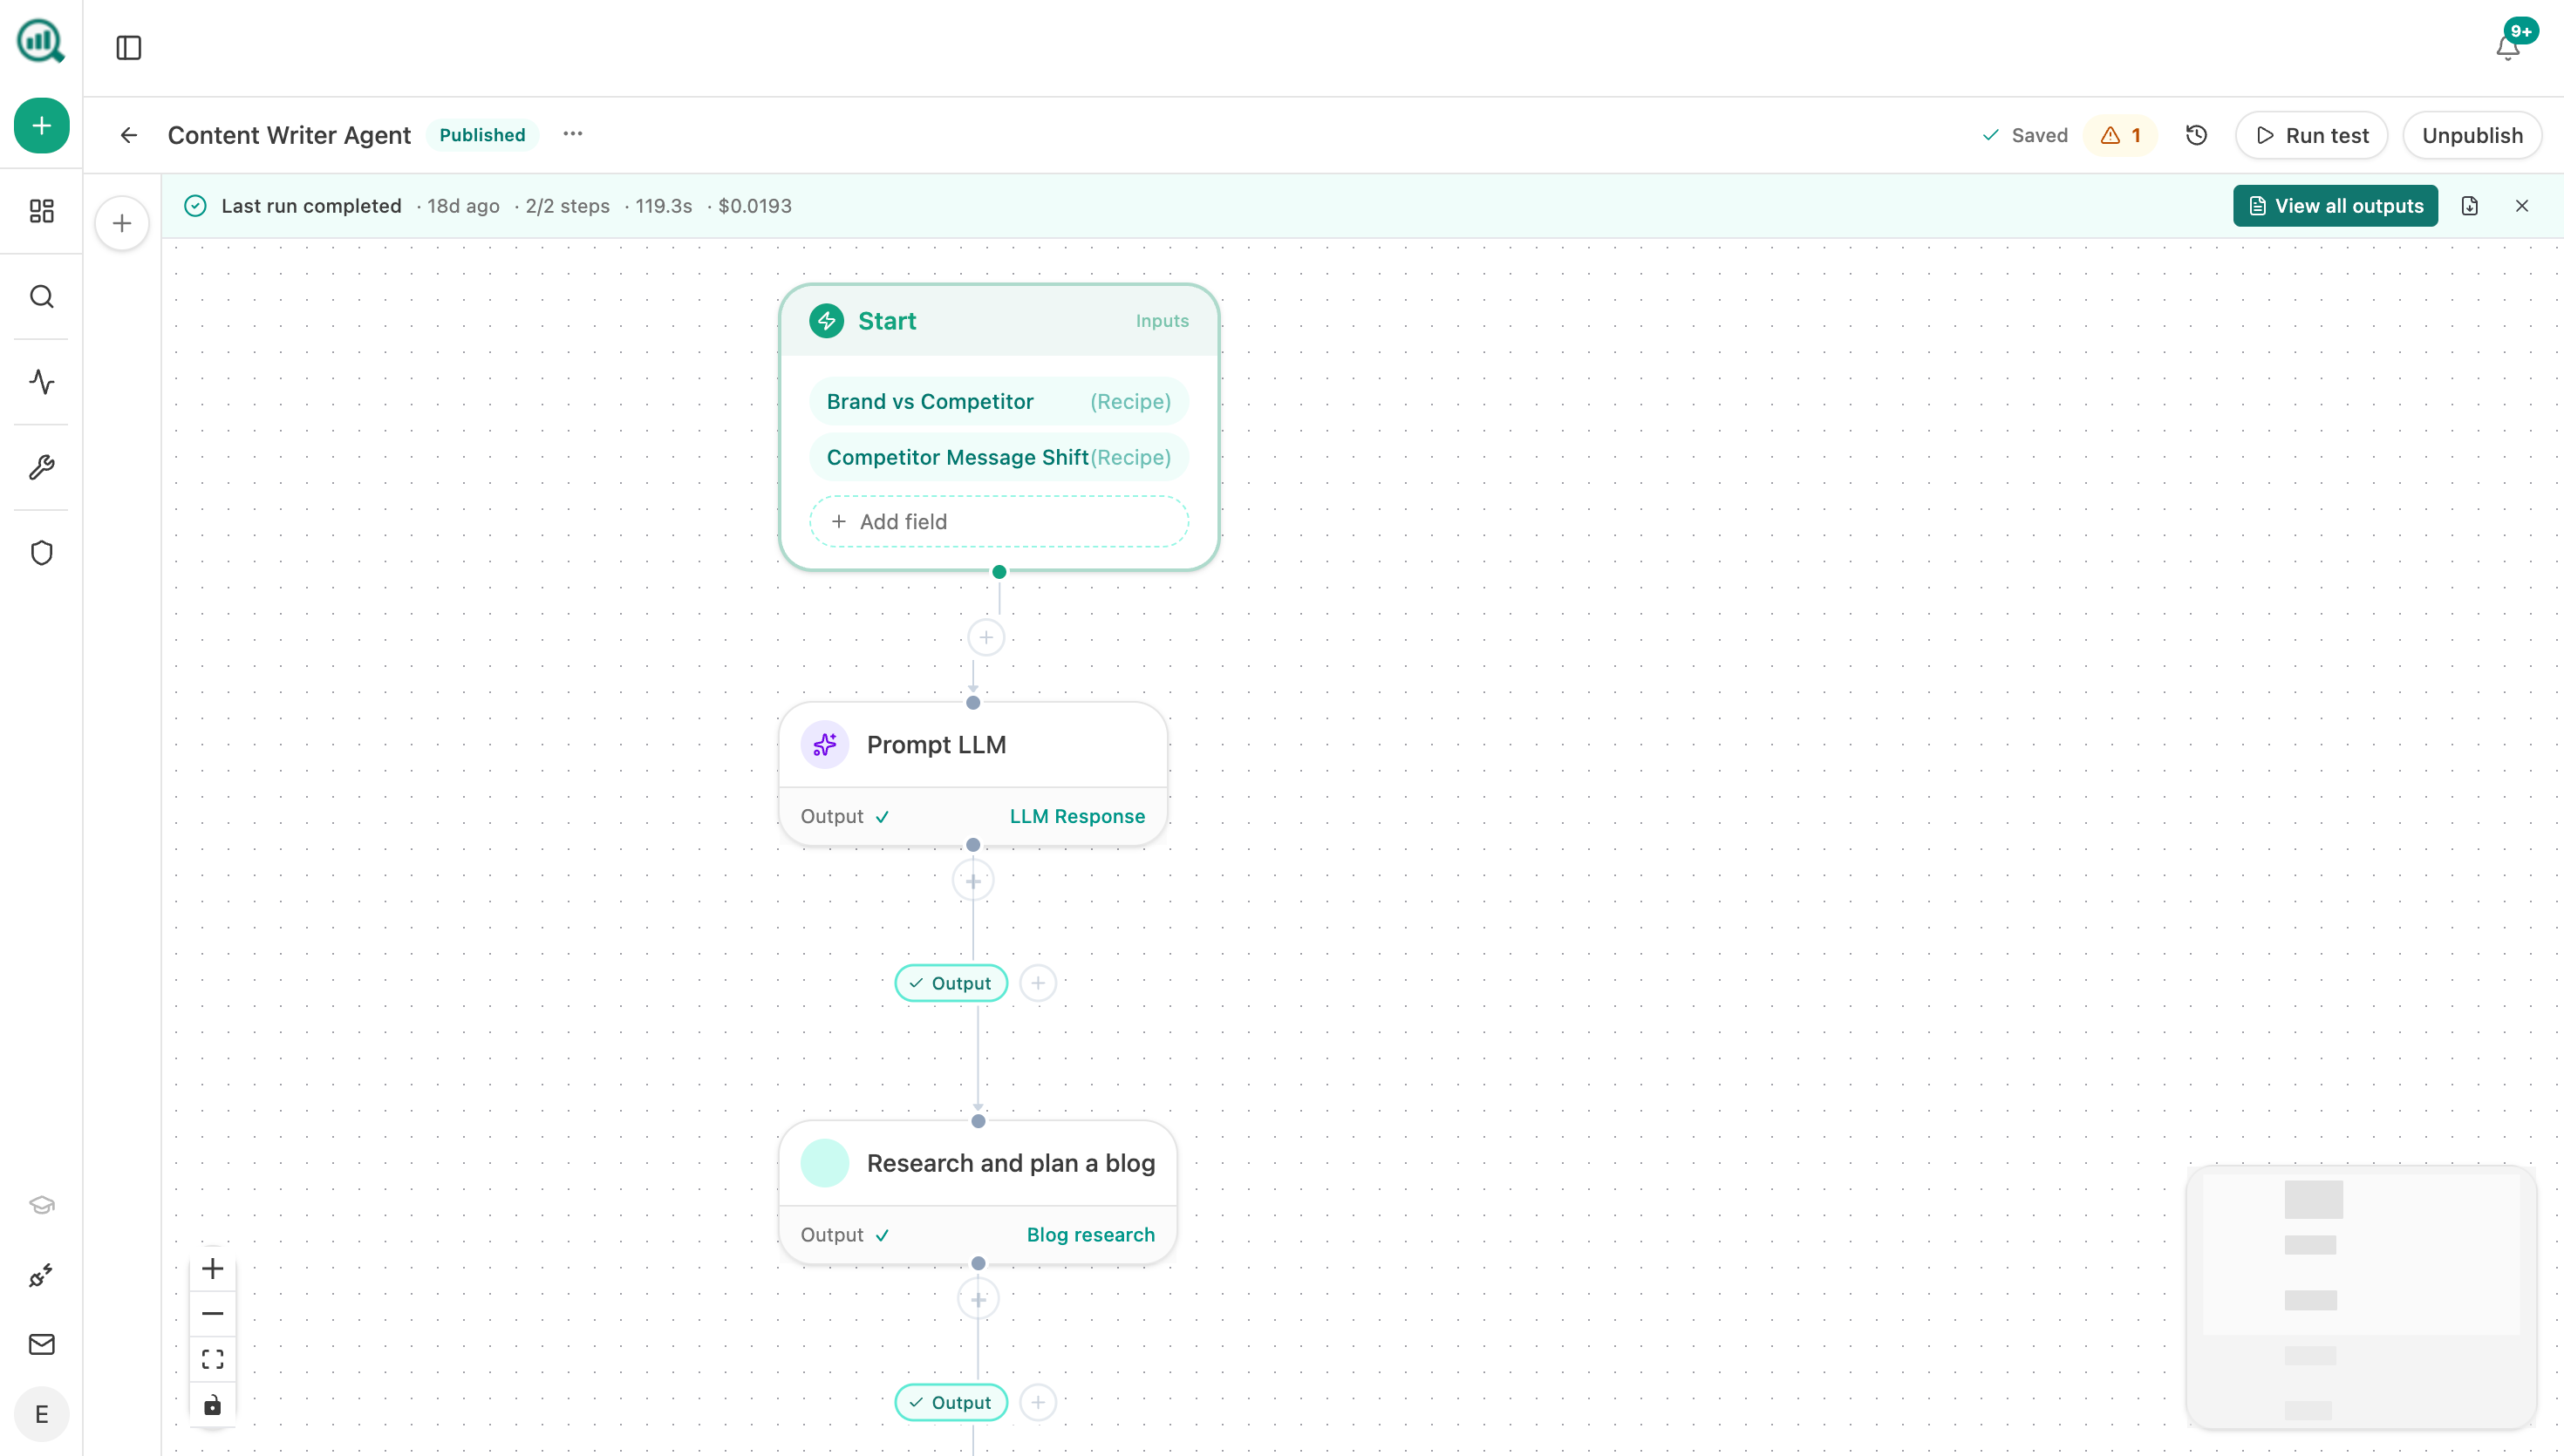
The Loop plus Google Search combination is what makes this repeatable. Classifying 300 queries by hand once is feasible and doing it monthly isn't, which is why most teams measure this once and never again.
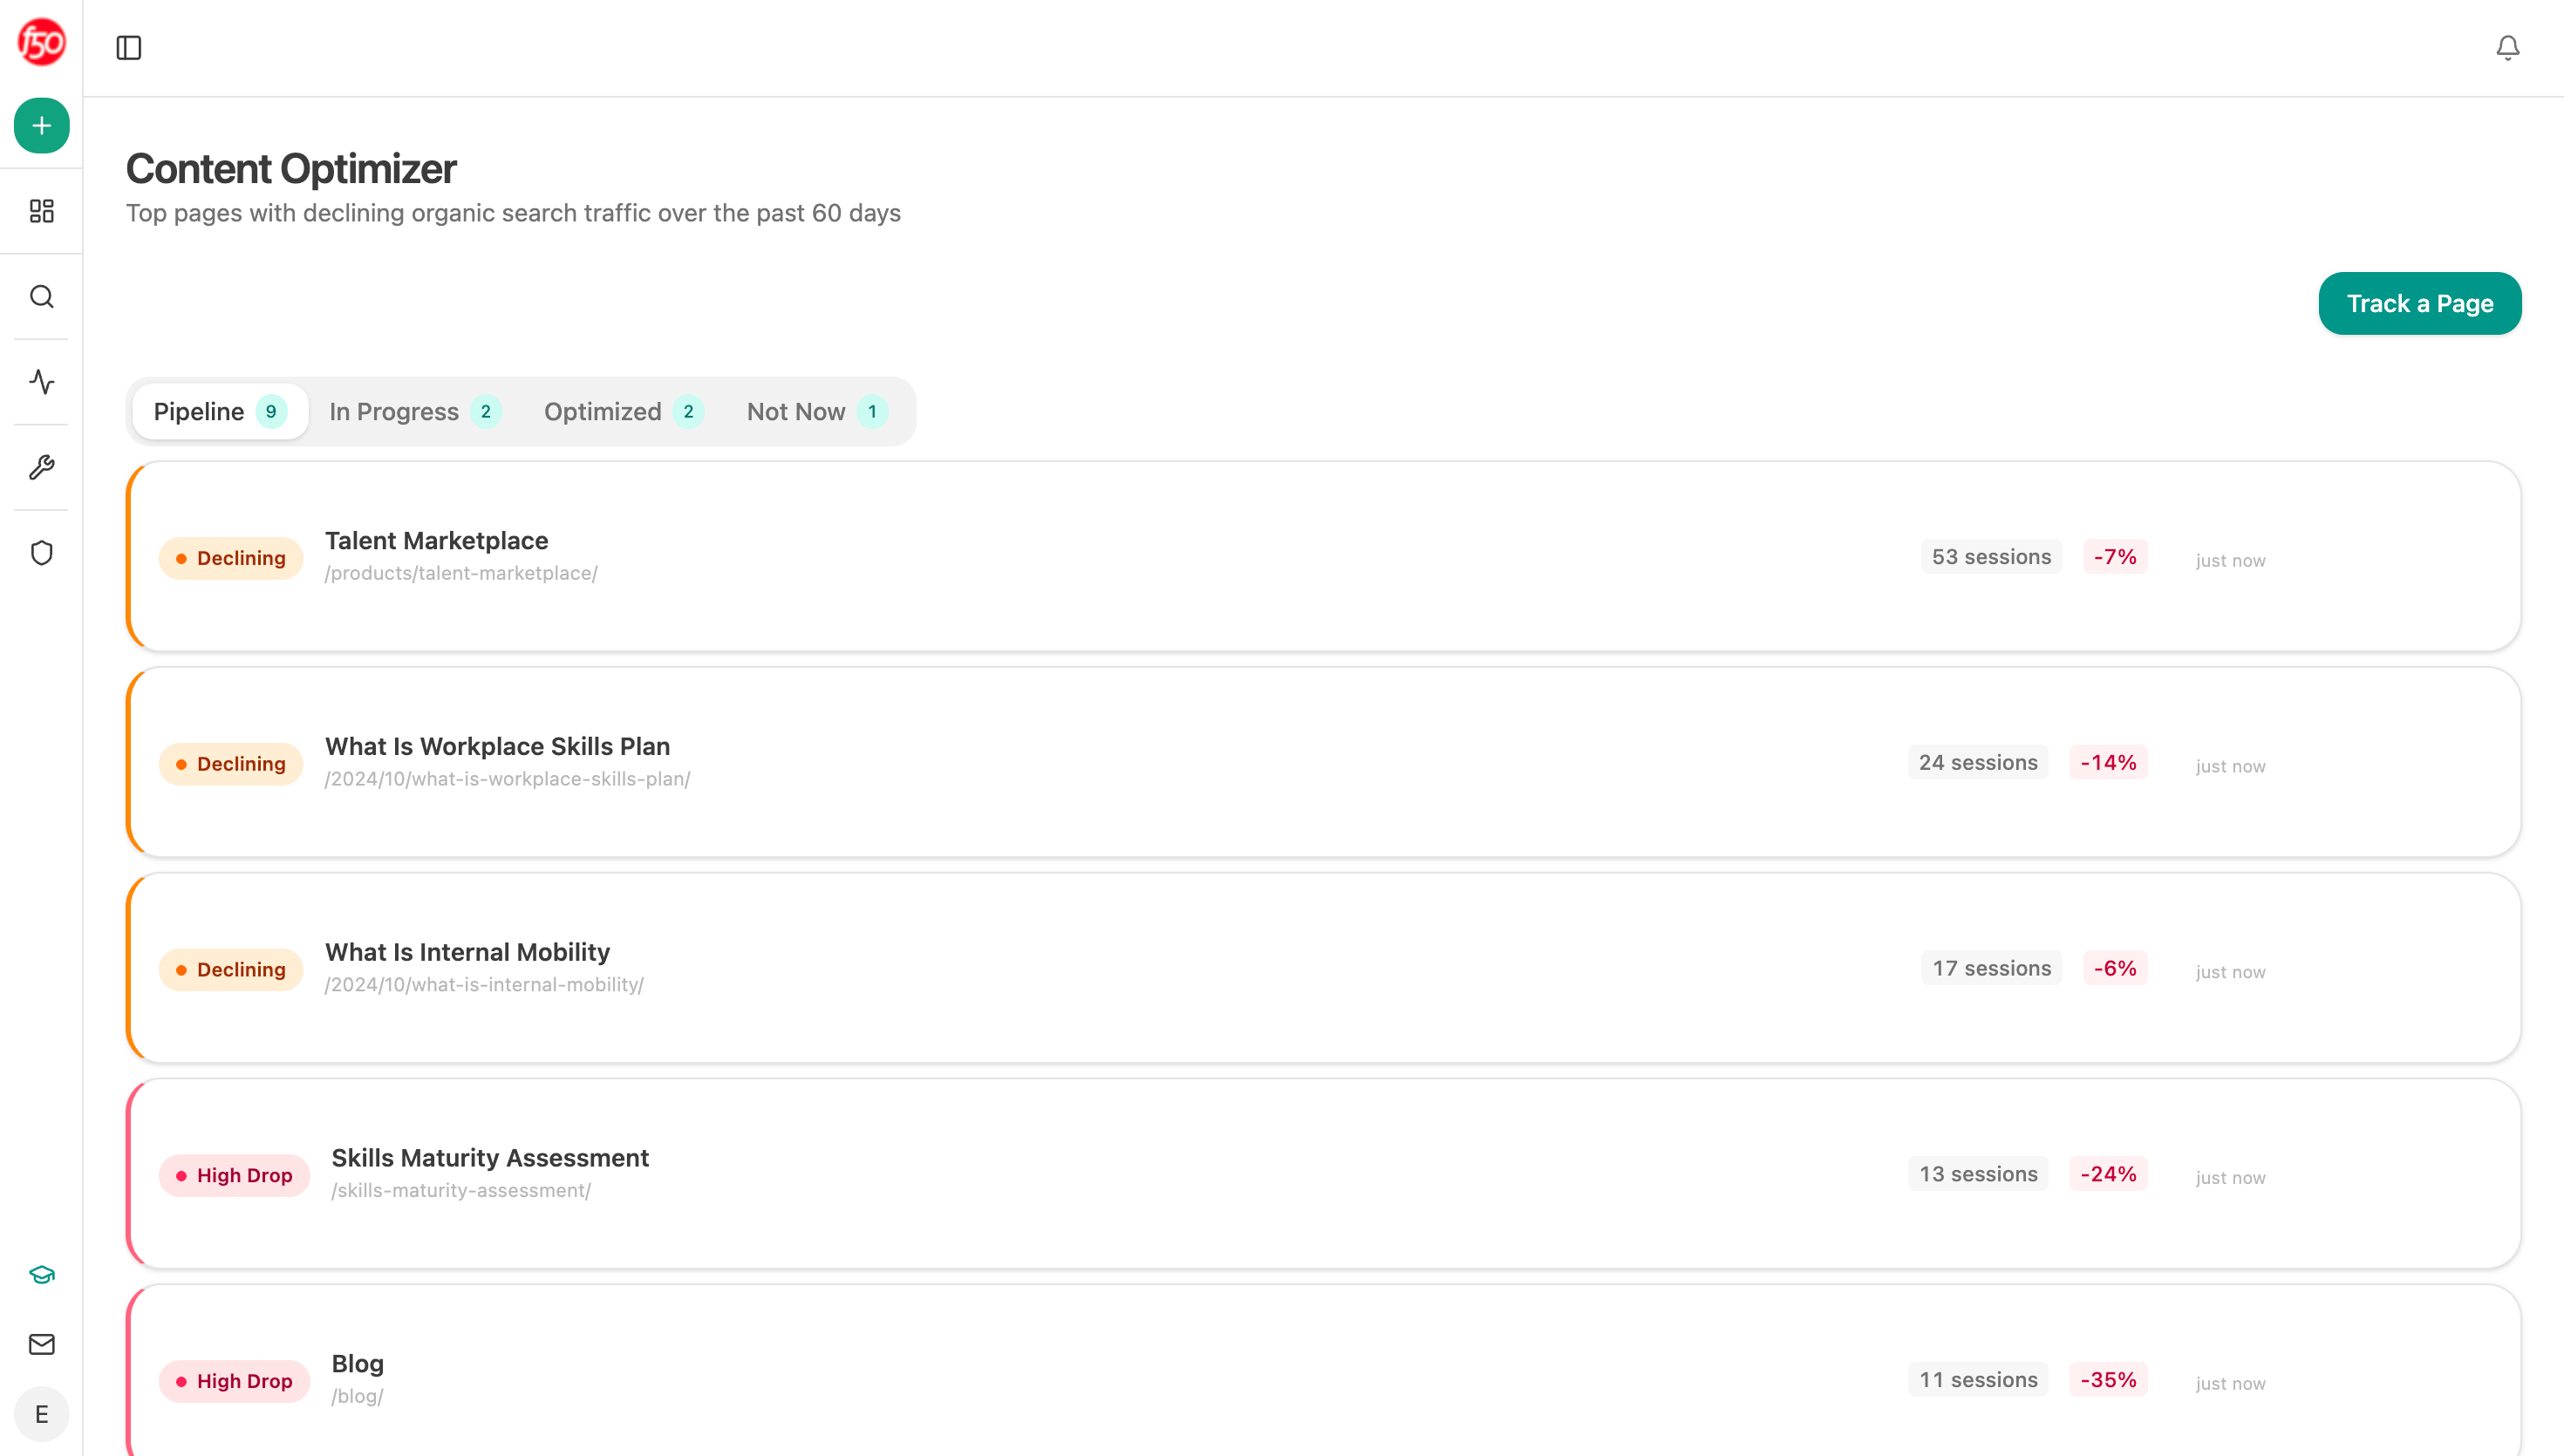
The pages flagged as "impressions up, clicks down" are the actionable output. Those are pages Google's AI is using as a source without sending traffic, and they're candidates for the AEO work that makes you the cited authority rather than one of five sources.
FAQ
Related answers
- What can Google Search Console's new generative-AI performance report actually show me?
- How should I budget for SEO when AI answers are reducing organic clicks?
Want your query set classified for AI Overview presence every month? Start a free Analyze AI trial and run the CTR comparison automatically.