
How do I tell branded organic conversions apart from demand created by paid campaigns?
Short answer
Branded search is almost never the cause of a conversion, it's the effect of something upstream. Separate the causes by correlating branded search volume against each upstream channel's activity with a 2 to 12 week lag, then confirm with a geographic or temporal holdout where you pause one channel and watch what happens to branded volume. Correlation alone will over-credit whichever channel spent the most.
Branded search is a downstream metric
Someone searching your brand name has already been introduced to you. The introduction came from somewhere: a paid campaign, a podcast, an AI answer, a colleague, a conference.
Attribution systems record the branded search and stop there, which is why branded organic looks like your best-converting channel in every report. It converts well because the buyer had already decided, not because the channel persuaded anyone.
The real question is which upstream channel created the demand that branded search harvested. That's a different analysis than attribution, and it needs different methods.
Method 1: lag correlation
Pull monthly series for at least 24 months:
- Branded search impressions and clicks from Search Console, using a saved branded regex
- Paid spend by channel
- AI-search citation share on your commercial prompt set
- PR placements and podcast appearances
- Product launches and funding announcements
Then test each upstream series against branded search at several lags. Paid social typically shows a 2 to 6 week lag. Paid search on category terms is faster, 1 to 3 weeks. PR spikes and then decays quickly. AI-search visibility runs longer, 4 to 12 weeks, because the buyer's consideration window sits between exposure and search.
Two cautions. Correlation will favour whichever channel has the largest spend variance, which isn't the same as the largest effect. And several of these channels move together, so a channel that always launches alongside a product release will absorb credit that belongs to the release.
Method 2: the holdout, which is what actually proves it
Correlation gets you a hypothesis. A holdout gets you an answer.
Geographic holdout. Pause one channel in one region while leaving it running elsewhere. Compare branded search volume in the paused region against the control region over the following 8 to 12 weeks. This is the cleanest evidence available to most teams.
Temporal holdout. Pause a channel entirely for four to six weeks and watch branded volume. Weaker, because seasonality and everything else keeps moving, but usable when you can't split geographically.
Run holdouts one channel at a time and long enough to clear the lag you identified in method 1. A two-week holdout on a channel with an eight-week lag measures nothing.
For the general version of isolating a lift from its confounders, see How do I test whether an organic lift was real and not seasonal or brand-driven?.
The upstream channel most teams don't measure
AI answers are now a significant introduction mechanism, and they're invisible in every branded-search analysis that only compares paid against PR.
Our own state of AI search research, covering more than 22,000 answers, found Google AI Mode returns a citation-rich answer in 97.4% of matched B2B queries and Perplexity in 93.2%. It also found the exposure persists: once a brand is mentioned for a specific prompt, next-observation mention probability is 83.2% on ChatGPT, 83.3% on Perplexity, and 84.2% on Google AI Mode, against roughly 10% after a miss.
That persistence produces a distinctive signature in the lag analysis. Paid-driven branded search spikes and decays with spend. AI-driven branded search accumulates gradually and holds after visibility work stops, because the citations keep appearing. This is also why one month's reading proves nothing on its own, and why researchers argue visibility should be measured as a distribution across runs, prompts, and time.
If your branded volume has a rising floor that paid spend doesn't explain, AI-search visibility is the likeliest cause, and the signup survey will corroborate it.
Reporting the split
| Upstream channel | Evidence type | Confidence |
|---|---|---|
| Paid, with a geo holdout | Experimental | High |
| Paid, correlation only | Correlational | Moderate, state the confound |
| PR and events | Correlational, spiky | Moderate |
| AI-search visibility | Lag correlation plus survey | Moderate, triangulated |
| Word of mouth | Survey only | Low but real |
Present branded organic conversions as a harvest number, then show your best estimate of which upstream channels filled the pipeline it harvested from. Never present branded organic as a channel that created anything.
How Analyze AI supplies the missing series
The lag analysis needs one series most stacks can't produce: AI-search citation share over time, on the prompts your buyers actually use.
Get Visibility Events returns month-over-month visibility shifts per provider, which is the shape this analysis needs rather than a single current-state percentage. Share-of-voice gives the level, visibility events give the movement, and it's the movement that correlates against branded search.
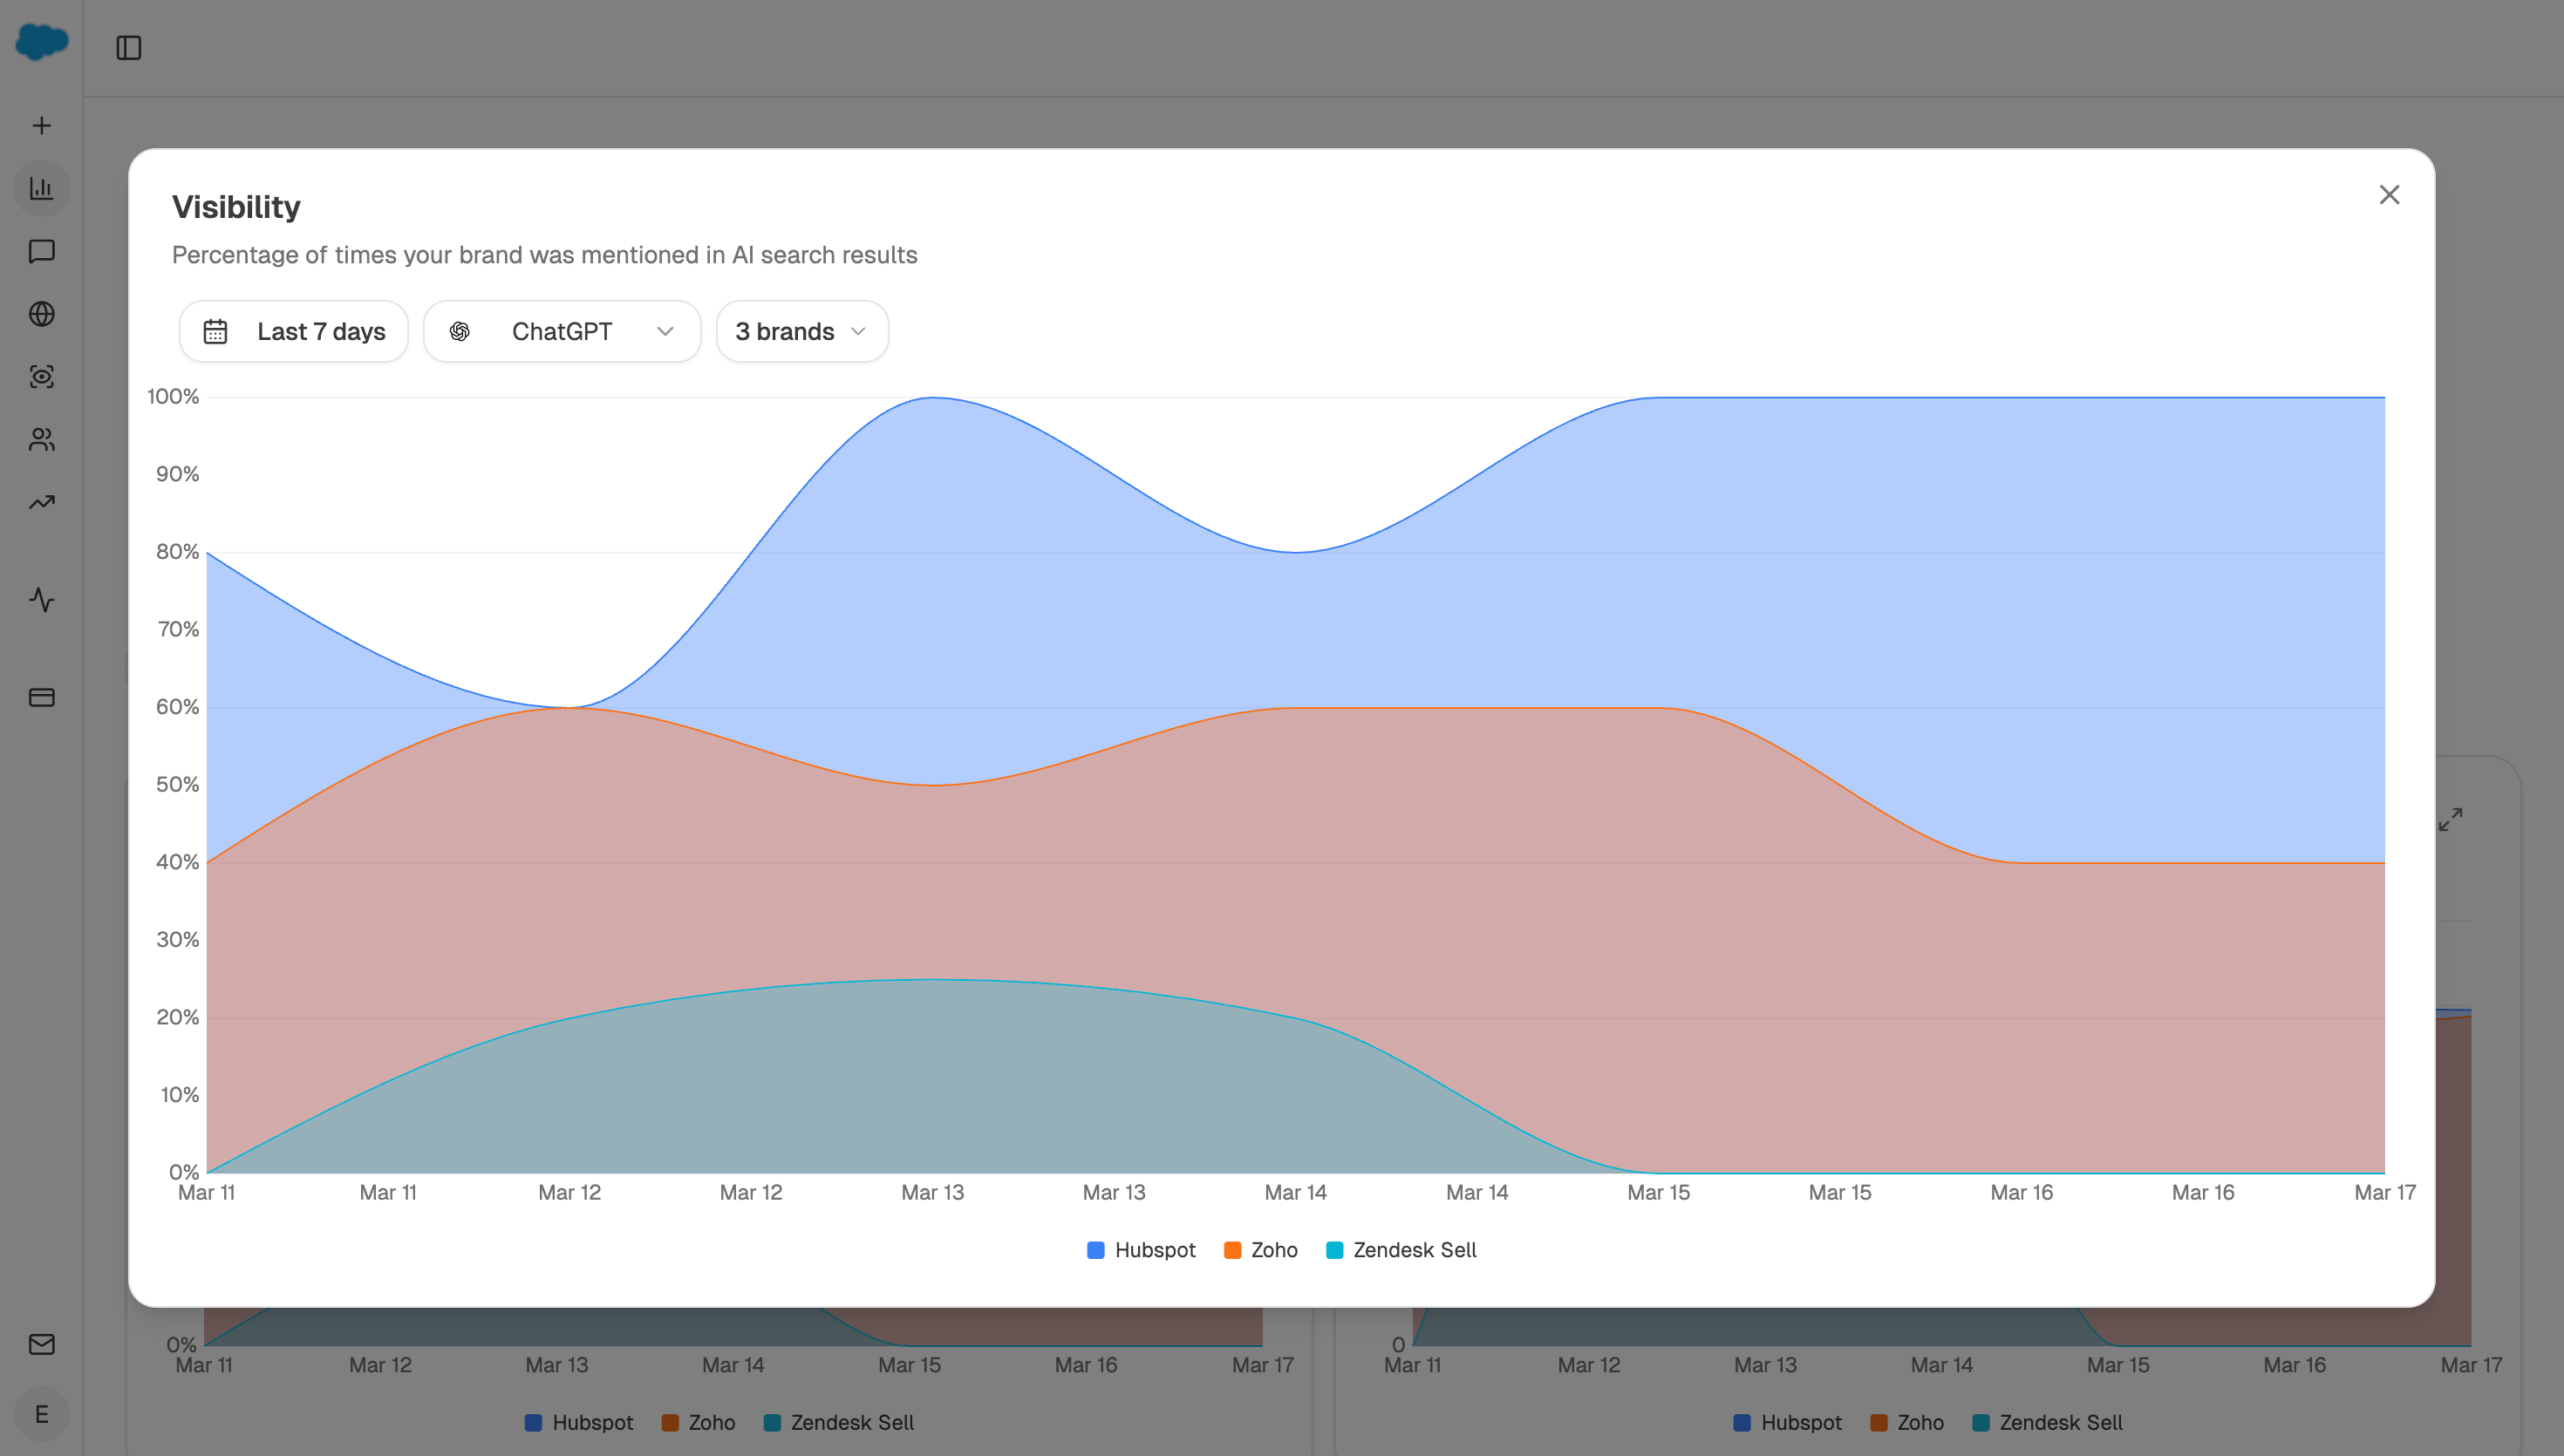
On the search side, GSC Top Keywords for Site with a branded regex gives you the downstream series from the same workflow, so both halves of the correlation come from one run rather than two exports that drift out of alignment.
A workable chain, using Wait to build the lag structure explicitly:
Start (schedule, 1st of month) → GSC Top Keywords for Site (branded regex, 24 months) → Get Visibility Events (month-over-month per provider) → share-of-voice recipe → HubSpot Get CRM Objects (branded-first-touch customers with survey answers) → Code (compute cross-correlation at 2, 4, 8, and 12 week lags) → Prompt LLM (rank upstream channels by lagged correlation strength, flag confounds, note which need a holdout to confirm) → Excel export → Send Email to CMO.
Putting the cross-correlation in a Code node rather than a prompt matters here, because lag analysis is arithmetic with a right answer and you want it computed identically every month rather than re-reasoned. The Excel export then gives your analyst the underlying series to check the model against.
For the holdout itself, the Conditional node lets the agent behave differently during a holdout window, so the report annotates itself rather than requiring someone to remember which weeks were the test.
FAQ
Related answers
- How much of our organic revenue is new demand versus branded demand capture?
- How do I test whether an organic lift was real and not seasonal or brand-driven?
- Is our non-brand visibility falling while branded traffic hides the loss?
- How do I know whether content is creating demand or just capturing demand that already existed?
Want AI visibility movement plotted against your branded search? Start a free Analyze AI trial and connect GSC alongside prompt tracking.