
How should I compare SEO customer-acquisition cost with paid acquisition?
Short answer
Amortise the SEO side and fully load the paid side, or the comparison is rigged before you start. Most teams count SEO's entire production cost against one quarter's leads while comparing it against paid CAC that only counts media spend. Divide SEO cost across the full 18 to 36 month producing life of the content, load paid with creative, landing pages, and agency fees, then compare over a 12 to 24 month window.
The two errors that rig the comparison
Error one: comparing over too short a window. A B2B article that ranks top three produces leads for 18 to 36 months. Charging its full cost against a single quarter's leads makes SEO look two to four times more expensive than it is.
Error two: loading only one side. Paid CAC almost always gets reported as media spend divided by customers, which ignores creative production, landing page development, attribution tooling, and the fully-loaded cost of the team running it. That understates paid CAC by 30 to 50%.
Fix both and the comparison becomes useful. Fix neither and you'll cut the compounding channel to fund the one that stops the day you stop paying.
Load both sides completely
SEO side, 12-month window: content production (writer, edit, design, screenshots), team time as salary allocation, tooling, links and digital PR, technical SEO developer time, and AI-search optimisation effort.
That last line is new and shouldn't be zero. Our own state of AI search research found Perplexity mentions tracked brands in 41.7% of matched B2B answers versus 32.3% on ChatGPT, with Google AI Mode citing in 97.4%. Those surfaces already send qualified visitors, so effort spent on them is a real acquisition cost that belongs in the calculation. Google's documentation on AI features is explicit that the same people-first content requirements govern AI surfaces, so this is existing SEO effort reallocated rather than a new discipline with its own overhead.
Paid side, same window: media spend, creative production, landing page development, attribution and tracking platforms, and the fully-loaded agency or in-house team.
The amortisation formula
SEO CAC = Total fully-loaded SEO cost (12 months)
        ÷ [Customers from organic (12 months)
           + expected customers from the same assets (next 12 months)]

Paid CAC = Total fully-loaded paid cost (12 months)
         ÷ Customers from paid (12 months)
Show your CFO both the current-period number and the amortised number. The current-period number is the one they'll instinctively compare to paid, and the amortised number is the one that reflects what actually happens.
What the ranges look like in B2B SaaS
After 18 months of steady investment in a competitive category:
| Channel | CAC range | Time to first customer | Compounding |
|---|---|---|---|
| Bottom-funnel commercial content | $150 to $800 | 2 to 5 months | Yes |
| Comparison and alternative content | $200 to $1,000 | 2 to 4 months | Yes |
| Top-funnel educational content | $600 to $3,000 | 4 to 9 months | Assisted only |
| Paid search (branded) | $50 to $250 | Same day | No |
| Paid search (competitor terms) | $400 to $2,500 | Same day | No |
| Paid social | $300 to $2,000 | Same day | No |
Bottom-funnel commercial content usually wins on CAC once you cross month six to nine. Branded paid always wins on speed. Top-funnel educational usually loses on direct CAC and has to be justified on assisted revenue instead, which is a different argument requiring different evidence.
Run it in five steps
1. Pull 12 months of fully-loaded costs on both sides. Including salary allocations. Half-loaded numbers are worse than none.
2. Pull 12 months of customers on both sides. Use first-touch for fairness. If a customer had both organic and paid touches, credit whichever captured them first.
3. Compute current-period and amortised CAC for each channel.
4. Add the AI-search line. Hours spent on prompt monitoring and citation optimisation, divided by attributed plus assisted revenue from AI-referred traffic. See How do I track ChatGPT traffic in GA4?.
5. Compare payback periods too. CAC without a payback horizon misleads. See What is a realistic payback period for an SEO investment?.
The join that makes this possible
The hard part is a clean customer count per channel, because AI-referred customers usually sit inside Direct where nobody counts them, which understates the organic side of your comparison.
Recent AI Visitors shows session-level detail with source, landing page, and engagement status, so you can verify the AI-referred count rather than inferring it. Page Breakdown then splits a page's performance across sources, which matters when you're computing cost per customer per channel and one channel is sending better-qualified traffic to the same URL.
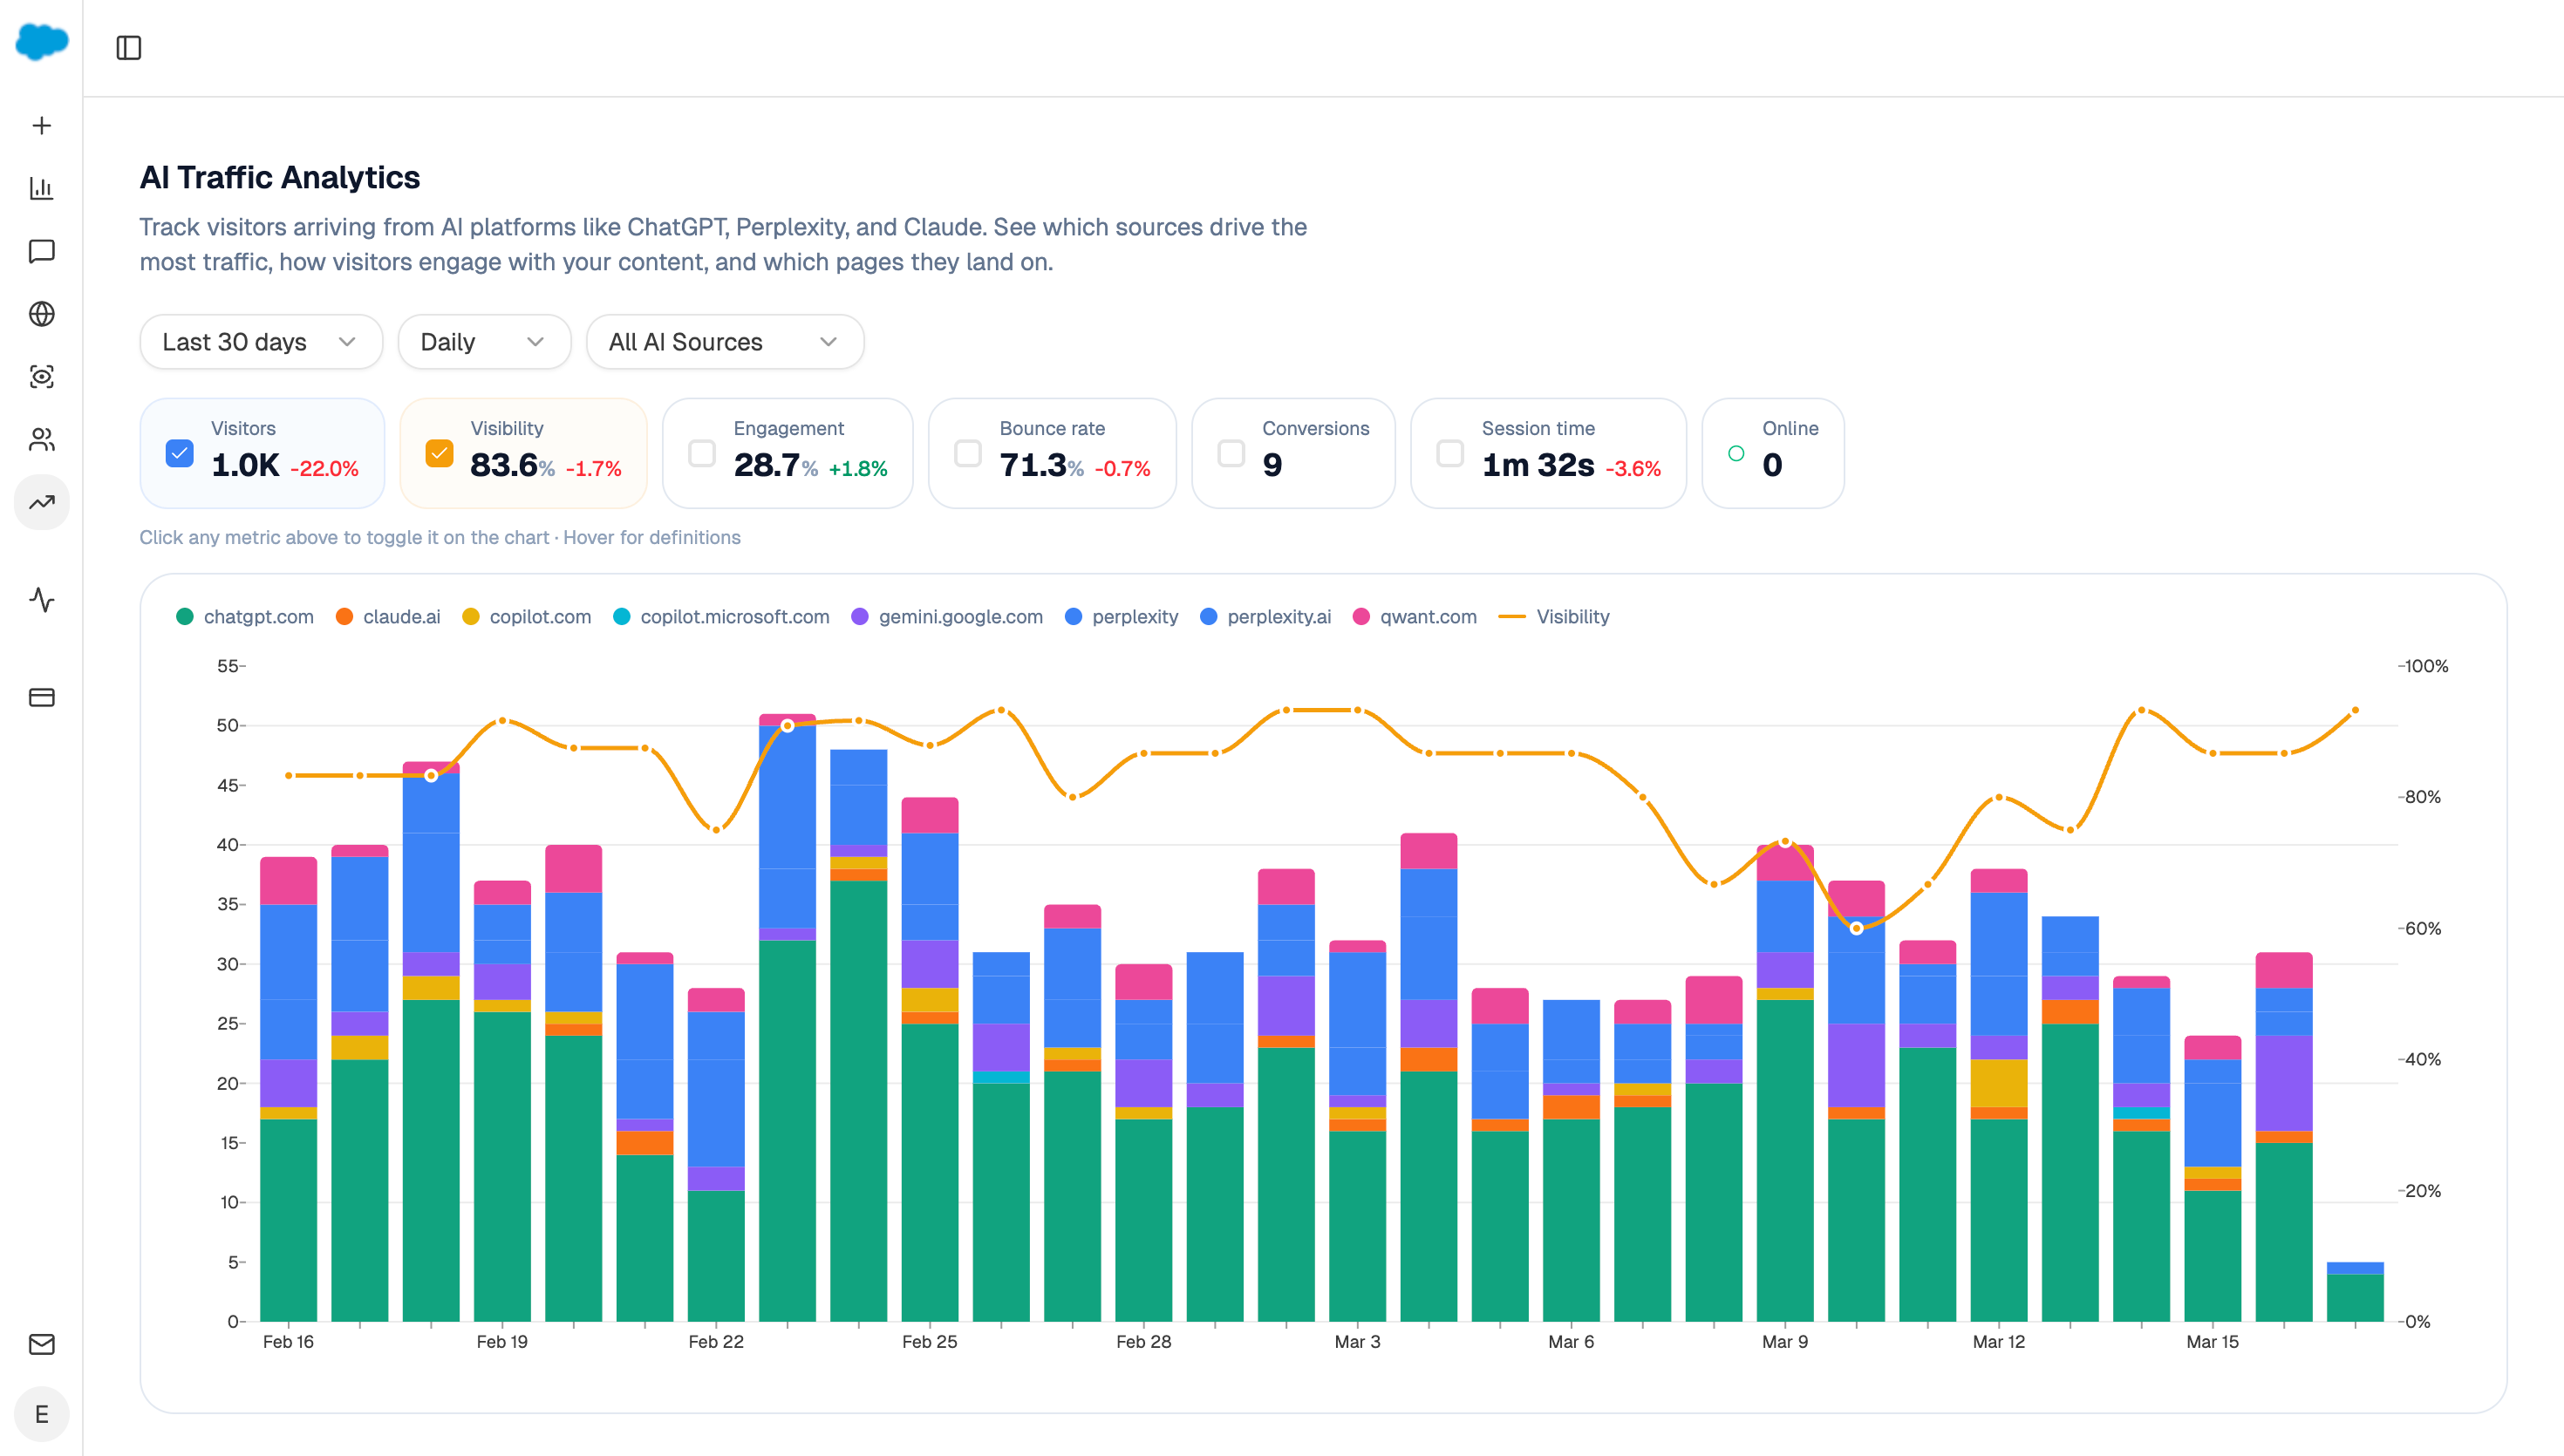
The monthly agent:
Start (schedule, 1st of month) → GA4 AI Traffic Overview → Recent AI Visitors → Page Breakdown (top 20 pages) → GSC Top Pages for Site → HubSpot Get CRM Objects (deals and channel cost data) → top-performers recipe → Code (compute current-period and amortised CAC per channel, applying the full asset life to the organic side and holding paid to the period) → Excel export → Send Email to CFO and CMO.
Holding the amortisation logic in a Code node is the detail that makes this survive scrutiny. The single most contested input in any SEO-versus-paid comparison is the asset life you assumed, and having it written as code rather than described in prose means finance can check it rather than argue about it.
FAQ
Related answers
- What is a realistic payback period for an SEO investment?
- How do I defend my SEO and content budget to a CFO who wants a revenue forecast?
- How can I compare the expected value of SEO, paid search, partnerships, communities, and referrals?
- How do I decide whether SEO is too slow for our current cash runway?
Want to attribute organic and AI-search customers cleanly instead of guessing at CAC? Start a free Analyze AI trial and get the comparison your CFO accepts.