
Which pages and queries influenced a deal even when they weren't the first or last touch?
Short answer
Pull the full page-view history for every contact associated with the deal, not just the person who filled in the form. Then run the comparison that matters: which pages appear disproportionately in won deals versus lost ones. A page viewed in 70% of wins and 20% of losses is doing real persuasion work, and it will show as zero in any first-and-last-touch report.
Start with the account, not the lead
The mistake that makes this analysis useless is scoping it to the person who converted. B2B deals involve three to eight people, and the ones who never fill in a form are often the ones reading your technical documentation.
So the pull is: every contact associated with the account, every page each of them viewed, every timestamp, for the full window from first touch to close.
You need three joins working. Contact-to-page from your marketing automation or CRM tracking. Contact-to-account, so a colleague's reading counts toward the deal. Account-to-opportunity, so it reaches revenue.
Most stacks have all three sitting idle rather than missing. See How do I see which content an account consumed before a sales conversation? for the account-level view.
The won-versus-lost comparison
Raw view counts will just rank your highest-traffic pages, which tells you nothing. The signal is differential.
For each page, compute the share of won deals where at least one committee member viewed it, and the share of lost deals where the same is true. Then look at the gap.
| Pattern | Read |
|---|---|
| High in wins, low in losses | Genuine persuasion. Protect and expand this content. |
| High in both | Ambient traffic. Everyone sees it, it doesn't discriminate. |
| Low in wins, high in losses | Often a symptom. Frequently pricing or comparison pages viewed by poor-fit prospects. |
| Low in both | Not part of the buying journey at all. |
Two cautions. This is correlational, and reverse causality is real: people who were already going to buy read more. And you need enough closed-lost data to compare against, which means CRM hygiene on loss reasons matters as much as the page data.
Treat the output as a shortlist for judgement, not a ranking to act on blindly.
Adding the query dimension
Pages tell you what they read. Queries tell you what they were trying to work out.
For each influential page, pull the queries driving clicks to it from Search Console. You can't tie a specific query to a specific contact, since Search Console has no user identifier, but you can characterise the intent bringing people to pages that appear in wins.
What usually surfaces: the highest-influence pages cluster around integration questions, security and compliance, migration effort, and specific competitor comparisons. That's the shortlist of things buying committees actually argue about internally, and it's a content brief you didn't have to guess at.
The influence that leaves no page view
A committee member who asked an assistant about your category, read a summary citing you, and never clicked leaves nothing in this analysis.
Our own state of AI search research, covering more than 22,000 answers, found Google AI Mode returns a citation-rich answer in 97.4% of matched B2B queries and Perplexity in 93.2%, while Pew Research found that when an AI summary appears, users click a source link in only about 1% of visits.
The practical move is to check whether your high-influence pages are also the pages AI surfaces cite. Where they overlap, the page is doing double duty, and its real influence is larger than the view data shows.
How Analyze AI runs the analysis
Three capabilities do the work here, and the third is the one that turns analysis into action.
HubSpot's read surface covers contact search, deal search, association, and page-view history across 26 operations, so the account-level pull runs in one workflow rather than three exports you reconcile by hand.
GSC Page-Keyword Breakdown returns every query driving clicks to a specific page, which supplies the query dimension for each influential page without a separate Search Console export.
The AEO Content Scorecard is where it becomes useful. Once you know which twelve pages appear in most won deals, the scorecard audits each one for AI-search readiness, scoring structure, freshness, claim density, proof integration, and claim-to-source mapping. High-influence pages with weak scorecards are your highest-priority work, because they're persuading buyers who reach them and failing to be surfaced to the ones who don't.
A workable chain:
Start (schedule, monthly) → HubSpot Get CRM Objects (won and lost deals, last 4 quarters) → HubSpot Search Contacts (all associated contacts per deal) → Code (compute per-page win-share and loss-share, rank by differential) → Loop / For Each over the top 20 differential pages → GSC Page-Keyword Breakdown per page → AEO Content Scorecard per page → citation-magnets recipe → Prompt LLM (rank pages by influence, flag those with weak AEO scores or no AI citations as priority) → Excel export → Send Email to content and sales leads.
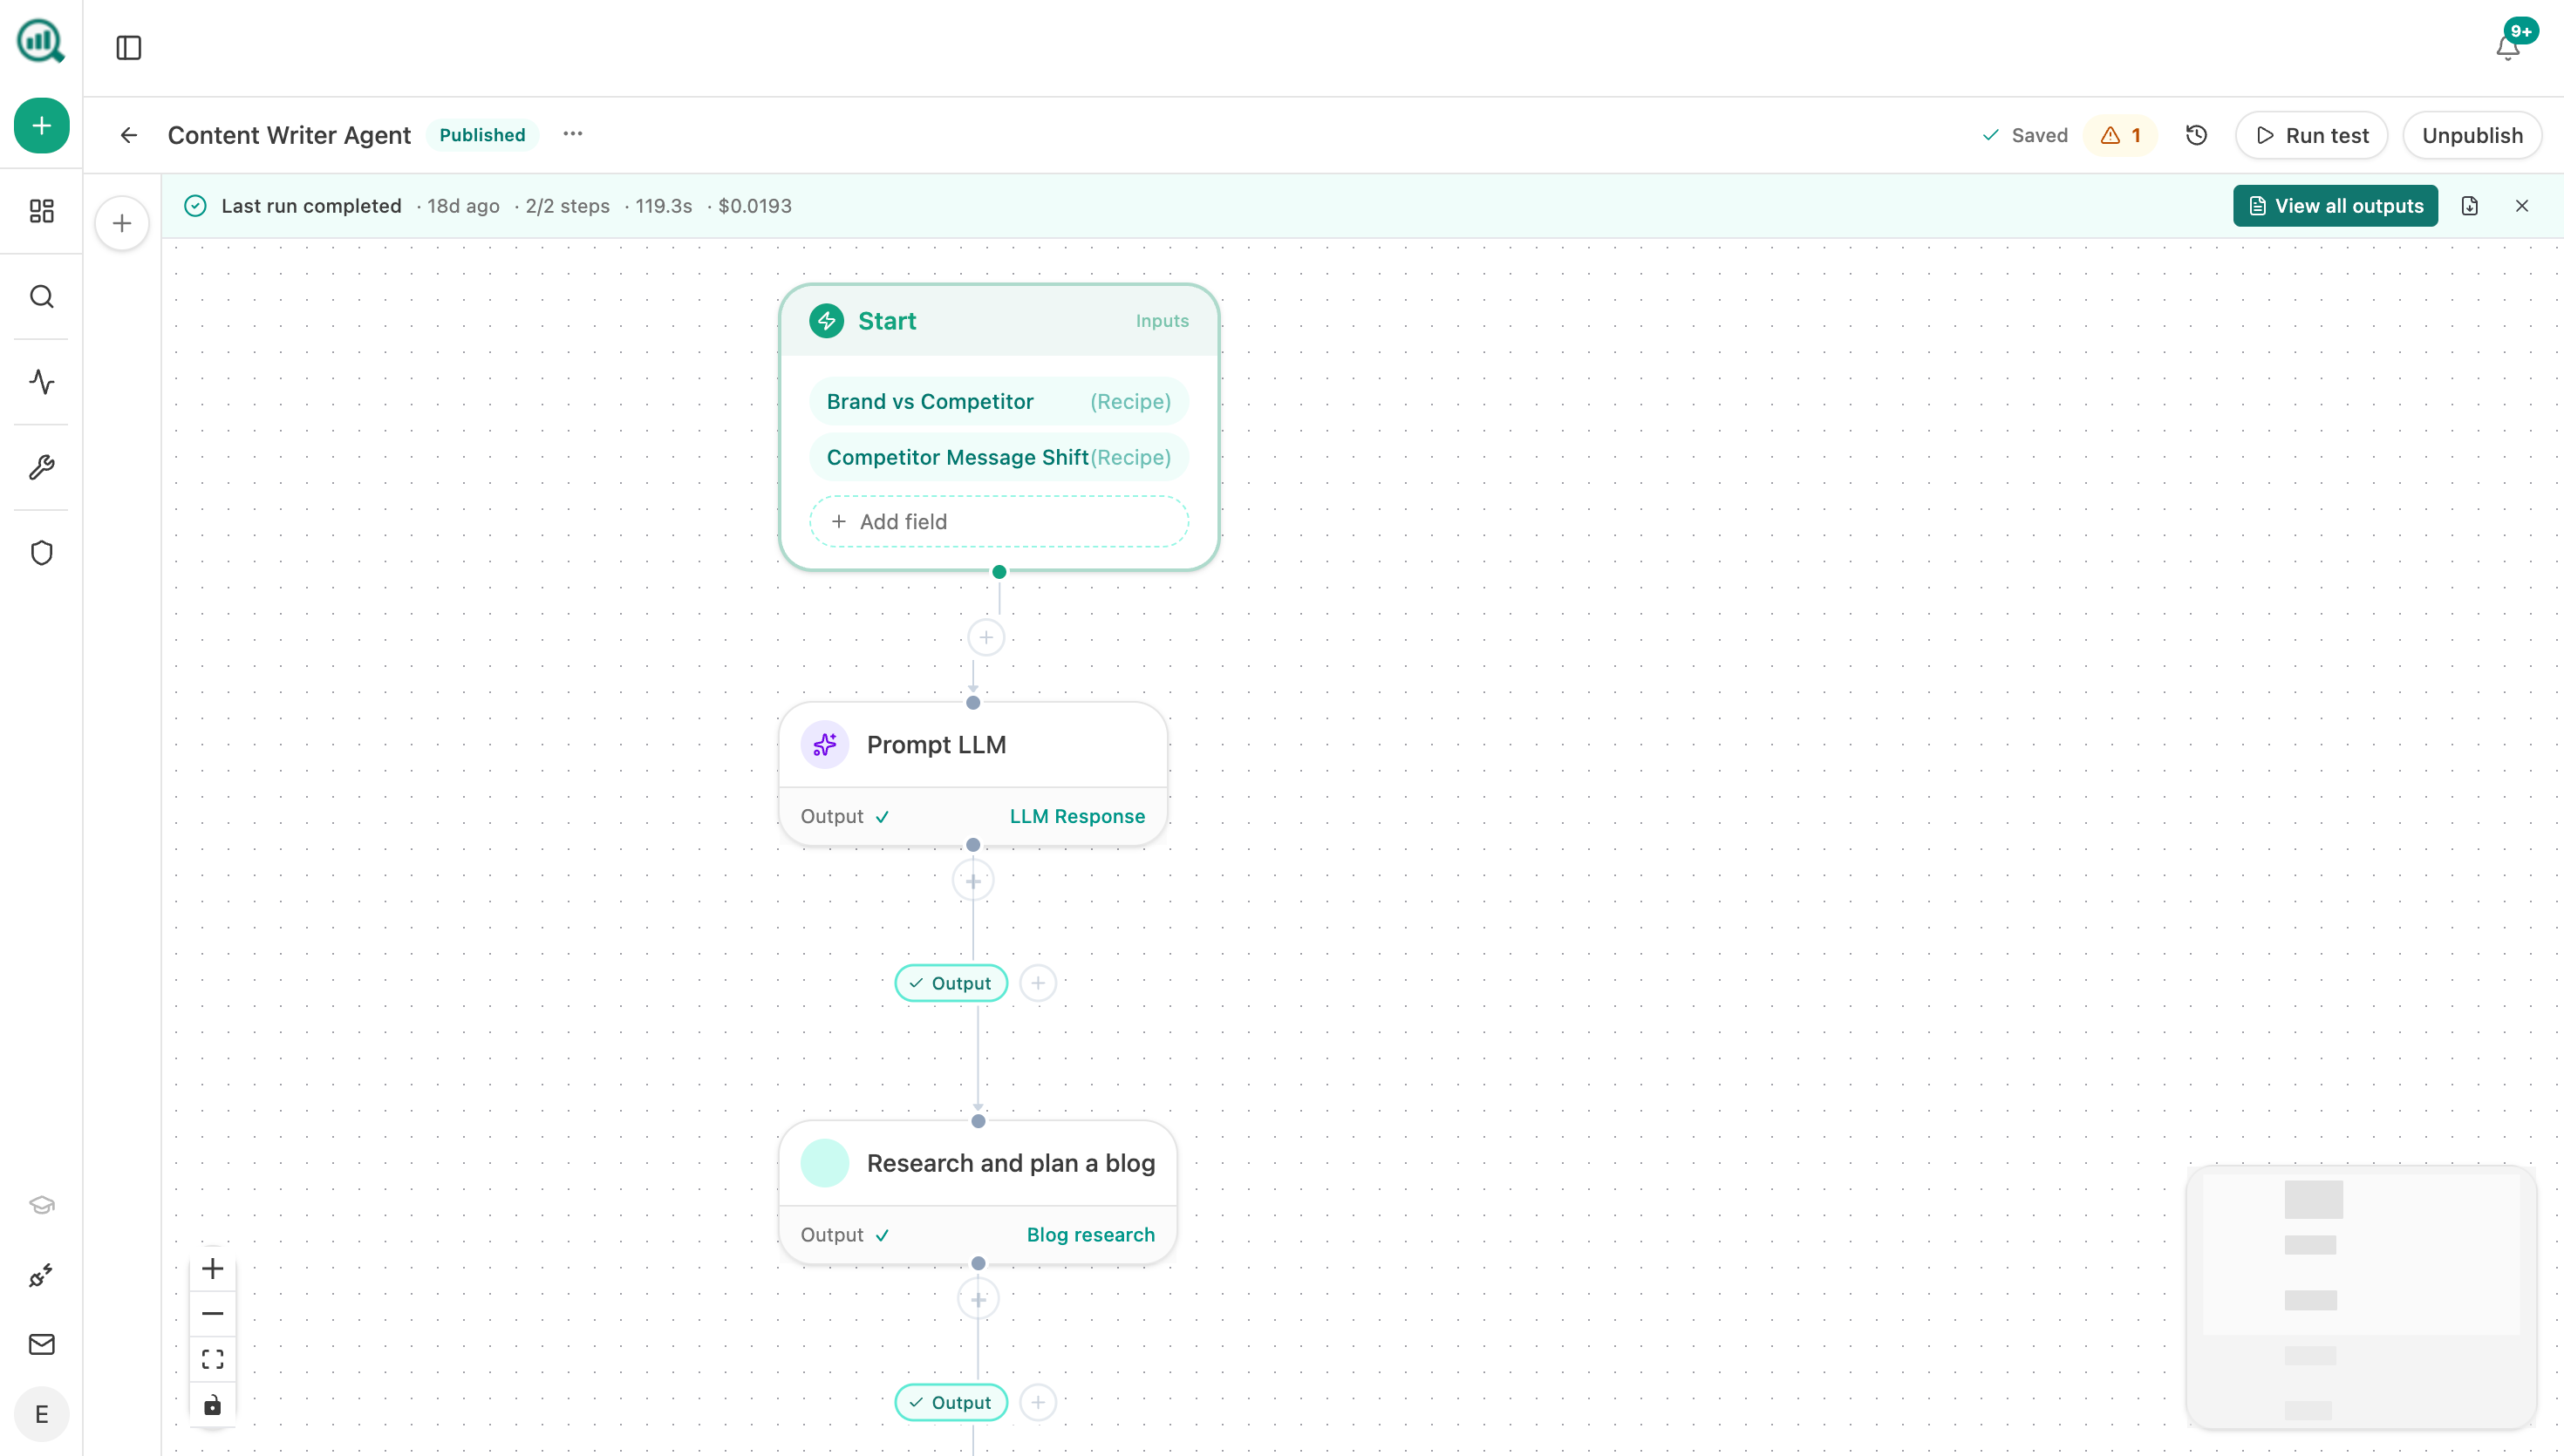
Putting the differential calculation in a Code node keeps the arithmetic identical run to run, and the Loop is what makes the scorecard step page-level rather than a single site summary.
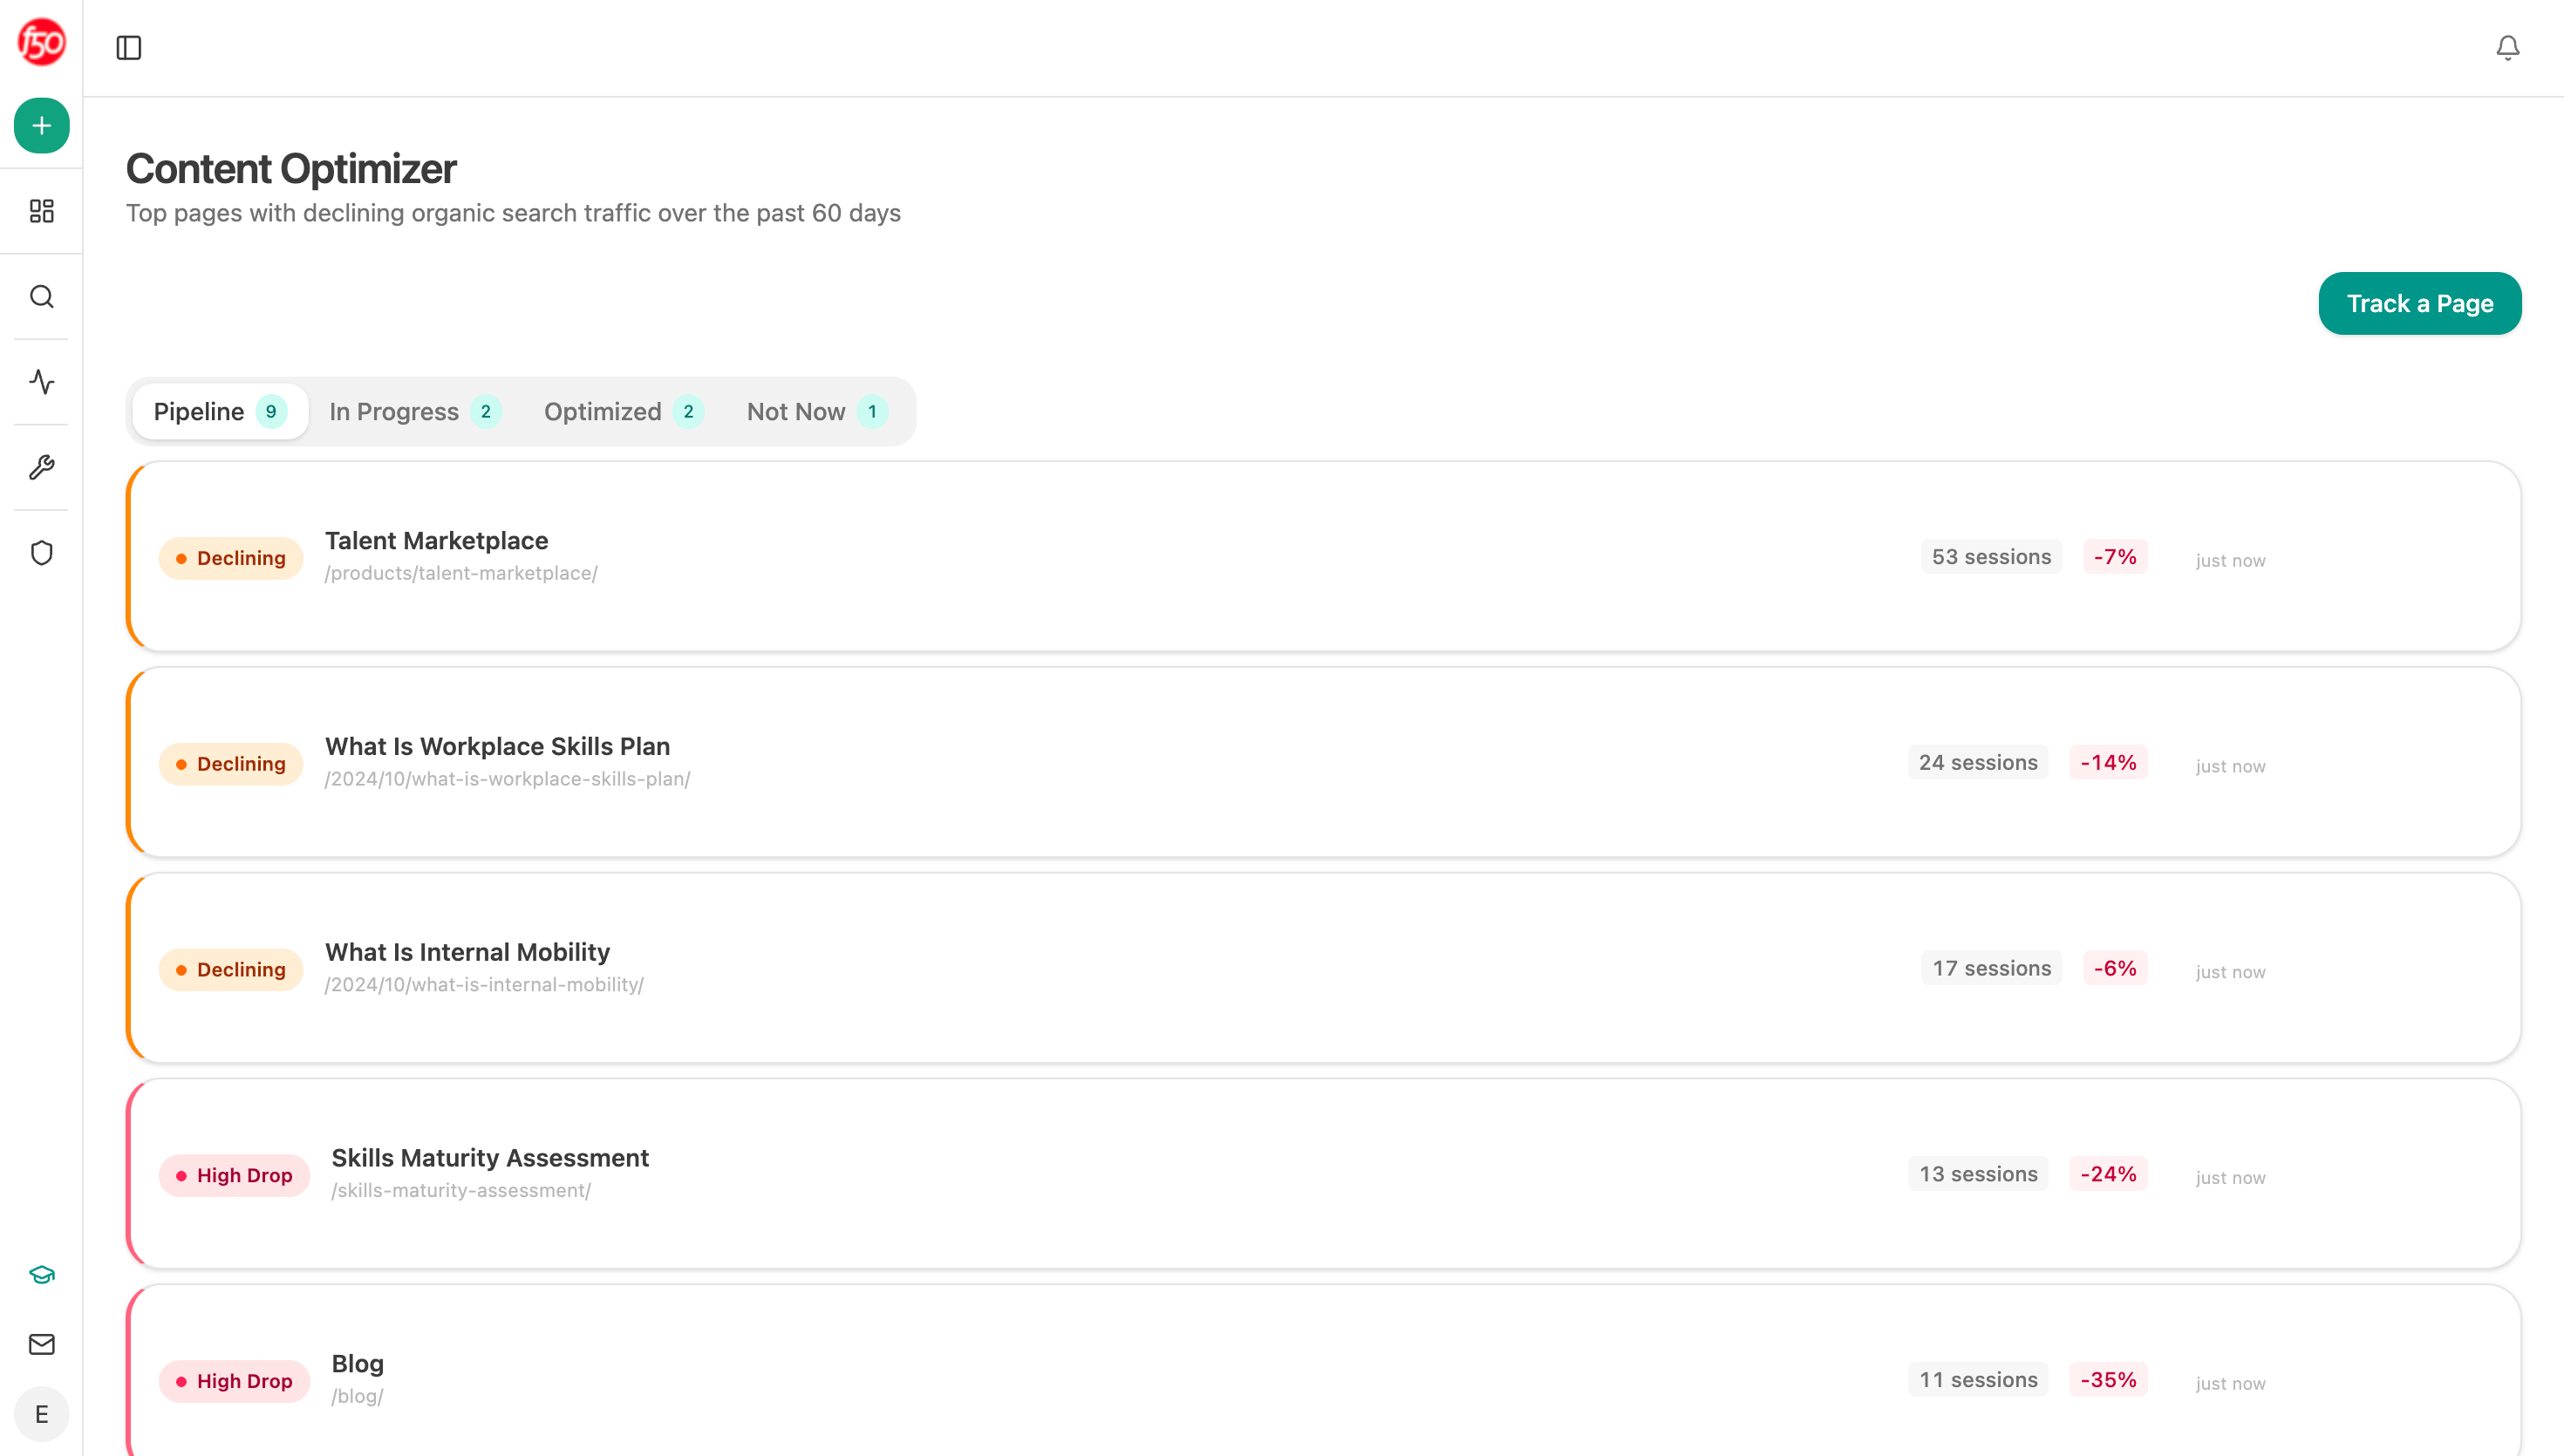
If a page comes back with a weak score, the Content Optimizer picks it up from there through an audit, brief, rewrite, and QA sequence, so the finding becomes a queued piece of work rather than a line in a spreadsheet.
FAQ
Related answers
- How do I see which content an account consumed before a sales conversation?
- How should I value content that influences a deal but doesn't create the lead?
- How do I separate first-touch, assisted, and last-touch organic revenue?
Want to know which pages win deals and whether AI surfaces cite them? Start a free Analyze AI trial and connect your CRM, GSC, and prompt tracking.