
How do I measure organic-influenced pipeline without claiming false precision?
Short answer
Report a range with the assumptions printed next to it, use a weight you set once and never adjust, and separate what you counted from what you estimated. False precision is the specific failure mode here: a number like "$847,320 of organic-influenced pipeline" invites an audit it can't survive, while "$700K to $950K, using a 40% influence weight across deals with a recorded organic touch" holds up because it shows its work.
The three ways this number gets discredited
A weight that moves. If your influence weight was 35% last quarter and 45% this quarter because the number looked weak, finance will find out and discount everything you produce afterwards. Set it once, document the reasoning, freeze it.
Credit that multiplies. A $50,000 deal touched by six pages, each credited at 40%, produces $120,000 of influenced pipeline from a $50,000 deal. Divide the weighted value across touching pages rather than applying the weight to each one independently. This is the most common arithmetic error in influenced-pipeline reporting.
A point estimate on inferred data. Sourced pipeline is counted, influenced pipeline is derived. Presenting both to the same decimal place implies an equivalence that doesn't exist.
Set the weight from your own data
Don't pick 40% because it sounds reasonable. Derive it from average marketing touches per closed-won deal.
| Average touches per deal | Influenced weight |
|---|---|
| Under 8 | 45 to 50% |
| 8 to 20 | 35 to 45% |
| Over 20 | 30 to 35% |
The logic: fewer touches means each page carried more of the persuasion, so it earns more credit. Many touches means influence was distributed thinly.
Pull the touch count from your CRM, compute the median rather than the mean so one 90-touch enterprise deal doesn't set your weight, and write the number into a documented definition your team can point at.
Build the range, not the number
Three inputs each carry uncertainty, so vary them to produce a defensible band.
Vary the weight by ±5 percentage points. A 40% weight becomes a 35 to 45% band.
Vary the attribution window. Compute at 90 days and at 180 days. Long B2B cycles produce materially different numbers, and showing both pre-empts the question.
Vary the touch definition. Strict counts only page views by named contacts on the deal. Loose includes anyone at the account. Report both bounds.
The low end of your range is strict-and-short, the high end is loose-and-long. That band is your answer, and its width tells leadership how much certainty the data supports.
Separate counted from estimated
Every report should have a visible line between the two.
| Line | Basis | How to present |
|---|---|---|
| Sourced pipeline | Counted from first-touch field | Exact figure |
| Influenced pipeline | Derived from weighted touches | Range with weight stated |
| AI-influenced pipeline | Inferred from survey and lag correlation | Range, labelled estimate |
Never sum across the three into a single "marketing contribution" figure. The moment you do, the estimated portion inherits the credibility of the counted portion, and one challenge to the estimate takes down the whole number.
The part you genuinely cannot count
A meaningful share of influence now happens where no touch is recorded at all. Our own state of AI search research, covering more than 22,000 answers, found Google AI Mode returns a citation-rich answer in 97.4% of matched B2B queries and Perplexity in 93.2%, while Pew Research found that when an AI summary appears, users click a source link in only about 1% of visits.
The honest handling is a fourth line, sized from your signup survey and clearly labelled as inferred, rather than either ignoring it or folding it into the influenced number. See How can I build credible evidence that AI search is sending customers when there is no referrer?.
The framing that survives a CFO
Lead with the constraint rather than defending it later. Something close to: influenced pipeline is an estimate built on a 40% weight derived from our median touch count, computed at both 90 and 180-day windows, producing a range of X to Y. Sourced pipeline, which is counted rather than derived, is Z.
A CFO who hears the method first will engage with the number. A CFO who hears a precise figure and discovers the method afterwards will discount it permanently.
How Analyze AI keeps the method stable
The threat to this analysis isn't the arithmetic. It's drift, where the weight, the window, and the touch definition quietly change between quarters because a different person rebuilt the spreadsheet.
Two Analyze AI capabilities address that directly.
The Code node runs custom JavaScript in an isolated context with declared input and output variables. Putting the weighting arithmetic there rather than in prompt instructions makes the calculation explicit and reviewable, so the definition lives in one place instead of being re-described each month.
Agent self-inspection recipes make the workflow stateful. workflow-memory returns outputs from prior successful runs of the same agent, and last-run-output returns the most recent artifacts. That means this month's run can compare against last month's using the identical method, and flag when a figure moved because performance changed rather than because an assumption did.
A workable chain:
Start (schedule, 1st of month) → HubSpot Get CRM Objects (deals last 4 quarters) → HubSpot Search Contacts (page-view history per associated contact) → Code (apply frozen weight, divide credit across touching pages, compute 90-day and 180-day bounds) → workflow-memory (last 3 runs) → Prompt LLM (build the range, compare against prior runs, flag whether movement came from performance or from data coverage) → DOCX export → Send Email to CFO and CMO.
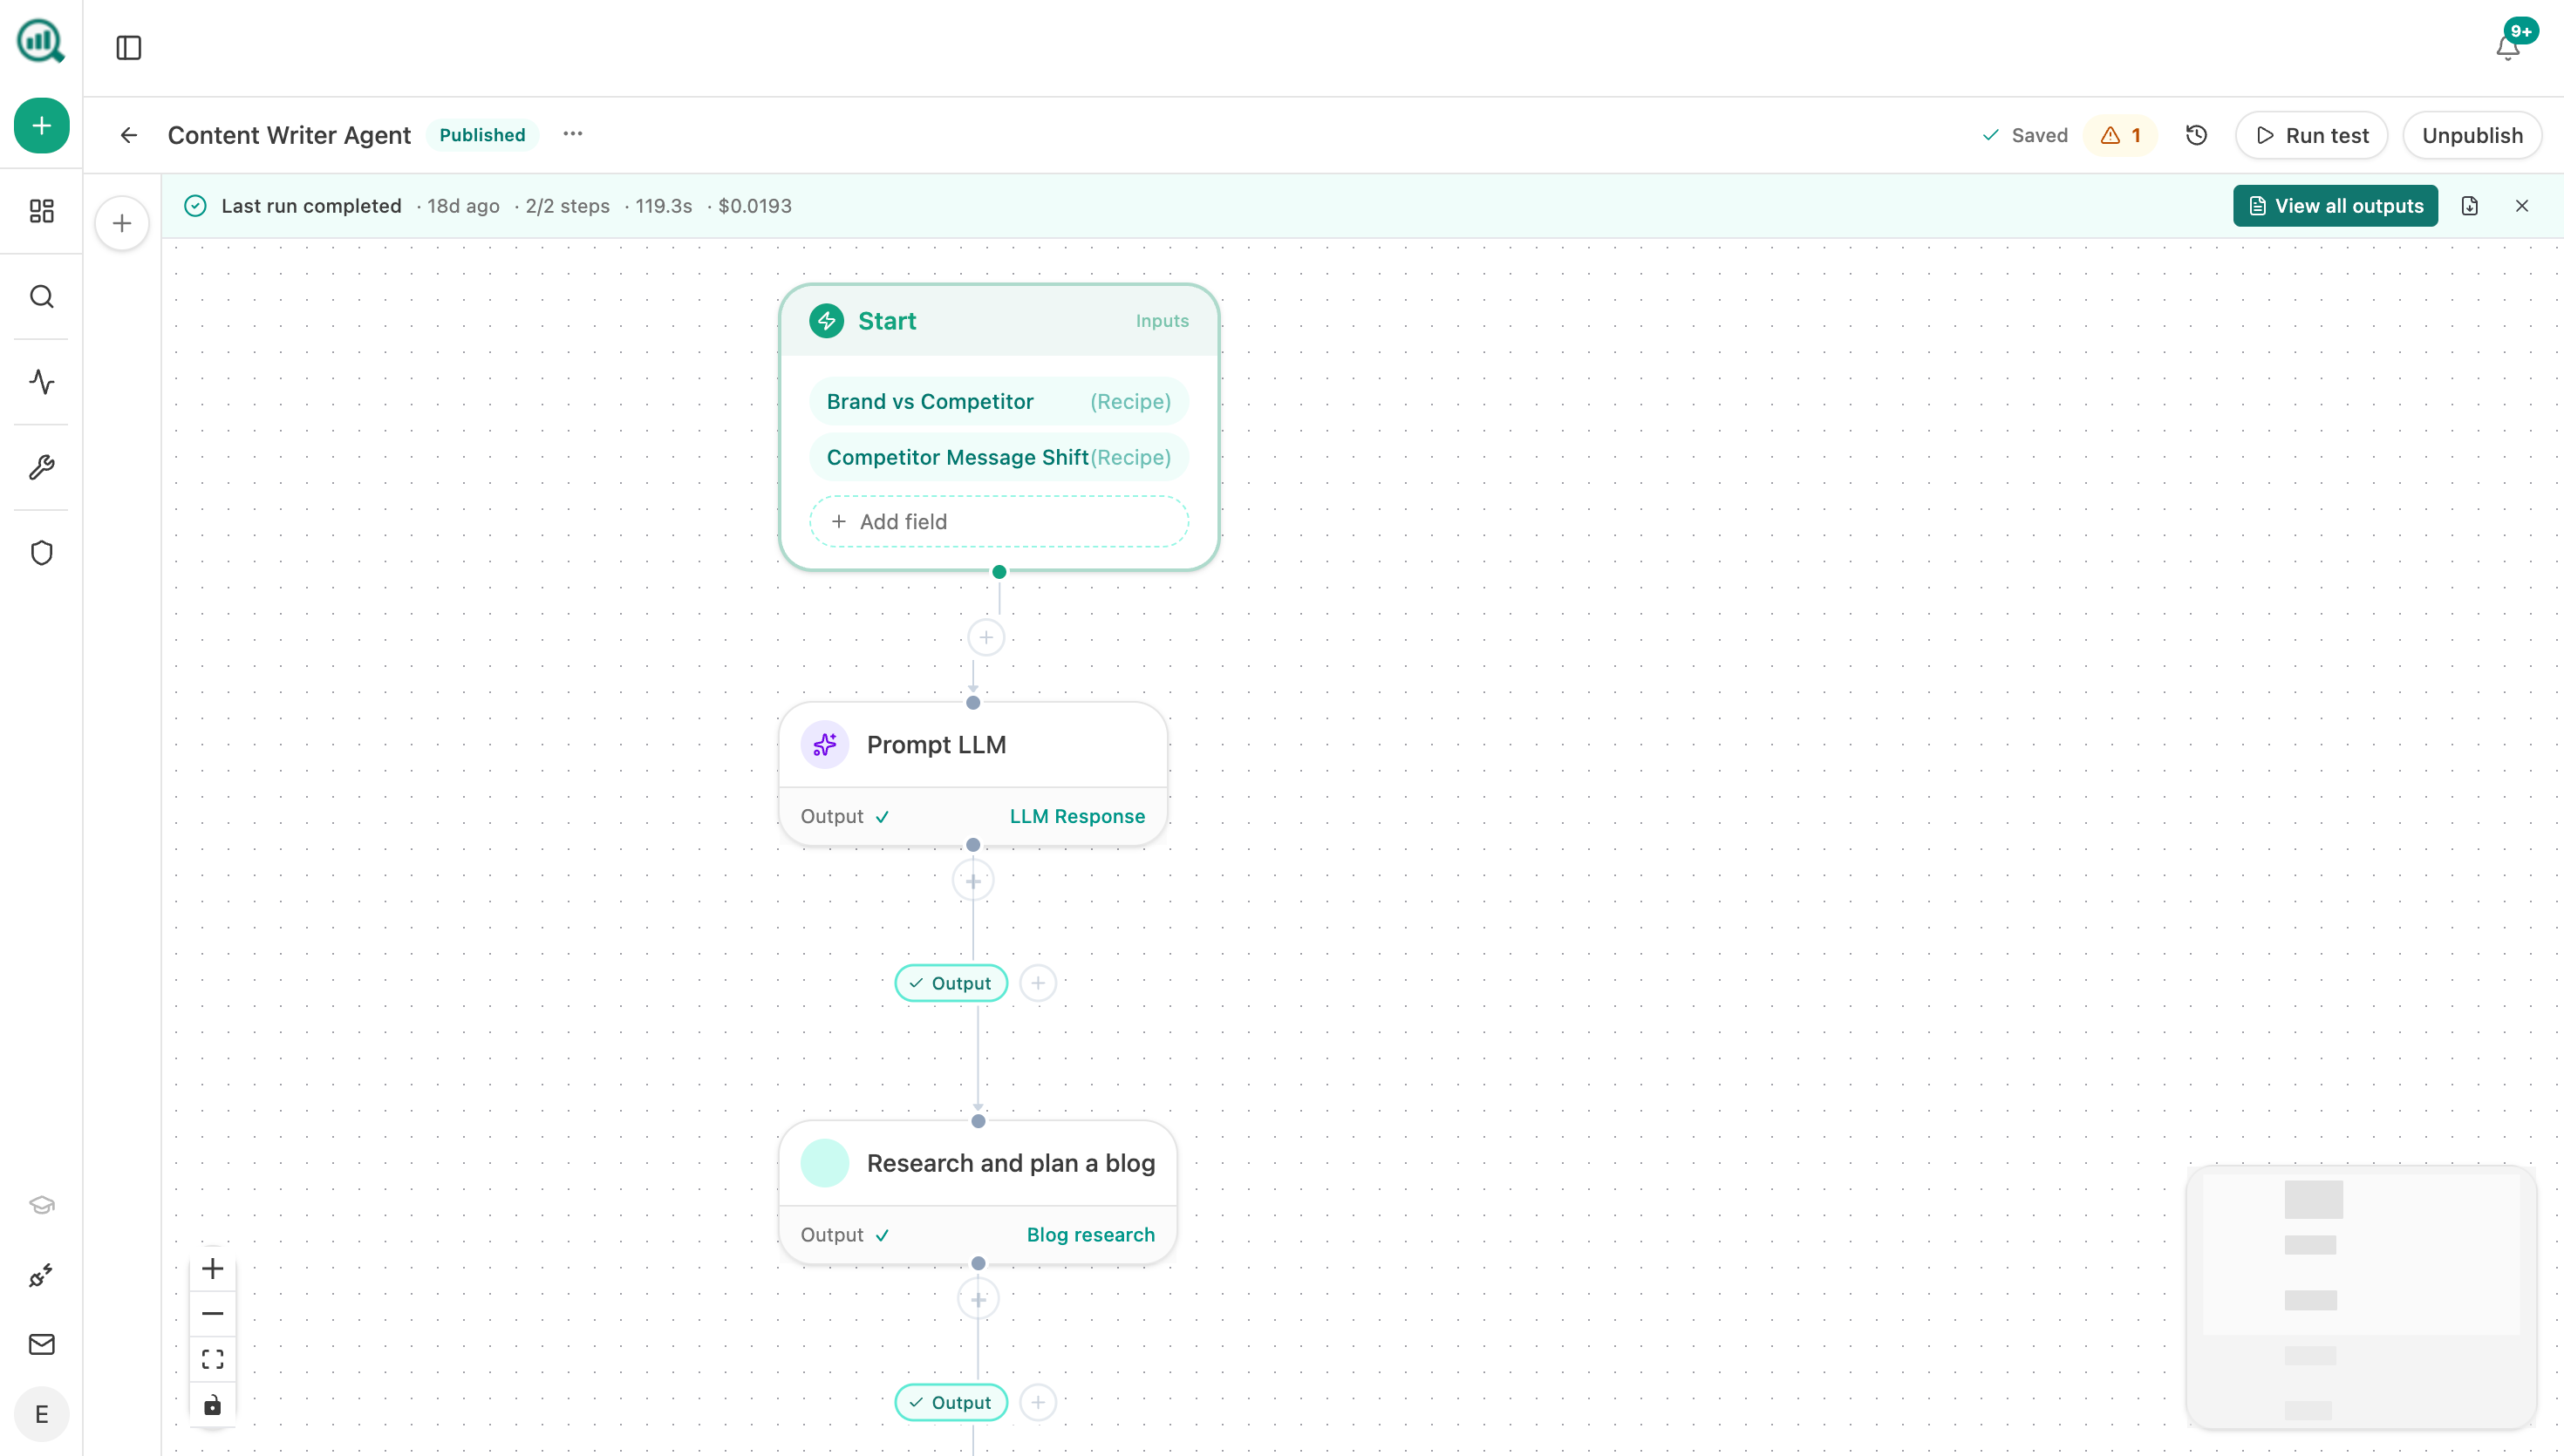
The workflow-memory step is the one that matters most for a number like this. Being able to say "this range moved because deal volume rose, not because we changed the weight" is exactly the reassurance that keeps an estimated figure in the board pack.
FAQ
Related answers
- How should I value content that influences a deal but doesn't create the lead?
- What do I report when the CEO wants one attribution number but the evidence is probabilistic?
- Which attribution model should I use for a long B2B buying journey?
Want a pipeline report that uses the same method every month? Start a free Analyze AI trial and build it once as an agent.