

![Featured image for B2B AI Mention Rates Range 9% to 70% by Category [2026]](/_next/image?url=https%3A%2F%2Fwww.datocms-assets.com%2F164164%2F1785857809-11-industry-variance.png&w=3840&q=75)

Summarize this blog post with:


We analyzed 22,295 AI answers across ChatGPT, Perplexity, and Google AI Mode to test whether a single “B2B” benchmark for AI visibility holds up when the data is split by category. The finding is that the “B2B” bucket hides a much wider range of behavior than industry-average numbers suggest. Mention rates run from about 9% in some categories to about 70% in others, and the source mix that feeds those categories varies just as much.
The dataset covers 115,843 citation events, 460 distinct B2B prompts, and 37 tracked organizations. Every industry number we report here comes from the specific set of tracked organizations we monitor in that category. Some categories in the panel are covered by three or four tracked organizations, and we can make broader claims about those. Others are covered by a single tracked organization, so the “industry mention rate” for those categories is closer to a single-brand mention rate than a real market benchmark. We flag both cohort sizes throughout, because the difference matters for how a marketer should read the numbers.
Here are the questions we set out to answer:
- How much does AI mention rate vary across B2B categories?
- How much does the source mix that feeds AI answers vary across categories?
- Does the per-engine spread vary by category?
- How representative are cross-B2B benchmark numbers of what any specific category looks like?
- What should a marketer use as their reference number if not the cross-B2B average?
Mention rates range from about 9% to about 70% across the categories in our panel. YouTube incidence ranges from 0% in some categories to 22% in others. Reddit incidence ranges from 0.1% to 13.3%. The engine-spread (difference between the highest and lowest engine on a category’s mention rate) ranges from 5.8 percentage points to 53 percentage points. Every one of these ranges is wider than any cross-B2B average can hold. A benchmark number pulled from a cross-B2B panel and applied to a specific category is likely to be off by a factor of two or more in most directions. Category-specific benchmarks are the only ones a marketer can actually use.
Table of Contents
TL;DR
- What is the mention-rate range across the 11 B2B categories in our panel? Roughly 9% to 70%. CRM, sales and revenue operations sits at the top (69.8%). Events and ticketing sits at the bottom (8.7%). Beauty and hair products, our broadest-cohort category, sits at 11.9%.
- What is the sample per category? Ranges from 7 prompts and 1 organization at the smallest to 75 prompts and 4 organizations at the largest. Only two categories (Beauty and hair products, Financial services and investing) have broad-cohort samples. The rest carry directional-only confidence flags because the cohort concentrates in one or two tracked organizations.
- How does source mix vary? Enormously. CRM answers pull 43% from lists and comparisons. Beauty answers pull 46% from brand websites and 31% from editorial content. AI search and marketing software answers pull 36% from lists and 37% from websites. There is no universal source-mix benchmark either.
- How does per-engine spread vary? Developer and productivity software swings 20 percentage points across engines. Financial services and investing swings less than 6 points. Some categories have highly engine-dependent visibility. Others are stable across the three surfaces.
- What should a marketer use as a reference number? The mention rate from their own tracked prompt panel, benchmarked over time. Any cross-B2B number pulled from an industry study is probably not the right reference for a specific category.
Mention Rates Run from About 9% to About 70% Across the B2B Categories in Our Panel
The category-level numbers, ordered by mention rate, look like this.
| Category | Mention rate | Avg. citations | Prompts | Organizations |
|---|---|---|---|---|
| CRM, sales & revenue operations | 69.8% | 5.09 | 10 | 3 |
| Education & training | 63.7% | 4.24 | 15 | 1 |
| Travel & hospitality | 58.3% | 4.08 | 15 | 1 |
| Financial services & investing | 57.8% | 4.75 | 35 | 3 |
| Developer & productivity software | 55.6% | 3.93 | 15 | 1 |
| Workplace & facilities technology | 52.0% | 3.81 | 7 | 1 |
| Retail & consumer products | 46.7% | 4.46 | 15 | 1 |
| HR, talent & workforce | 45.7% | 5.62 | 12 | 2 |
| AI search & marketing software | 17.2% | 4.83 | 19 | 2 |
| Beauty & hair products | 11.9% | 4.29 | 75 | 4 |
| Events & ticketing | 8.7% | 4.61 | 10 | 1 |
Two things about this table deserve attention before anyone treats a specific number as a benchmark.
The first is that the sample column tells the reader how much weight to put on each row. The 69.8% mention rate for CRM comes from 3 tracked organizations across 10 prompts. The 63.7% for Education and training comes from 1 organization across 15 prompts. The 11.9% for Beauty and hair products comes from 4 organizations across 75 prompts. The Beauty number is the most reliable category-level estimate in the table because it draws on the broadest cohort. The single-org categories should be read as “our specific tracked organization’s mention rate for their tracked prompts” rather than as an industry-wide claim.
The second is that the pattern is not random. Categories where the tracked brand is a top-3 market player (CRM, Financial services) tend to sit higher. Categories with a very large competitive alternative set (Beauty, AI search software) tend to sit lower, because any single brand is competing against dozens of alternatives for a slot in the answer. The 70% mention rate for CRM does not mean “CRM is easier to get visibility in.” It means “when you are Salesforce or HubSpot, your prompts skew toward answers that name you.” A challenger brand in the same category would produce a much lower number.
A concrete way to see this effect: Beauty and hair products, our broadest sample at 75 prompts across 4 organizations, produces a mention rate of 11.9%. AI engines are consistently returning long lists of beauty brands for those prompts, and the 4 tracked brands each appear in only about one in ten answers on average. If we tracked 40 beauty brands instead of 4, the average per-brand mention rate would still be roughly 12% because the competitive alternative set is large regardless of how many brands the panel tracks. Compare that to CRM, where the total set of vendors an AI engine would plausibly name for a “best CRM” prompt is small (Salesforce, HubSpot, Zoho, Zendesk Sell, Freshworks, a handful more), so tracked brands sitting inside that small set land in most answers.
The takeaway to hold onto is the range rather than the specific numbers. A cross-B2B mention-rate benchmark of 30% (which is close to our overall matched-sample average) sits between 15 and 45 percentage points off of most of the individual category numbers. Applying that benchmark to your specific category will misestimate your position substantially in most cases.
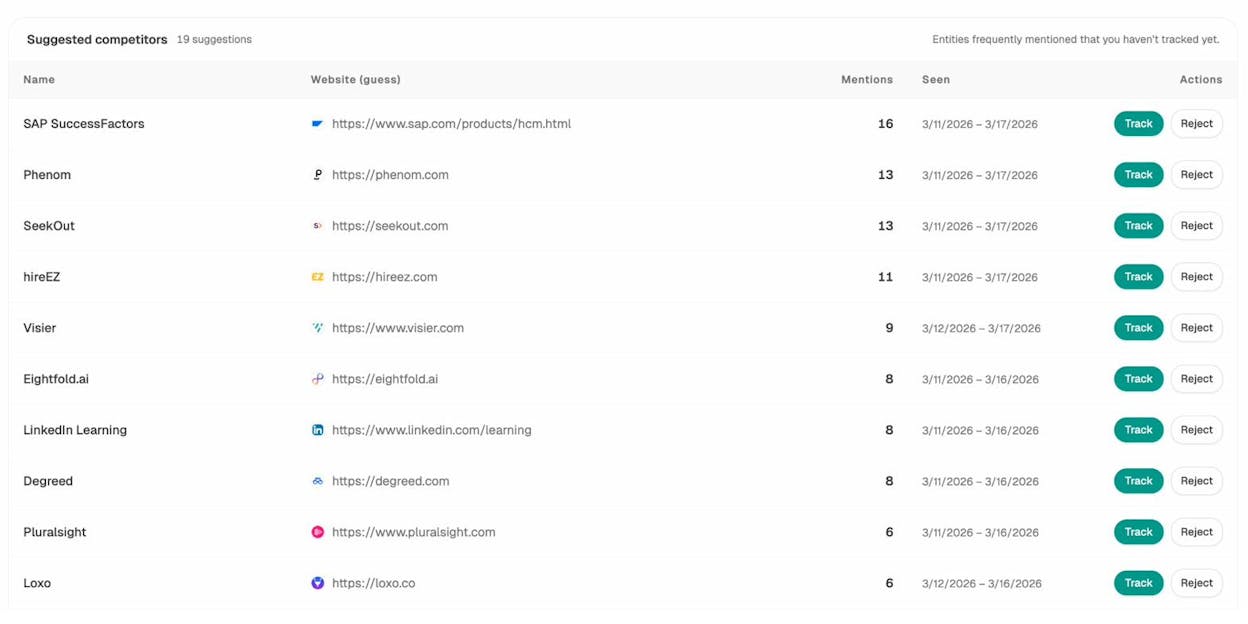
Competitors view showing category-level competitor mention rates side by side with the tracked brand
The Source Mix Varies as Much as the Mention Rate Does
Different categories pull from fundamentally different source pools when AI engines build answers. That is a second axis of category variance that matters for earned-media strategy.
| Category | Websites / product pages | Lists / comparisons / reviews | Editorial / educational | Community / social |
|---|---|---|---|---|
| CRM, sales & revenue operations | 39% | 43% | 15% | 3% |
| Beauty & hair products | 46% | 10% | 31% | 12% |
| AI search & marketing software | 37% | 36% | 24% | 3% |
| Education & training | 97% | 0.3% | 3% | 0.1% |
| Financial services & investing | 81% | 10% | 6% | 3% |
| Developer & productivity software | 28% | 36% | 19% | 17% |
The pattern lines up with the buyer research process for each category. CRM buyers rely heavily on comparison content (G2, TrustRadius, category rankings), which explains why 43% of CRM citations come from lists and comparisons. Beauty buyers rely more on brand editorial and product pages, which explains the 46% brand-website share. Developer software buyers rely heavily on community discussion (17% social share, roughly 6x the CRM community share), which reflects how developers actually decide on tools.
For an earned-media strategy, this means the target-domain portfolio needs to be built for the specific category. A CRM brand pouring budget into brand-website content while ignoring comparison-site placements is optimizing for the smaller half of the citation pool. A beauty brand pouring budget into comparison content is optimizing for the smallest 10% of its category’s citation pool. The generic advice to “get on the top-cited AI domains” is category-blind, and the categories look nothing alike when you split them.
The Education and training row is worth calling out separately. 97% of citations come from brand websites, which is unusually concentrated and reflects that the one tracked organization in this category is a large branded institution that dominates its own citation pool. That is the strongest single-org confound in the source-mix table. It is not a representative benchmark for education as a category.
Per-Engine Spread Varies as Much as Mention Rate Does
Some categories show large differences in mention rate across the three engines. Others are stable across all three. That variance matters because it tells you whether you can prioritize one engine over the others in a specific category.
| Category | ChatGPT | Google AI Mode | Perplexity | Range |
|---|---|---|---|---|
| Developer & productivity software | 53.3% | 46.7% | 66.7% | 20.0 pp |
| Retail & consumer products | 46.7% | 40.0% | 53.3% | 13.3 pp |
| HR, talent & workforce | 39.2% | 47.2% | 50.7% | 11.4 pp |
| Financial services & investing | 54.7% | 60.4% | 58.4% | 5.7 pp |
| Beauty & hair products | 9.5% | 10.7% | 15.3% | 5.8 pp |
For developer software, Perplexity produces a 20-percentage-point higher mention rate than Google AI Mode does on the same prompts. If your buyers live in this category, Perplexity is a meaningfully different priority than the other engines. For financial services and beauty, the engines are much closer, so a single-engine investment does not buy you as much on relative visibility.
The single-org caveat applies to this table too. Developer software is one tracked organization across 15 prompts. The 20-percentage-point spread on those 15 prompts is real, but generalizing to “developer software brands broadly see a 20-point spread” would overreach the sample.
How This Compares to Other Public Studies
Category-level AI visibility numbers are much less studied than cross-B2B averages, and the published data varies wildly by methodology. Here is where our finding fits.
Averi analyzed 680 million AI citations and Superlines found “citation volume variance of up to 615x for the same brand between platforms.” Their finding operates at the brand level rather than the category level, but the underlying phenomenon is the same. Aggregate benchmarks hide huge variance once you split the data. A 615x brand-level spread between platforms is compatible with our 20-percentage-point category-level spread between engines. Both point at the same conclusion. Averages describe a bucket. They do not benchmark a specific case.
Conductor’s 2026 AEO/GEO Benchmarks Report reported that 87.4% of all AI referral traffic across 10 key industries comes from ChatGPT, with Perplexity and Google AI Mode splitting the remainder. Their number describes traffic share rather than citation share, and it aggregates across 10 industries. Applied to any specific industry, this average is likely wrong. Our data shows that categories like developer software swing much more toward Perplexity for mention rate. A developer-software brand using the 87.4% ChatGPT traffic-share number to plan an engine-prioritization strategy would misallocate.
Semrush analyzed 5,000 keywords across 150,000 citations and found that “query intent affects response length: commercial queries triggered responses about 2x longer than informational ones.” That is a within-query-type variance finding. Our category-variance finding sits next to it as a separate dimension. Both are true simultaneously. Query intent shapes answer behavior. Category shapes it too. The two effects compound, and a marketer working in a specific category with a specific query mix has both effects operating on their measured numbers.
Ahrefs reported that AI Overviews now appear in over 25% of Google searches as a headline aggregate, without breaking down the industries where AIO shows up most or least. That framing again illustrates the problem. An aggregate 25% AIO appearance rate applied to a specific category is likely to be off by a factor of two in one direction or the other. E-commerce categories see much higher AIO incidence than B2B SaaS categories, but the aggregate does not tell you that.
The pattern across these studies is consistent. Aggregate numbers exist and are widely reported. They are consistent methodologies applied to broad samples. They should not be treated as benchmarks for any specific category. Our category-split gives that the specific data pattern for B2B, but the broader lesson applies across every AI-visibility measurement.
What This Means for How You Set Reference Numbers
Three things follow from the category-variance data.
The first is that the reference number for your AI-visibility program should come from your own tracked prompt panel rather than from a cross-B2B benchmark. A tracked panel of 30 to 60 prompts phrased the way your buyers actually ask, run against your engines of interest, gives you the specific mention rate, citation count, and source mix for your specific category. That is the number to benchmark against over time. Whatever you read in an industry report is not that number for you. The AI Visibility Tracking view generates the panel and tracks the numbers weekly, so the baseline is your own baseline rather than a category-agnostic one.
The second is that the source-mix insight is where the earned-media budget lands. Your category has a specific source-family distribution, and moving that number requires investing in the source families that AI actually pulls from for your category. A CRM brand’s earned-media budget should skew toward comparison sites and lists. A beauty brand’s budget should skew toward brand editorial and product-page optimization. A developer-software brand’s budget should include a real community-content investment. The Citation Analytics view shows the specific pages and domains AI cites for your tracked prompts, which is the practical target list for earned-media work in your specific category.
The third is that per-engine spread tells you whether to prioritize engines. If your category shows a 20-percentage-point spread like developer software does in our data, prioritizing Perplexity buys you meaningfully more relative visibility than prioritizing ChatGPT would. If your category shows a 6-point spread like financial services does, engine-prioritization is a smaller lever, and the same broad content investment works across engines. Measuring the spread on your own tracked panel is what tells you which of these situations you are in.
The Bigger Story
The industry has spent 2025 and 2026 publishing cross-B2B AI-visibility benchmarks. Our data says these benchmarks describe averages of averages rather than benchmarks for any specific category. Applied to a specific brand in a specific category, most cross-B2B numbers are off by a factor of two or more. That does not mean the industry reports are wrong. It means they are describing a bucket that no specific marketer actually operates in. The bucket you operate in is your own category with your own tracked prompts, and the reference numbers for that bucket have to be built from your own data.
This finding stacks with the other pieces in the State of AI Search series. Cross-engine consensus is rare, so per-engine benchmarking is the right unit. Website authority does not predict citations, so the DR-based rankings that occasionally get published as AI-visibility proxies do not translate. The top 10 domains cover only 12% of citations, so a top-10 list is category-agnostic and misses most of the citation pool. And engine-level behavior varies substantially by category, which layers another axis of variance on top of the per-engine and per-source-domain variance we already covered.
The rest of this State of AI Search series folds the remaining structural patterns into a longer pillar reference. Later work covers how prompt phrasing changes brand-mention probability, how the specific perception labels the AI attaches to your brand differ across engines, and how a marketer should design a tracked prompt panel that captures both prompted and unprompted visibility for their specific category.
The finding to hold onto from this piece is the simple one. B2B mention rates range from about 9% to about 70% across the categories in our panel, and the source mix varies just as widely. Cross-B2B benchmarks do not translate to specific categories. Build your reference numbers from your own tracked panel. Compare your progress against your own baseline. Skip the cross-category averages.
This research was conducted using Analyze AI, which tracks brand visibility, category-level source mix, and per-engine mention rates across ChatGPT, Perplexity, Google AI Mode, and every other major AI engine.

Ernest

Ibrahim
![Featured image for The State of AI Search in B2B [2026]](/_next/image?url=https%3A%2F%2Fwww.datocms-assets.com%2F164164%2F1785857899-16-state-of-ai-search-b2b-2026.png&w=3840&q=75)

![Featured image for Prompt Type Changes AI Mention Rate 17 Points [2026 Study]](/_next/image?url=https%3A%2F%2Fwww.datocms-assets.com%2F164164%2F1785857825-12-prompt-archetypes.png&w=3840&q=75)
![Featured image for Prompt Design Shifts AI Mention Rate 60 Points [2026]](/_next/image?url=https%3A%2F%2Fwww.datocms-assets.com%2F164164%2F1785857842-13-prompt-construction.png&w=3840&q=75)