

![Featured image for The State of AI Search in B2B [2026]](/_next/image?url=https%3A%2F%2Fwww.datocms-assets.com%2F164164%2F1785857899-16-state-of-ai-search-b2b-2026.png&w=3840&q=75)

Summarize this blog post with:


Over the last twelve months, we analyzed 22,295 AI answers to 460 tracked B2B prompts across ChatGPT, Perplexity, and Google AI Mode. We logged 115,843 citation events, tracked 37 organizations across 11 B2B categories, and observed the same prompts on the same day across all three engines so we could compare like with like. This is the reference document for what we found and what it means for how a marketing team should build an AI-visibility program in 2026.
The five findings that matter most for B2B marketers are these.
- The three engines are structurally different products. They cite different volumes of sources, produce answers of different lengths, name brands at different densities, and pull from different source-family mixes. Optimizing for AI visibility across all three engines with one content playbook produces suboptimal results on at least two of them.
- The citation ecosystem is broad and diffuse. The top 10 cited domains cover only about 12% of citations. Page authority does not predict how often a page gets cited. And the specific platforms most marketing teams treat as high-value AI-visibility sources (Reddit, YouTube, LinkedIn) produce far weaker mention transfer than the industry conversation implies.
- What actually moves brand mentions is a specific set of levers most marketers are not pulling. Commercial sources like brand websites and directory profiles travel with mentions. Community and editorial sources travel with lower mention rates. Sentiment on the cited page does not predict sentiment in the answer. And once you win a spot in an AI answer, you keep it about 83% of the time on the same-day observation.
- The panel you track determines the number you report. Category mention rates in our data range from 9% to 70%. Prompt archetype shifts mention rate by 8 to 17 percentage points depending on engine. Prompt structure (brand-in-prompt, angle count) shifts it by 60 percentage points. Reporting a single blended mention rate hides three axes of variance that operate simultaneously.
- A good AI-visibility program in 2026 splits its content investment into three separate portfolios (commercial, list-inclusion, and editorial-inclusion), designs its tracked prompt panel to match real buyer behavior in the specific category, and reports mention rate per-engine, per-archetype, and per-source-family so the aggregate number is meaningfully decomposed.
The rest of this report unpacks each of those five findings with the specific data, cross-references to established public studies, and links out to fifteen underlying research pieces where you can read the detailed methodology and per-finding treatment.
Table of Contents
Executive summary
- Cross-engine consensus is rare. On generic B2B prompts, all three engines miss your brand simultaneously 47.2% of the time. Only 14.6% of prompts produce a brand mention in all three engines. Full study
- Citation frequency varies substantially by engine. Google AI Mode cites a source in 97.4% of B2B answers. ChatGPT does so in 68.3%. The difference reflects different retrieval architectures. Full study
- Once you win a spot, you keep it. When a brand is mentioned in an AI answer, the same brand is mentioned in the next same-day observation about 83% of the time. When missed, the brand is missed again about 89% of the time. Persistence dominates AI answer state. Full study
- The citation ecosystem is broad. The top 10 cited domains cover about 12% of B2B citations across the three engines. The top 100 cover about 40%. Long-tail source pools carry most of the citation traffic. Full study
- Authority does not predict citations. Page-level correlation between Domain Rating and per-page citation count is −0.17. Middle-authority pages get cited as often as top-authority ones. Full study
- Source family swings mention rate by 33 percentage points. When the AI cites a directory profile, the answer mentions the brand 60.2% of the time. When it cites a community forum, only 28.8%. Full study
- ChatGPT is website-heavy. Perplexity and Google AI Mode are balanced. ChatGPT draws 68.8% of citations from brand websites. Perplexity and Google AI Mode split evenly across websites (35-38%), lists (33-34%), and editorial (24-25%). Full study
- Perplexity is the density channel. When Perplexity names your brand, it names it 5 or more times in 10.6% of answers. ChatGPT does so in 5.6%. Perplexity has both the highest mention rate and the highest mention density. Full study
- Category matters more than any single benchmark. B2B mention rates in our panel range from 9% (Events & ticketing) to 70% (CRM). Cross-B2B benchmarks are off by 15 to 45 points from most specific categories. Full study
- The prompt panel design is a bigger lever than tactics. Naming the brand in the prompt adds 60 percentage points to the adjusted mention rate. Adding buyer-intent angles to a short prompt adds 18.7 percentage points per angle. Panel design determines what the number means. Full study
Part 1: The three engines are structurally different products
The prevailing framing in the AI-search industry is that ChatGPT, Perplexity, and Google AI Mode are three variants of the same underlying product. A team building an AI-visibility strategy will often produce one content playbook and apply it uniformly across all three surfaces. Our data says that approach leaves most of the addressable visibility on the table on at least two of the three engines. The engines behave differently at every measurable layer: citation frequency, answer length, mention density, and source-family mix. Each of those differences implies a different content and measurement strategy.
1.1 Cross-engine consensus is rare
The first observation from our data is how rarely the three engines agree with each other on the same B2B prompt asked on the same day.
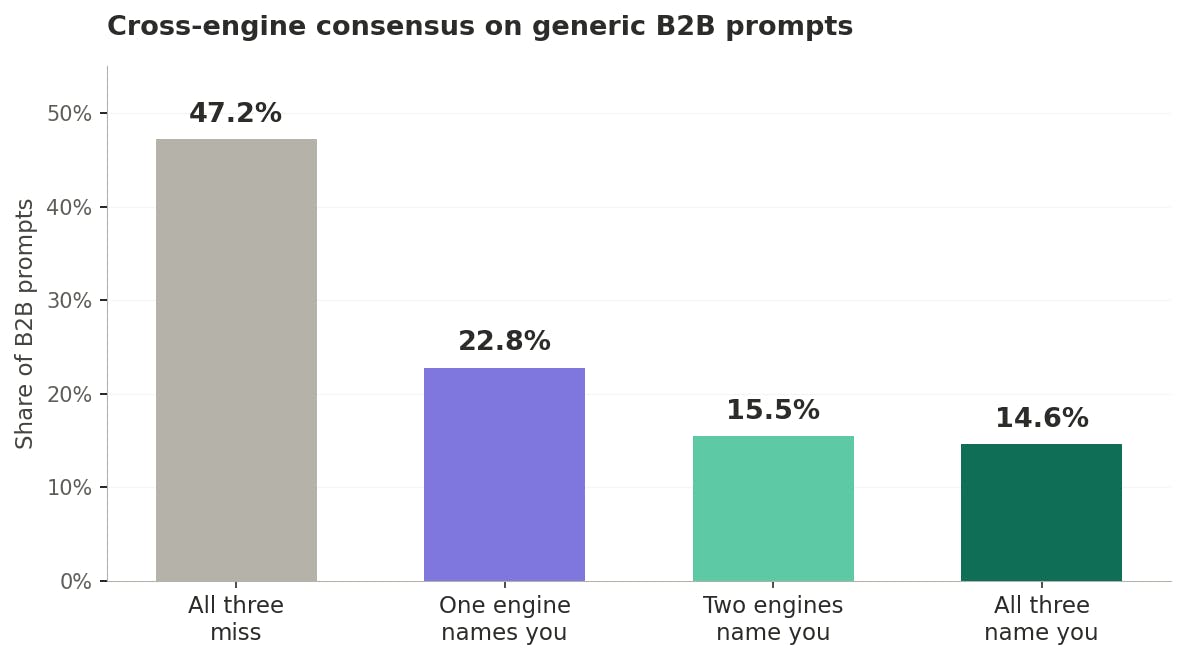
Cross-engine consensus on generic B2B prompts
On generic (unbranded) B2B prompts run the same day across all three engines, the brand is missing from all three answers 47.2% of the time. It appears in one engine 22.8% of the time. It appears in two engines 15.5% of the time. It appears in all three engines only 14.6% of the time. The domain-level Jaccard similarity across engines on the same prompt sits between 0.05 and 0.13, which is very low. The engines are not returning the same information about the same query.
When we run the same analysis on branded prompts (prompts that explicitly name the tracked brand), consensus jumps to 92.4% all-three-engine agreement. So the low consensus on generic prompts is not a random noise effect. It is an artifact of different retrieval and synthesis choices per engine, which converge when the query removes the ambiguity by naming the specific brand.
For a marketer, this means that if your buyer asks a generic category question, you have a 47% chance of being invisible on any specific engine. The specific engine your buyer used has a much larger effect on whether your brand appears than any content optimization you are doing. Cross-engine measurement is required. Single-engine dashboards produce dangerously incomplete pictures.
Read the full cross-engine consensus study →
1.2 Citation frequency varies substantially by engine
The second engine-level difference is how often each engine cites a source at all.
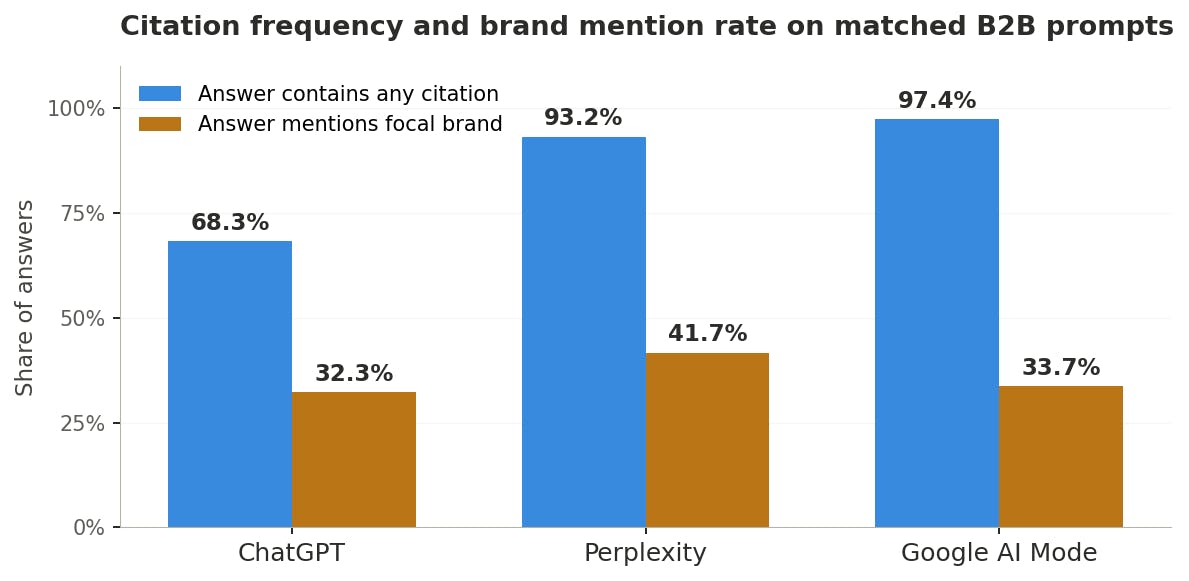
Citation frequency and brand mention rate on matched B2B prompts
Google AI Mode cites a source in 97.4% of B2B answers. Perplexity cites in 93.2%. ChatGPT cites in 68.3%. On the same matched prompts, Google AI Mode and Perplexity are essentially always citing. ChatGPT is citing about two-thirds of the time and answering from parametric training data the rest of the time.
The mention-rate pattern reveals a different asymmetry. On the same matched-day prompts, Perplexity has the highest brand mention rate (41.7%), then Google AI Mode (33.7%), then ChatGPT (32.3%). Perplexity also produces the shortest answers (2,447 characters on average versus ChatGPT’s 3,361), but with the most citations per answer (6.71 versus ChatGPT’s 3.60). Google AI Mode sits between the two on both measurements.
The takeaway is that AI-visibility measurement has to disentangle citation events (does the AI cite anything?) from brand-mention events (does the AI name a specific brand in the answer?). These are two related but distinct behaviors, and the engines vary on both independently. Two teams reporting “AI citation rate” can be describing completely different measurements without realizing it.
Read the full citation-presence study →
1.3 Answer length and citation density are per-engine traits
The relationship between answer length and citation count is one of the more counterintuitive findings in our data.
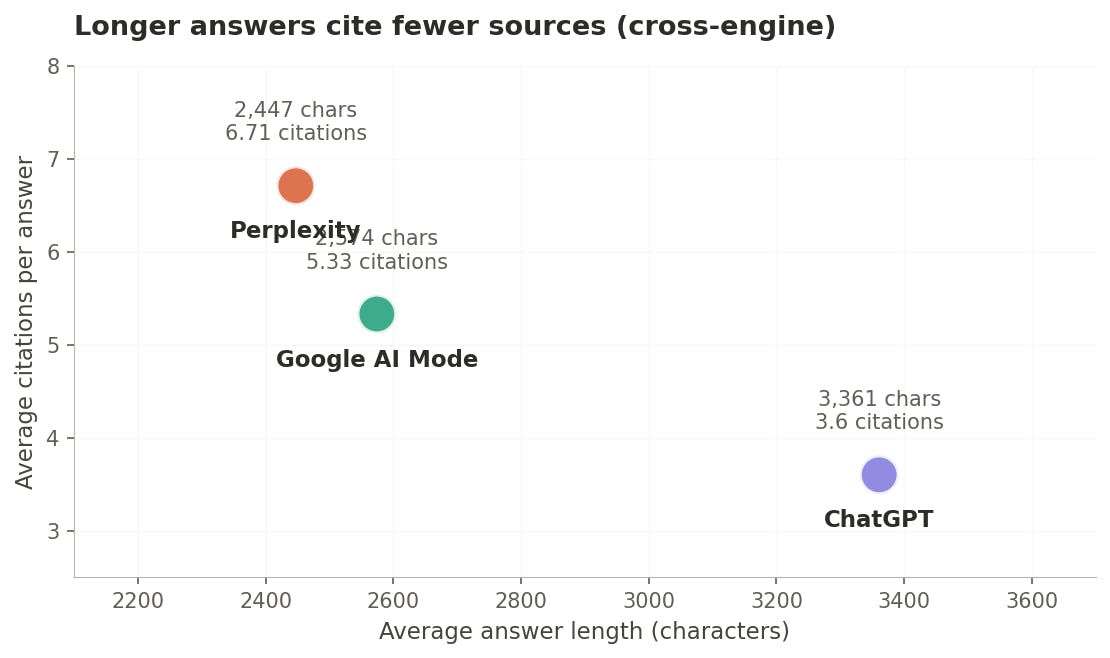
Longer answers cite fewer sources (cross-engine)
At the engine level, longer answers cite fewer sources. ChatGPT writes the longest average answer (3,361 characters) and cites the fewest sources (3.60 per answer). Perplexity writes the shortest answers (2,447 characters) and cites the most sources (6.71). Google AI Mode sits between them at 2,574 characters and 5.33 citations.
Within each engine, citation counts are roughly flat across answer-length buckets. So the negative correlation operates between engines rather than within them. Each engine has a fixed citation density trait: Perplexity puts a citation every 365 characters on average. Google AI Mode puts one every 483. ChatGPT puts one every 933. Making a ChatGPT answer twice as long does not produce twice as many citations. The engine’s citation density is a design constant that does not respond to answer size.
For a marketer, this contradicts a widely repeated piece of advice that longer content produces more AI citations. The engine determines its citation density regardless of how much content is available in the retrievable pool. What earns citations at a given rate is extractability and topical strength rather than word count.
Read the full length-vs-citations study →
1.4 Perplexity is the density channel
The engines also differ on how many times they name a specific brand within a single answer.
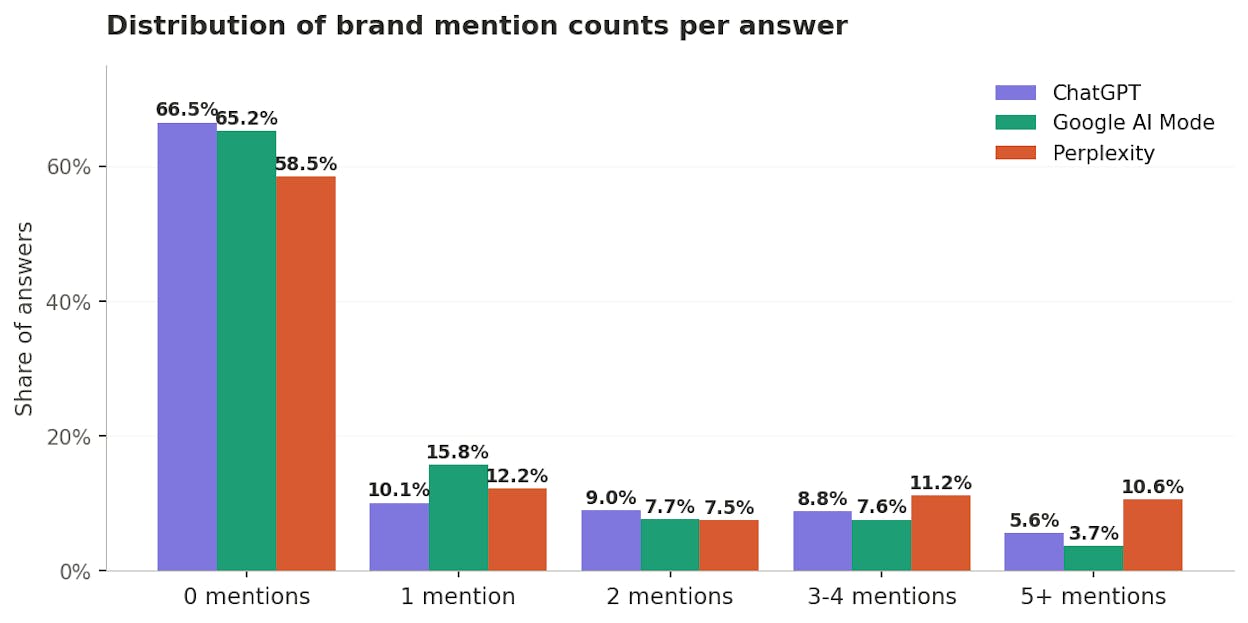
Distribution of brand mention counts per answer
Perplexity names the focal brand 5 or more times in 10.6% of its answers. ChatGPT does so in 5.6%. Google AI Mode does so in 3.7%. Perplexity is roughly twice as likely to produce a mention-dense answer as ChatGPT, and about three times as likely as Google AI Mode.
The zero-mention rates are closer than the tail suggests: Perplexity misses the brand in 58.5% of answers, ChatGPT in 66.5%, Google AI Mode in 65.2%. So the difference is not that Perplexity mentions the brand a lot more often. It is that when Perplexity does name the brand, it names it more times within the same answer.
The mechanism is that Perplexity’s answer format on recommendation prompts is a numbered shortlist with citation attribution for each entry. Brands that make the list get a dedicated paragraph with their own citation, and Perplexity often circles back to name them again in a summary or comparison section. ChatGPT’s answer format is more prose-heavy, and mentions are spread thinner across a longer narrative.
For a marketer, this means Perplexity is best understood as the prominence channel. When your brand appears there, it appears more visibly than on the other engines. The recommendation and shortlist prompt archetypes drive most of the density lift.
Read the full mention-density study →
1.5 Each engine has its own source-family signature
The most fundamental structural difference between the three engines is the mix of source families they reach for.
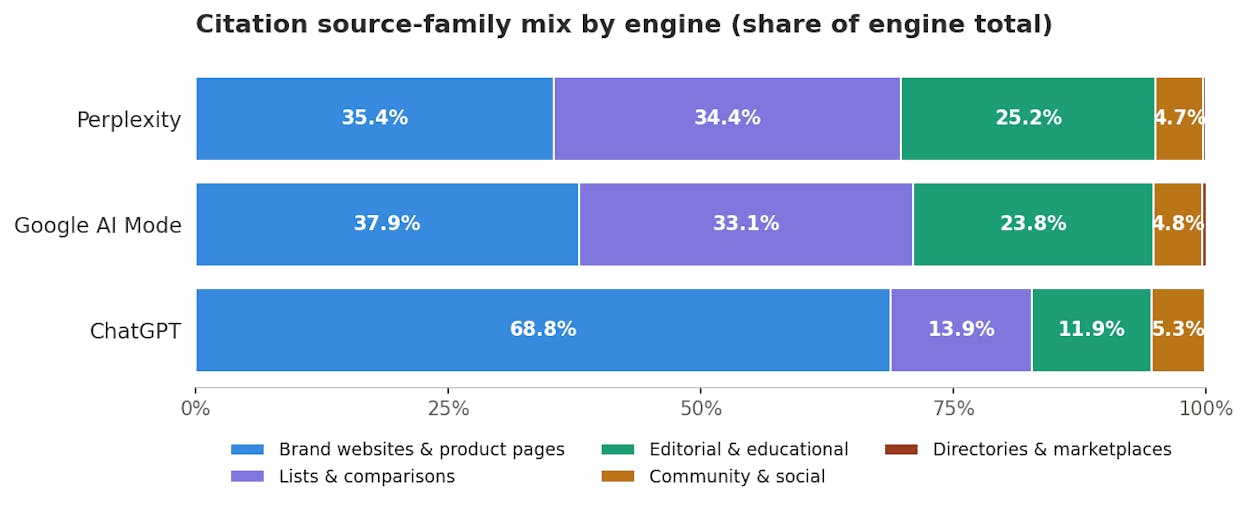
Citation source-family mix by engine
ChatGPT concentrates 68.8% of its citations in brand websites and product pages. Its other four families (lists, editorial, community, directories) sit at 13.9%, 11.9%, 5.3%, and 0.13% respectively. ChatGPT is a website-first engine that occasionally reaches for third-party sources.
Perplexity and Google AI Mode are three-family engines. Both distribute their citations approximately evenly across brand websites (35-38%), lists and comparisons (33-34%), and editorial and educational content (24-25%). Community sits at 4.7-4.8%. Directories at 0.26-0.46%. Both engines look like traditional search-engine retrieval patterns, drawing from a mix of source types.
The mechanism reflects each engine’s design origin. ChatGPT was built as a conversational assistant with parametric knowledge as the primary source and live retrieval as a supplementary layer, so when it does cite, it reaches for canonical brand-owned sources. Perplexity was built as a citation-first synthesizer that performs a fresh search on every query. Google AI Mode inherits from Google search infrastructure and reflects the diverse source mix of Google’s ranked results.
For content strategy, this implies three different portfolios. ChatGPT visibility depends mostly on brand-website hygiene. Perplexity and Google AI Mode visibility depend on a broader mix that includes third-party lists, comparison articles, and editorial coverage. Treating “AI content strategy” as one investment underweights whichever engine is not aligned with your current content mix.
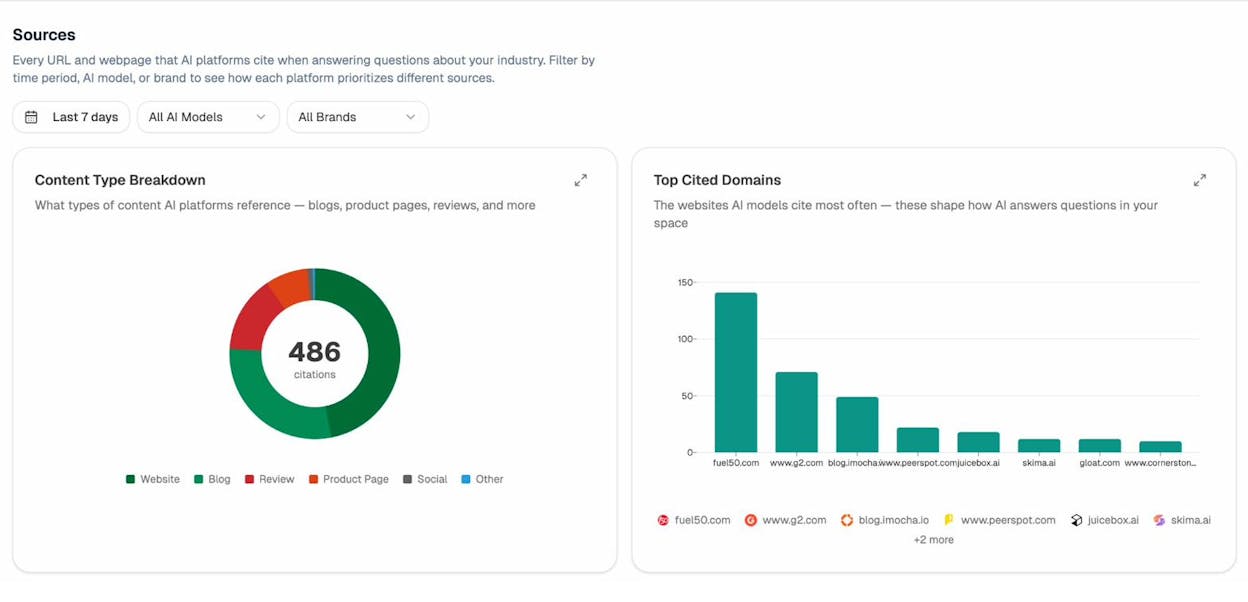
Source dashboard showing per-brand source-family breakdown across engines
Read the full source-family-mix study →
What Part 1 means for AI-visibility programs
The core implication of the engine-level differences is that a single “AI visibility” number aggregated across all three engines hides most of the actionable variance. A brand can have 45% mention rate on Perplexity, 30% on Google AI Mode, and 20% on ChatGPT while reporting a blended 32%, and the blended number tells you nothing about which engine to prioritize or which content investments will move it. Per-engine measurement is the minimum viable dashboard for anyone taking AI visibility seriously in 2026.
The second implication is that content strategy needs a per-engine portfolio. ChatGPT rewards owned-website hygiene. Perplexity and Google AI Mode reward third-party list inclusion and editorial coverage. A team investing entirely in one of these tracks is optimizing for one engine at the cost of the other two.
The third implication is that the intuitive knobs (write more content, write longer content, target more citations) do not work the way the industry pitch implies. Engines have fixed citation densities. Answer length is decoupled from mention rate within engines. The levers that do work are more specific, and Parts 2, 3, and 4 unpack them.
Part 2: The citation ecosystem is broad and diffuse
The second cluster of findings concerns the shape of the citation ecosystem itself. If you were designing an AI-visibility strategy in a spreadsheet, you would want to know which specific domains and page types earn the most citations, so you can target them. Our data shows that approach misses the fundamental structure of the AI citation pool. There is no small set of dominant domains. There is no clean relationship between traditional authority signals and citation frequency. And the specific platforms that industry conversation treats as high-value AI-visibility sources (Reddit, YouTube) behave very differently than the pitch implies.
2.1 The top 10 domains cover only about 12% of citations
Traditional SEO thinking assumes that the citation pool concentrates in a small number of authoritative domains. Our data does not support that assumption for B2B AI search.
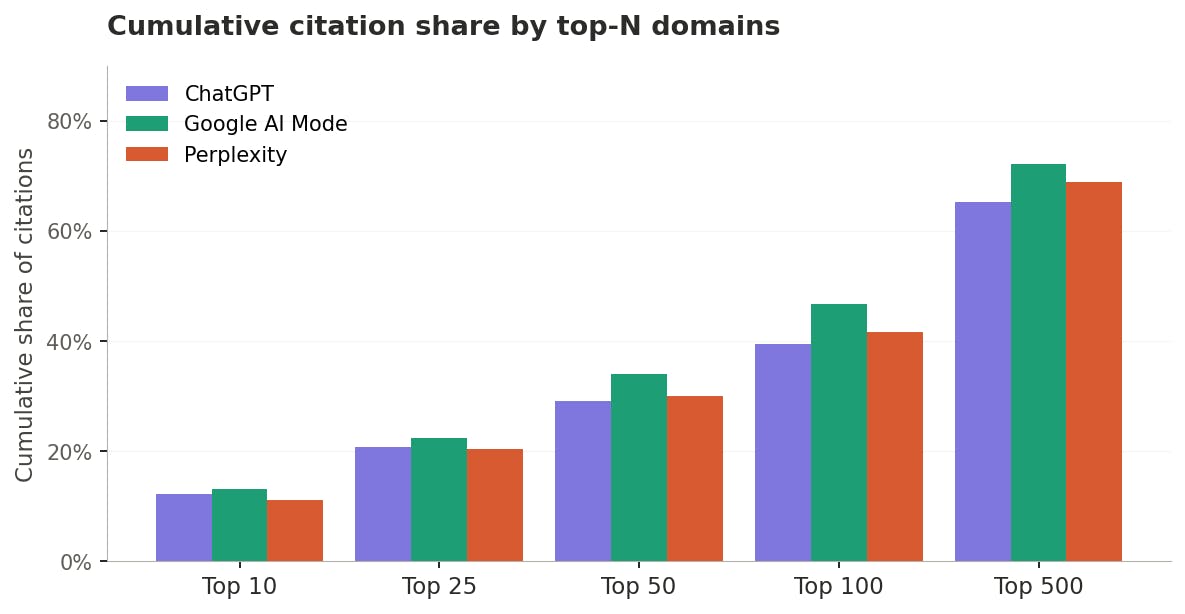
Cumulative citation share by top-N domains
The top 10 cited domains cover 11.1% to 13.1% of citations depending on the engine. The top 25 cover 20.4% to 22.5%. The top 50 cover 29.2% to 34.0%. The top 100 cover 39.5% to 46.8%. Even the top 500 domains only cover about 65% to 72% of the citation pool. The Herfindahl-Hirschman Index of the citation ecosystem is around 0.003 across engines, which is a very low concentration score compared to almost any other digital marketplace.
The broadest domains (the ones that appear cited across the most tracked organizations) are recognizable: YouTube appears in citations for 21 organizations, Reddit for 21, Wikipedia for 15, Facebook for 13, LinkedIn for 12, G2 for 12, Medium for 12, Instagram for 11, TechRadar for 10, Zapier for 10, Salesforce.com for 9, Google.com for 9. But even these broadest sources contribute a small share of any specific organization’s citation pool.
For AI-visibility strategy, this means the “top-cited domains” list is not the right investment target. A domain that appears in the top 10 is still contributing only about 1 to 2% of citations on average. Placing content on 10 of these domains gets you into 10 to 20% of the citation pool at most. The remaining 80% comes from a long tail that no single content investment can capture. Diversified investment across many source families beats concentrated investment in a small number of “AI-friendly” domains.
Read the full top-domains study →
2.2 Page authority does not predict citation frequency
The natural follow-up hypothesis is that even if the domain pool is diffuse, page-level authority signals like Ahrefs Domain Rating still predict how often specific pages get cited. Our data does not support that hypothesis either.
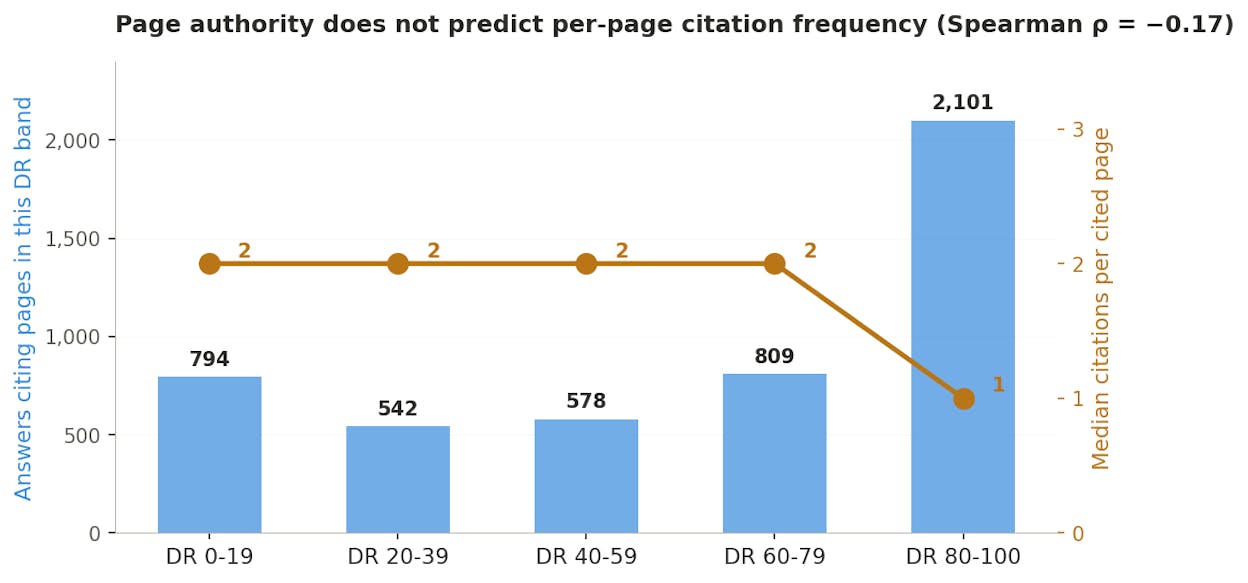
Page authority does not predict per-page citation frequency
At the page level, the Spearman correlation between page authority and citation count across our 4,824 cited-page sample is −0.17 (p = 4.13e-31). The correlation is significant and negative. Higher-authority pages are cited slightly less often on average than lower-authority ones. When we bucket pages into authority bands, the median cited page in the DR 0-19 band gets 2 citations. So does the median cited page in the DR 20-39 band. The DR 40-59 band: 2 citations. The DR 60-79 band: 2 citations. The DR 80-100 band: 1 citation. Authority does not drive per-page citation frequency.
What does drive it? Topical strength and extractability. AI engines are looking for pages that answer the specific query with clean, extractable content. A DR 45 page that is topically dense on the query outperforms a DR 85 page that is topically thin. Our page-level data shows this consistently.
This finding is consistent with what Ahrefs has reported at a much larger scale. In their analysis of 75,000 brands, third-party brand mentions correlate 0.664 with AI citation rates, while backlinks correlate only 0.218. The traditional SEO authority signal is much weaker than earned mention density at predicting AI citations. Our page-level Spearman finding is the smaller-sample version of the same phenomenon.
For an SEO team’s AI-visibility program, the practical implication is that “improve domain authority” is not the right optimization target. Improving topical strength on specific query classes matters more. And earning mentions on third-party pages that discuss your category matters most of all.
Read the full authority study →
2.3 YouTube incidence varies 700x by engine
Two specific platforms deserve their own treatment because the industry conversation treats them as high-priority AI-visibility investments: YouTube and Reddit. Our data on both is very different from the prevailing message.
YouTube appears in 9.15% of Perplexity’s B2B answers. In Google AI Mode, it appears in 7.52% of answers. In ChatGPT, it appears in 0.013% of answers. That is 1 answer out of 7,651 in our ChatGPT sample. YouTube is essentially absent from ChatGPT B2B answers.
For a B2B marketer investing in YouTube content specifically to move AI visibility, this means the investment has almost no chance of moving ChatGPT mention rates. It has meaningful potential on Perplexity and Google AI Mode, where YouTube shows up in 7-9% of answers. But even on those engines, the co-occurrence between YouTube citations and brand mentions is weak: adjusted confidence intervals cross zero, meaning a YouTube citation does not systematically correlate with the brand being mentioned in the answer.
The mechanism is that YouTube pages cited by AI engines are usually category-explainer or tutorial content rather than brand-specific videos. Only about 3.3% of cited YouTube pages actually name a specific tracked brand on the page. So even when YouTube appears in the citation list, the brand-naming transfer to the answer is weak.
Read the full YouTube and Reddit study →
2.4 Cited Reddit threads rarely name the brand
The Reddit story is similar but more specific.
Across our 879 deduplicated cited Reddit threads, only 4.1% actually name the tracked brand on the Reddit page itself. The remaining 95.9% are threads discussing the category or the topic without naming the specific tracked brand. Top cited subreddits include r/digitalmarketing (61 citations), r/sales (52), r/saas (28), r/productmarketing (29), r/b2bmarketing (20), r/b2bsaas (19), r/revops (14), and r/hubspot (14).
For a B2B marketer investing in Reddit content strategy specifically to move AI mentions, this is the critical number. Even if you succeed at getting a Reddit thread that discusses your category to be cited by an AI engine, only 4% of the time will that thread name your brand. Reddit as a citation source is much closer to a topical-authority signal than to a direct-mention driver.
Our finding aligns with the source-family transfer data we cover in Part 3: community and social sources produce a -9.2 percentage-point effect on brand mention rate when they are cited. So Reddit and YouTube citations not only fail to name the brand on the source page, they also correlate with the surrounding AI answer being less brand-focused than average.
Read the full Reddit brand-mention study →
What Part 2 means for source portfolios
The citation ecosystem’s diffuse structure means that a “get on the top-cited domains” strategy is fundamentally under-scoped. Even perfectly executing that strategy leaves 80% of the citation pool uncovered. What works better is investing across source families in ways that match how each engine actually retrieves.
The weak authority-to-citations relationship means traditional SEO authority is not the AI-visibility lever. Topical extractability and third-party earned mentions are much stronger predictors. Programs that reallocate from generic authority-building (link acquisition, DR-lift work) to topical-content-density work should see better AI-visibility outcomes.
And the community-source data (Reddit, YouTube) argues for repositioning those investments from “AI-visibility drivers” to “topical-authority builders.” Both platforms build category presence over time through the aggregate Ahrefs-style correlation mechanism, but neither produces direct AI mention lift the way the industry pitch implies. Budgeting them as slow-signal topical investments is more accurate than budgeting them as fast-signal AI-visibility drivers.
Part 3: What actually moves brand mentions
The first two parts of this report describe what does not work as well as marketers assume. Part 3 describes what does work. Three specific mechanisms carry most of the brand-mention signal in our data: source-family transfer, persistence dynamics, and the surprisingly weak coupling between page-level sentiment and answer sentiment.
3.1 Commercial sources travel with mentions. Community and editorial do not.
The single strongest mechanism we identified for brand mentions is the correlation between which source family the AI cites and whether the AI names the brand in the answer.
Source-family transfer to brand mention rate
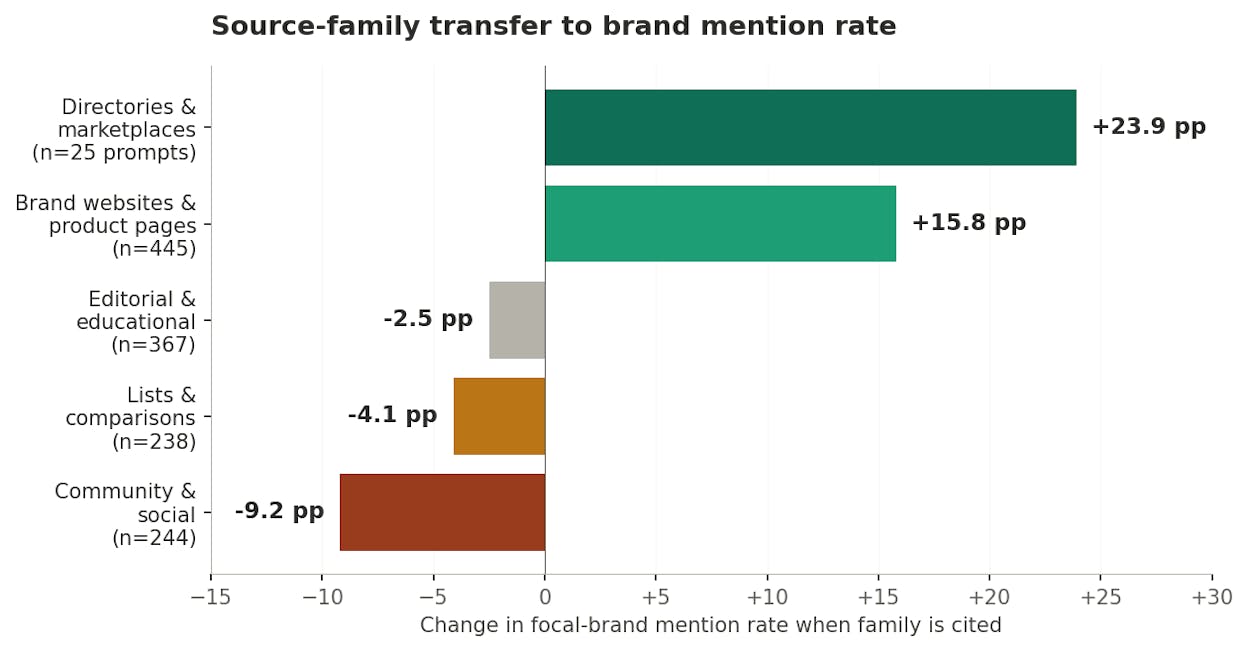
When the AI cites a directory or marketplace page (G2, Capterra, TrustRadius, and similar), the answer mentions the focal brand 60.2% of the time. When directories are not cited, the mention rate drops to 36.3%. That is a +23.9 percentage-point transfer effect on a directional sample (269 answers, 25 prompts).
When the AI cites a brand-owned website or product page, the answer mentions the brand 42.6% of the time. When brand websites are not cited, the mention rate is 26.8%. That is a +15.8 percentage-point transfer effect on a broad sample (13,785 answers, 445 prompts).
When the AI cites editorial or educational content, the mention rate is 35.2% versus 37.7% without. A −2.5 percentage-point effect. When lists and comparisons are cited, the mention rate is 34.1% versus 38.2% without. A −4.1 point effect. When community and social sources are cited, the mention rate is 28.8% versus 38.0%. A −9.2 point effect. All three topical-source families produce zero or negative transfer to specific-brand mentions.
The mechanism has two parts. First, commercial-source citations are partly mechanistic: when the AI decides to feature a brand, it reaches for the brand’s own website or its directory profile as a canonical source. So the citation and the mention appear together as two outputs of the same decision. Second, topical-source citations reflect the AI moving toward category description rather than brand recommendation, and category answers name fewer specific brands per unit of content.
For a marketer, this reframes the earned-media investment case. Commercial sources (owned site, directory profiles) directly correlate with mention rate. Topical sources (Reddit, YouTube, editorial content) build category presence but do not directly correlate with brand mentions in the AI answer. Both matter, but they play different roles in the visibility program.
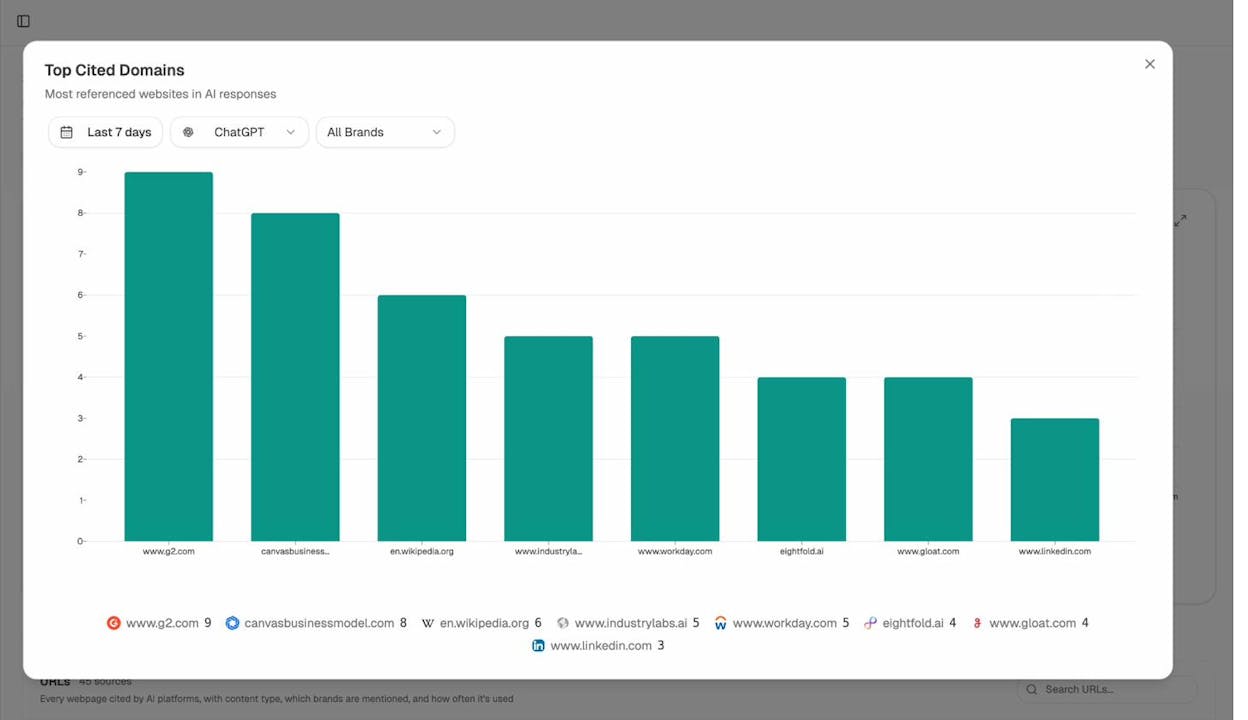
Source dashboard showing source-family split for one tracked prompt panel
Read the full source-family transfer study →
3.2 Once you win a spot, you keep it
The second core mechanism is persistence. AI answer state is much more sticky than the industry conversation suggests.
Same-day to next-observation mention persistence
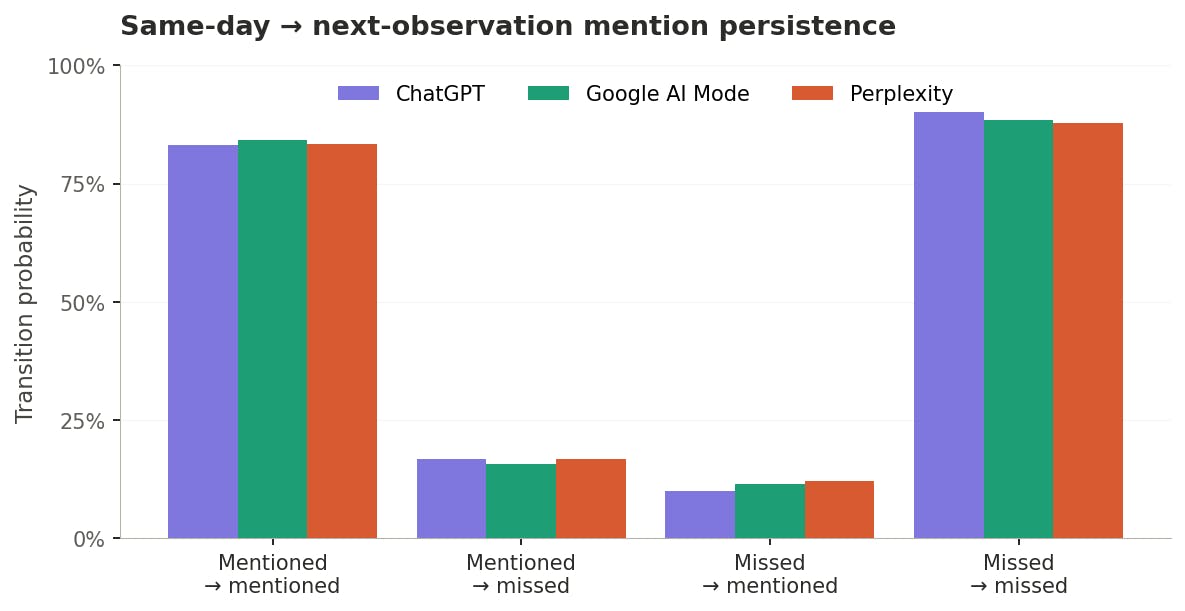
When a brand is mentioned in an AI answer on a given prompt, the same brand is mentioned in the next same-day observation on the same prompt 83.2% of the time on ChatGPT, 84.2% on Google AI Mode, and 83.3% on Perplexity. When a brand is missed, the brand is missed again 90.1% of the time on ChatGPT, 88.5% on Google AI Mode, and 87.9% on Perplexity. The Cohen’s kappa scores for these transition matrices sit between 0.44 and 0.58, which is moderate-to-substantial agreement across observations.
The 8x asymmetry between the “mentioned given mentioned” and “mentioned given missed” transition rates means the AI’s answer state is a real, persistent property of the current retrieval and synthesis conditions rather than a random draw on each query. When you win a spot in an AI answer, you tend to keep it for a while. When you are missing, you tend to keep missing.
One direct implication of this pattern is that AI-visibility gains compound. A brand that earns its way into an answer for a specific prompt tends to hold that position, giving compounding returns on the content and citation work that got it there in the first place. The other direct implication is that missing-brand states are equally sticky. A brand not currently appearing has to do disproportionate work to change the answer state, since the default is to remain missing.
The volatility we do observe (about 17% of mentioned-brand transitions flip to missed on the next observation, about 11% of missed-brand transitions flip to mentioned) means the answer state is not permanent. Content and citation changes do move the state over time. But they move it slowly, and reporting AI visibility on a weekly or bi-weekly cadence catches the transitions accurately without over-interpreting daily noise.
Read the full persistence study →
3.3 Sentiment on the cited page does not predict answer sentiment
The third mechanism we tested was the transfer of sentiment. If the AI cites a page that speaks positively about your brand, does the AI answer speak positively about your brand? Our data says no.
Across the 985 pairs of scored citation pages and scored AI answers in our sample, the Spearman correlation between page sentiment and answer sentiment is 0.00 (p = 0.983). Cited-page sentiment and AI-answer sentiment are statistically independent. The AI does not preserve the emotional coloration of its sources when synthesizing the answer.
Overall answer sentiment across our sample is 58.3% positive, 40.8% neutral, and 0.9% negative. The average answer sentiment score is 64.6 on a 0-100 scale. ChatGPT averages 57.6, Google AI Mode 69.0, Perplexity 69.6. All three engines produce heavily positive-skewed answers, which matches BrightEdge’s finding of 94-96% positive AI answer sentiment on their much larger sample.
The specific perception labels that appear most often across our AI answers include “Personalized career pathways” (36 mentions), “Platform extensibility” (18), and “Vendor lock-in risk” (14). The perception frame the AI attaches to your brand depends on the specific prompt and category rather than on the sentiment of the pages it cites.
For a marketer, this means that traditional PR and reputation work targeted at improving the sentiment of pages that discuss your brand does not directly translate into improved AI-answer sentiment. The AI generates its own emotional framing based on the query and its synthesis choices, largely independent of the source sentiment. Positive PR still matters for direct-audience reasons and for the aggregate signal that Ahrefs measured, but it is not a lever for AI-answer sentiment specifically.
Read the full sentiment-transfer study →
What Part 3 means for content strategy
The commercial-source transfer finding is the single most actionable insight for a marketing team. It reframes the earned-media portfolio into two distinct programs: a commercial program (owned site, product pages, directory profiles) that directly correlates with mention rate, and a topical program (community, editorial, comparison) that builds category authority but does not directly move mentions. Both matter, but reporting them together as “citations earned” hides the mechanism.
The persistence finding argues for programs that push for the initial spot with disproportionate investment. Winning a spot compounds over time. The second and third months of visibility require less content work than the first month, because the state is sticky. This makes AI-visibility work look like classic SEO work: heavy upfront investment for compounding downstream returns.
The sentiment finding argues against traditional PR-as-AI-sentiment-lever thinking. AI answers produce their own sentiment frames largely independent of the source pages. Positive PR still matters, but it is not the mechanism for AI-answer sentiment. If sentiment on AI answers is the goal, the intervention has to happen at the prompt level or the perception-label level rather than at the citation-page level.
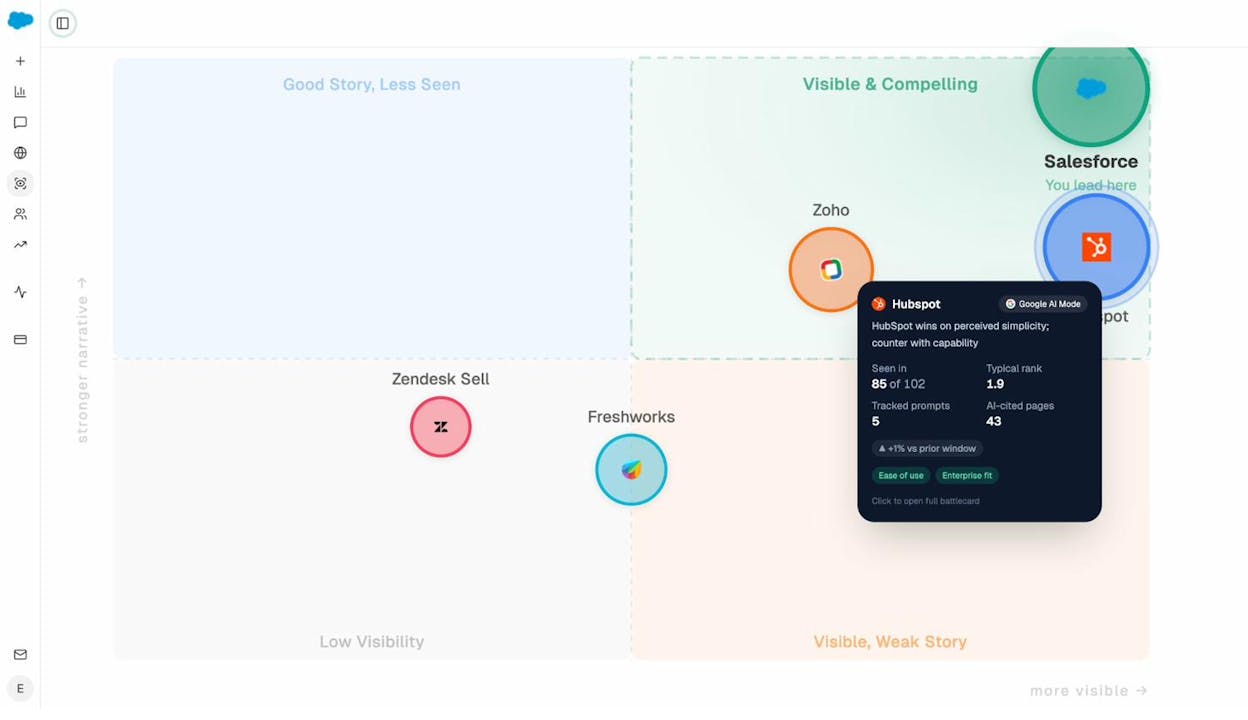
Perception view showing per-brand attributes across AI engines
Part 4: The panel you track determines the number you report
The fourth cluster of findings addresses a problem that most AI-visibility reporting programs have not confronted yet. The specific set of prompts a team tracks (their “prompt panel”) drives the reported mention rate as much as any actual visibility change would. Compositional shifts in the panel produce mention-rate changes that look like performance changes but reflect measurement changes.
4.1 Category mention rates range from 9% to 70%
The first compositional axis is category.
B2B mention rates by category
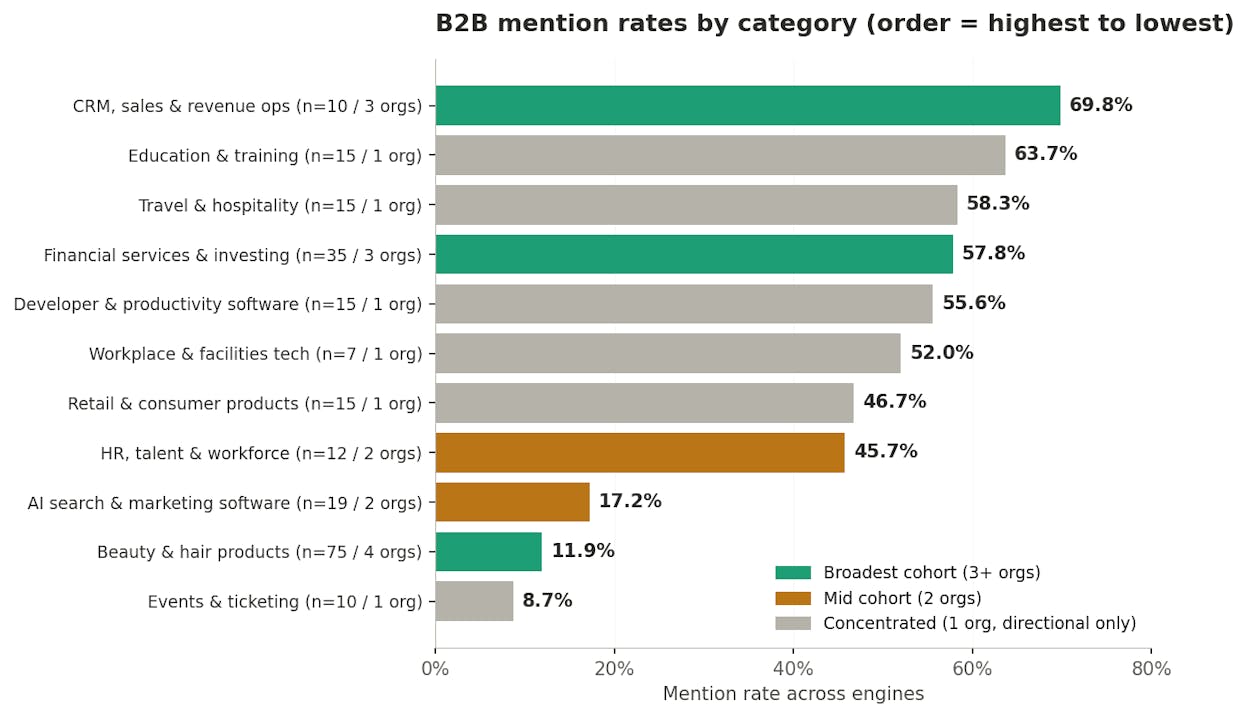
Across the 11 B2B categories in our panel, mention rates range from 8.7% (Events & ticketing, 10 prompts across 1 org) to 69.8% (CRM, sales & revenue operations, 10 prompts across 3 orgs). The broadest-sample categories are Beauty & hair products (75 prompts / 4 orgs, 11.9% mention rate) and Financial services & investing (35 prompts / 3 orgs, 57.8%). Both are the most reliable per-category benchmarks in our data.
The pattern is not random. Categories where the tracked brand is one of a small number of market alternatives (CRM, Financial services) tend to produce higher mention rates, because the AI’s plausible-brand set is smaller and each tracked brand takes a larger share of it. Categories with dozens or hundreds of alternatives (Beauty, AI marketing software) produce lower per-brand mention rates, because the AI distributes its attention across a broader set.
For a marketer, this reframes what “AI visibility benchmarks” mean. A cross-B2B benchmark of 30% (which is close to our overall matched-sample average) is off by 15 to 45 points from most specific categories. Applying that benchmark to your category will misestimate your position substantially. The right reference number for your program is your own tracked-panel baseline over time rather than a cross-category average.
The source-mix within each category also varies enormously. CRM answers pull 43% of citations from lists and comparisons, reflecting how CRM buyers use category rankings during the buying process. Beauty answers pull 46% from brand websites and 31% from editorial, reflecting a different buyer research pattern. Developer software answers pull 17% from community sources, roughly 6x the CRM community share.
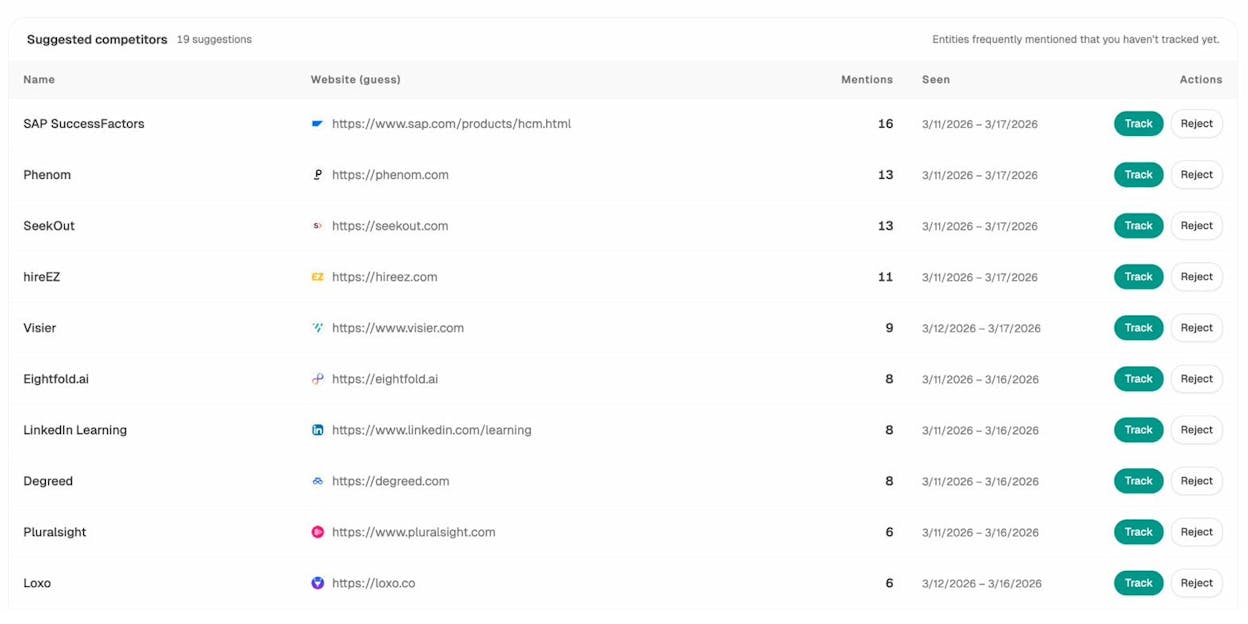
Competitor comparison view showing category-level competitive dynamics
Read the full industry variance study →
4.2 Prompt archetype shifts mention rate by 8 to 17 pp
The second compositional axis is prompt archetype: the type of question the prompt is asking.
Mention rate by prompt archetype and engine
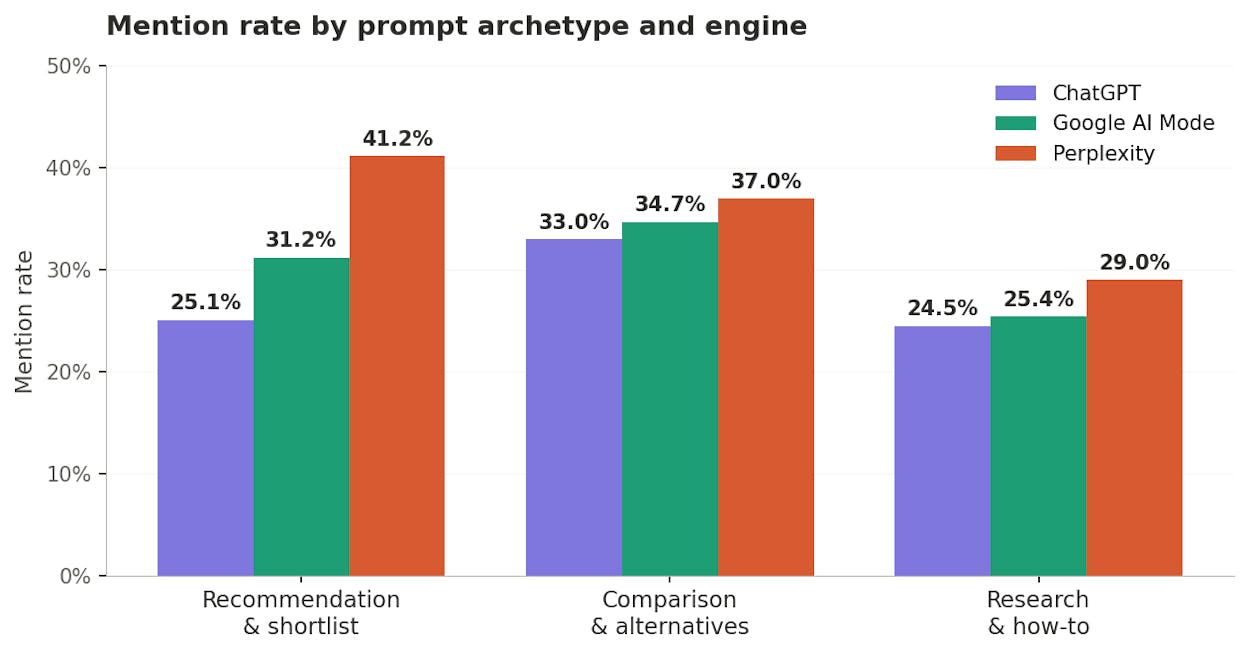
Across the three broad-sample archetypes in our data (Comparison and alternatives, Recommendation and shortlist, Research and how-to), mention rates vary by 8 to 17 percentage points depending on engine. On Perplexity, recommendation and shortlist prompts produce a 41.2% mention rate. Research and how-to prompts produce a 29.0% mention rate. That is a 12.2 percentage-point spread within Perplexity.
The ranking of which archetype produces the highest mention rate varies by engine. ChatGPT and Google AI Mode both mention brands more on comparison prompts than on recommendation prompts. Perplexity does the opposite. The reason is that Perplexity’s answer format on recommendation prompts is a numbered shortlist with per-entry citation, which forces brand naming. ChatGPT and Google AI Mode’s longer prose-style answers spread mentions more evenly across the archetype range.
For a marketer, this means the archetype composition of your tracked panel drives your reported mention rate substantially. A panel weighted toward recommendation prompts will report a higher aggregate mention rate on Perplexity than a panel weighted toward research prompts. Cross-team benchmarking requires disclosing the archetype mix, or reporting the mention rate per-archetype separately.
Read the full archetype study →
4.3 Prompt structure shifts mention rate by 60 pp
The third and largest compositional axis is prompt structure: the specific features of the prompt sentence itself.
Prompt-structure effects on mention rate
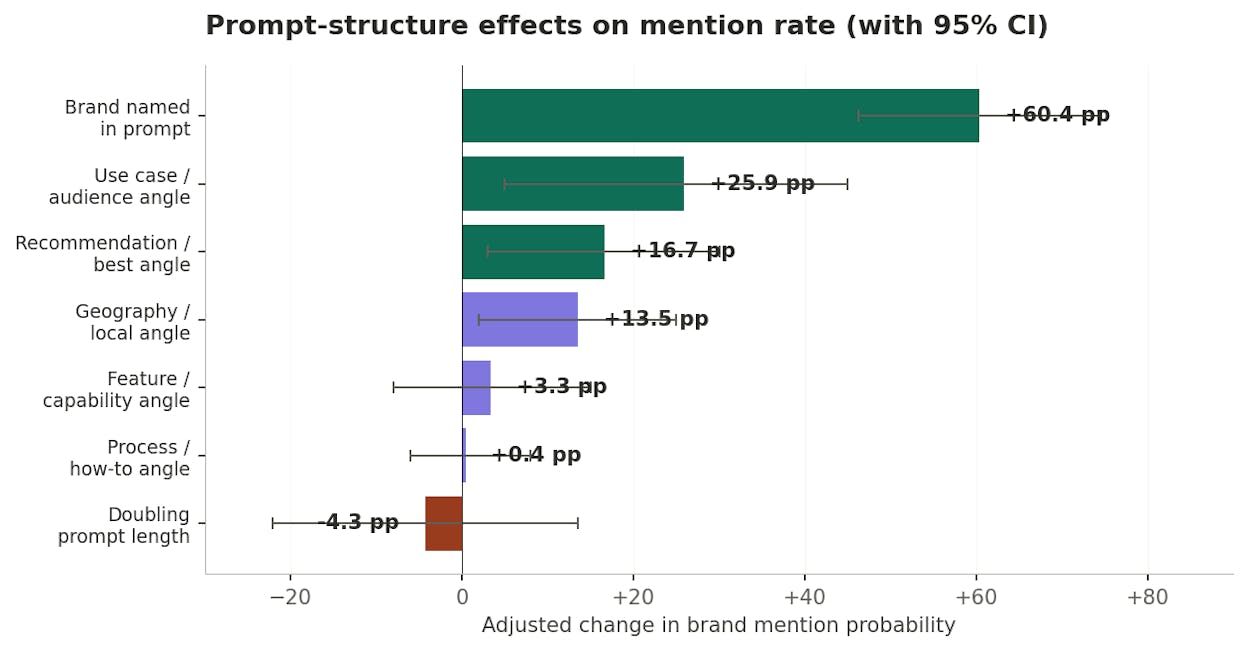
Naming the brand in the prompt adds 60.4 percentage points to the adjusted mention rate (95% CI: 46.2 to 74.6). This is the largest single lever we identified in our data. Prompts that already name the brand (“What do people say about Salesforce?”) produce mention rates near 100% on the shortest branded prompts, versus 10-40% on generic prompts of the same length.
For generic prompts (which measure real discovery), the levers that work are angle count and specific angle types. Adding a use case or audience angle produces +25.9 pp lift. Adding a recommendation or best-of angle produces +16.7 pp lift. Adding a geography or locality angle produces +13.5 pp lift. Feature and process angles produce near-zero effects. Doubling the word count of a generic prompt produces −4.3 pp with a confidence interval that crosses zero: longer generic prompts do not help mention rates.
For a marketer, the practical implication is not that you should design prompts to inflate your reported number. Buyers do not compose prompts to please marketers. The implication is that your tracked panel should split into two distinct tracks: a “prompted” track (brand-named queries) that measures how the AI describes your brand when the query has already surfaced it, and an “unprompted” track (generic queries) that measures the actual discovery behavior. Reporting these two separately, with the archetype and angle mix disclosed for the unprompted track, produces a mention rate that means something specific.
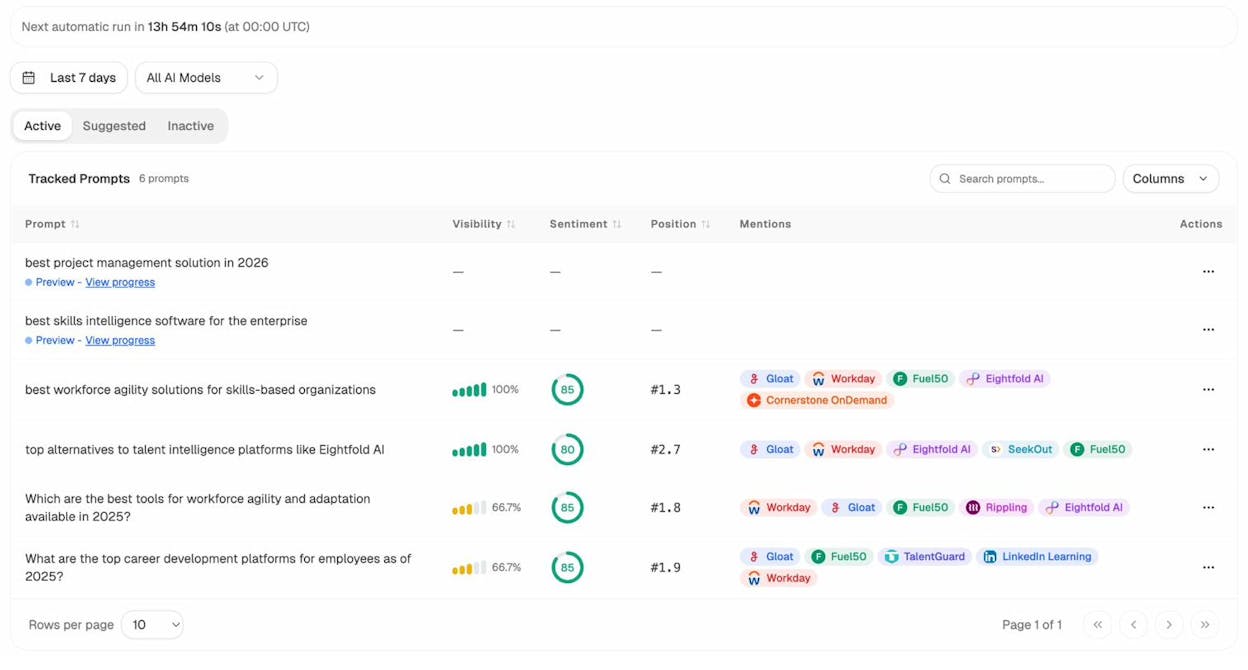
Prompts view showing per-prompt tagging with archetype and angle metadata
Read the full prompt-construction study →
What Part 4 means for reporting and benchmarking
Three compositional axes (category, archetype, prompt structure) together explain more variance in reported mention rates across teams than any actual underlying visibility change does in a typical quarter. A team can adjust its panel by adding recommendation prompts or shortening its prompts and see its aggregate mention rate move for reasons that have nothing to do with real AI visibility changes.
This has direct implications for how AI-visibility programs should report. The single aggregate mention rate is not a useful KPI unless it comes with the compositional context. A better reporting structure is: - Prompted mention rate (with a “confirmed appearance” framing and a high floor) - Unprompted mention rate (the primary discovery metric) - Per-engine breakdown of both (because engines behave differently) - Per-archetype breakdown of the unprompted rate (because archetypes swing the number) - Sample transparency (specific prompt count, category context, panel composition)
Reporting this decomposition makes the number defensible to critical stakeholders and interpretable across time as the program matures. Reporting a single blended number invites both false confidence and false alarm.
Part 5: How to build an AI-visibility program in 2026
Parts 1 through 4 describe what the data says about how AI search behaves. Part 5 synthesizes those findings into a practical program design that a marketing team can execute against in 2026. Four components matter: the tracked prompt panel, the content portfolio, the reporting structure, and the sequencing of investment.
5.1 The tracked prompt panel
The prompt panel is the instrument that measures your program. It has to be designed carefully, because its composition drives the numbers you report.
Split the panel into two tracks from the start. The prompted track contains queries that name your brand explicitly. It measures how the AI describes your brand once the query has surfaced it, and it produces a high mention rate that acts as a “confirmed appearance” metric with a floor near 100%. Report it as a data-quality check on your monitoring: if prompted mention rates drop from 95% to 75%, something has broken in the AI’s knowledge of your brand.
The unprompted track contains generic queries that reflect how your buyers actually search. It measures real AI discovery behavior. Design it to match the archetype mix, angle count, and length distribution your buyers naturally use in your specific category. A rough default for most B2B categories is 30-60 prompts, with roughly 40% recommendation and shortlist, 30% comparison and alternatives, 20% research and how-to, and 10% category-broad discovery prompts. Adjust the mix based on your actual buyer research patterns.
Cover all three engines from day one. Cross-engine consensus is rare enough (14.6% on generic prompts) that single-engine measurement produces dangerously incomplete pictures. Weekly cadence is generally sufficient for reporting, given the 83% persistence we observed. Daily cadence produces more noise than signal.
Disclose the panel composition when you report the aggregate number. “Our AI mention rate is 32% on a panel of 45 unprompted prompts with a 40/30/20/10 archetype mix, covering 3 engines, in the CRM category” is a defensible statement. “Our AI mention rate is 32%” is not.
5.2 The content portfolio
A per-engine content portfolio has three separate programs, each with its own investment logic and success metrics.
The commercial-content program covers your owned website, product pages, homepage, and directory profiles (G2, Capterra, TrustRadius, category-specific directories). It directly correlates with brand mention rate through the source-family transfer mechanism. This program is highest-leverage for ChatGPT visibility, since 68.8% of ChatGPT citations are brand-owned pages. It also matters for Perplexity and Google AI Mode, where 35-38% of citations are brand-owned. Measure this program by the citation rate of your owned pages on your tracked prompt panel.
The list-inclusion program covers third-party category rankings, comparison articles, top-10 blog posts, and vendor directories. This program is highest-leverage for Perplexity and Google AI Mode, where 33-34% of citations come from lists. It matters much less for ChatGPT, where lists are only 13.9% of citations. Measure this program by how often lists that include your brand get cited on your tracked panel, and by your relative position within those lists (BrightEdge found 86% of Perplexity’s brand mentions land in position 5 or earlier).
The editorial-inclusion program covers industry publications, category-explainer articles, and educational content that discusses your category. This program is highest-leverage for Perplexity and Google AI Mode, where 24-25% of citations come from editorial. It matters least for ChatGPT. Editorial content produces slower AI-visibility signal than commercial or list content, but builds durable topical authority that supports the aggregate mentions-correlation-with-citations relationship Ahrefs measured at 0.664.
Community and social investment (Reddit, LinkedIn, forums) should be budgeted as a topical-authority builder rather than as a direct AI-visibility driver. Cited community pages only name the tracked brand 4.1% of the time, and community citations correlate with a -9.2 point mention-rate effect on the surrounding answer. Community investment matters for the aggregate signal over months and quarters. It is not a fast AI-visibility lever.
5.3 The reporting structure
The reporting structure should surface the compositional axes rather than hiding them in an aggregate.
At the top level, report five numbers per quarter: - Prompted mention rate (data-quality check) - Unprompted mention rate on Perplexity - Unprompted mention rate on Google AI Mode - Unprompted mention rate on ChatGPT - Weighted aggregate (with weights disclosed)
At the second level, break the unprompted rate by archetype for each engine. This surfaces whether recent gains are compositional (more recommendation prompts added to the panel) or real (mention rate up on a fixed panel).
At the third level, break the citation rate by source family for each engine. This surfaces whether your commercial program, list-inclusion program, or editorial program is driving movement.
At the fourth level, report your position within lists (average shortlist position when your brand appears), the specific top-cited domains in your prompt panel, and the trend in your persistence rate over time.
This structure produces about 20-25 numbers per quarter. That is a lot, but it is the minimum viable dashboard for AI visibility given the compositional variance the data reveals. A single aggregate mention rate reported without context is worse than useful because it invites over-interpretation and misallocated response.
5.4 Investment sequencing
For a B2B team starting an AI-visibility program in 2026, the investment sequence matters as much as the specific investments.
Sequence the first quarter around measurement infrastructure. Build the tracked prompt panel, set up per-engine monitoring, establish baselines, and disclose the panel composition. This produces the reference data you need to interpret every subsequent investment. Without it, you cannot tell whether a change is real or compositional.
Sequence the second quarter around commercial-content hygiene. Audit your owned website’s crawlability for AI bots, ensure your product pages are topically strong on your buyer queries, and complete your directory profiles on G2, Capterra, and category-specific listings. This is the highest-leverage single content investment, and it moves faster than the topical work in the following quarters.
Sequence the third quarter around list-inclusion. Identify the top comparison articles and category rankings that appear in your tracked prompt panel citations, and pursue placement or improvement in those specific pieces. This work compounds over time and produces the durable Perplexity and Google AI Mode visibility that commercial content cannot address on its own.
Sequence quarters four and beyond around editorial and topical authority. Industry publication mentions, category-explainer article contributions, and long-form thought-leadership content build the aggregate signal that Ahrefs’s 0.664 correlation captures. These investments do not move the AI dashboard in a single quarter, but they compound the earlier work into durable multi-engine visibility.
Avoid pouring quarterly budgets into Reddit, YouTube, and generic PR before the commercial and list programs are in place. The community-source transfer data does not support that investment as an early priority. Community investment matters at scale, over time, as a background layer rather than as a foreground driver.
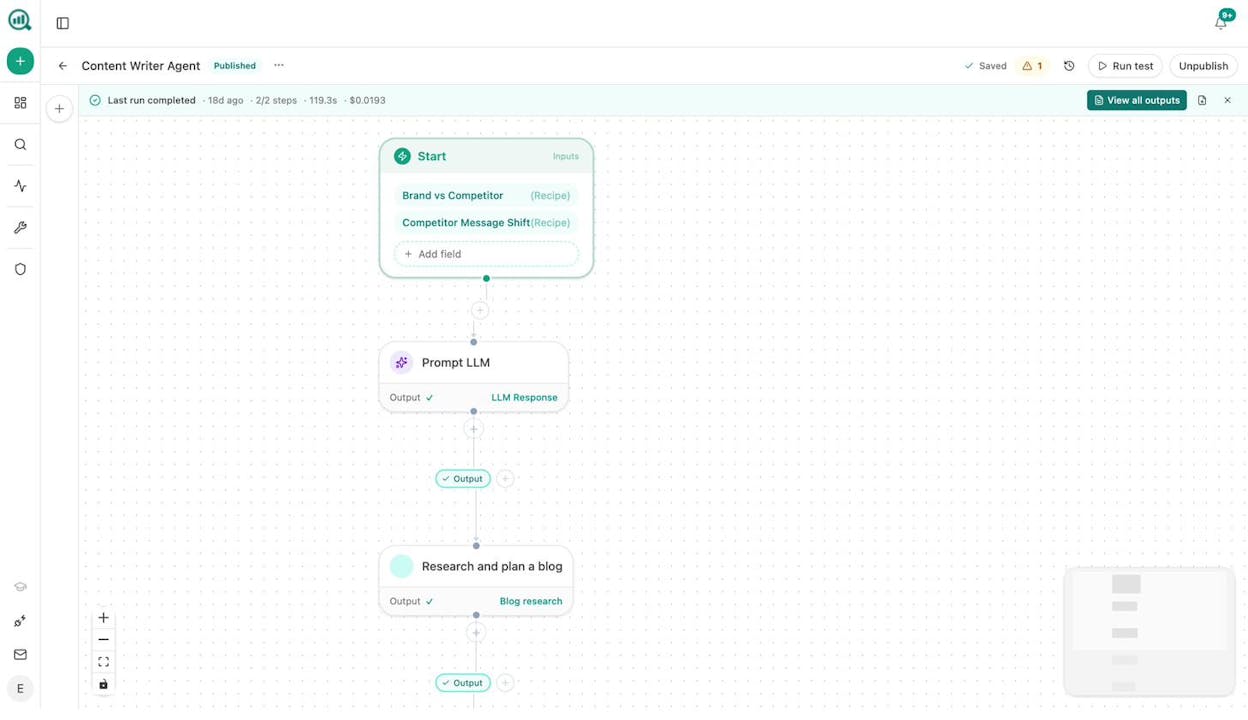
Agent workflow example showing per-source-family content routing
The bigger picture
The core reframe from this study is that AI search is not a single distribution channel. It is three structurally different products with different retrieval architectures, different source-family preferences, different mention-density behaviors, and different sensitivities to the prompt-panel composition a marketing team designs.
The teams that will win AI visibility in 2026 are the ones that build the measurement infrastructure to see the mechanism, split their content investment into per-engine portfolios that match how each engine actually retrieves, and report their numbers with enough compositional context that stakeholders can interpret them accurately.
The teams that will underperform are the ones that treat AI search as a single “AI channel” with a single mention-rate KPI. That framing hides most of the actionable variance in the data. It also fails to distinguish real visibility changes from compositional artifacts, which produces both false alarms (panel shifts read as performance drops) and false confidence (panel shifts read as performance gains).
Traditional SEO is not dead, and AI search is not a replacement for it. AI search is an additional organic channel that operates on top of the traditional search infrastructure, with its own mechanics and its own optimization levers. Many of the disciplines that make traditional SEO work (topical authority, extractable content structure, third-party citations, category expertise) also carry over to AI search. What has changed is the measurement layer and the per-engine portfolio design. Getting those two right is what separates the programs that move visibility from the ones that report on it.
Methodology
We tracked 460 B2B prompts across 37 organizations covering 11 category clusters, with continuous observation across ChatGPT, Perplexity, and Google AI Mode. All prompts were run at least once on each engine per observation window, and matched-day analyses use only observations where all three engines answered on the same UTC day. The dataset for this report covers 22,295 AI answers and 115,843 citation events collected over a twelve-month observation period ending in early 2026.
Prompts were classified into archetypes (Comparison and alternatives, Recommendation and shortlist, Research and how-to, Pricing and value, Other) and into structural feature categories (word count band, angle count, angle type, brand-in-prompt flag). Source citations were classified into five broad families (Brand websites and product pages, Lists and comparisons and reviews, Editorial and educational, Community and social, Directories and marketplaces) and into 25 detailed page types. All classifications used automated tagging with human review of edge cases.
Statistical models include: for the +60.4 pp brand-in-prompt effect, a cluster-robust logistic regression across all answers with controls for engine, prompt length, industry, and organization. For the -0.17 authority-citation correlation, a page-level Spearman correlation across 4,824 cited pages with valid Domain Rating scores. For the source-family transfer effects, unadjusted within-answer comparisons of mention rates with and without each family present in the citation list.
For readers who want to go deeper on any specific finding, the fifteen underlying research pieces are linked throughout this report. Each covers a single finding in ~2,500 words with its own sample transparency, public-studies reconciliation, and practical implications.
This research was conducted using Analyze AI, which tracks brand visibility, per-engine citation share, source-family mix, mention density, and prompt-panel composition across ChatGPT, Perplexity, Google AI Mode, and every other major AI engine. If you would like to run this same analysis on your own brand and category, start a free trial.

Ernest

Ibrahim
![Featured image for Brands Keep AI Answer Spots 83% of the Time [2026 Study]](/_next/image?url=https%3A%2F%2Fwww.datocms-assets.com%2F164164%2F1785857208-01-persistence.png&w=3840&q=75)

![Featured image for Google AI Mode Cites Sources in 97% of Answers [2026]](/_next/image?url=https%3A%2F%2Fwww.datocms-assets.com%2F164164%2F1785857495-02-citation-presence.png&w=3840&q=75)
![Featured image for AI Engines Rarely Name the Same Brands [2026 Study]](/_next/image?url=https%3A%2F%2Fwww.datocms-assets.com%2F164164%2F1785857601-03-cross-engine-consensus.png&w=3840&q=75)
![Featured image for B2B AI Mention Rates Range 9% to 70% by Category [2026]](/_next/image?url=https%3A%2F%2Fwww.datocms-assets.com%2F164164%2F1785857809-11-industry-variance.png&w=3840&q=75)
![Featured image for Prompt Design Shifts AI Mention Rate 60 Points [2026]](/_next/image?url=https%3A%2F%2Fwww.datocms-assets.com%2F164164%2F1785857842-13-prompt-construction.png&w=3840&q=75)
![Featured image for ChatGPT Pulls 69% of Citations from Brand Sites [2026]](/_next/image?url=https%3A%2F%2Fwww.datocms-assets.com%2F164164%2F1785857882-15-source-family-mix.png&w=3840&q=75)