

![Featured image for Top 10 Sites Cover Only 12% of AI Citations [2026 Study]](/_next/image?url=https%3A%2F%2Fwww.datocms-assets.com%2F164164%2F1785857692-05-top-domains.png&w=3840&q=75)

Summarize this blog post with:


We analyzed 22,295 AI answers across ChatGPT, Perplexity, and Google AI Mode to test the assumption behind every “top 10 sites AI cites” article on the internet. If we look at the citations B2B AI answers actually produce, what share of the citations do the top 10 domains cover, and what does the rest of the citation ecosystem look like?
The dataset covers 115,843 citation events, 460 distinct B2B prompts, and 37 tracked organizations. Each citation is one domain cited in one AI answer, deduplicated so that if the same domain appears twice in the same answer it counts once. That gives us a clean picture of the domain-level breadth of the citation ecosystem.
Here are the questions we set out to answer:
- How many unique domains do the three engines cite across a B2B tracked prompt panel?
- What share of citations do the top 10 domains cover on each engine?
- What share do the top 50 cover?
- Which domains have the broadest cross-brand reach in B2B AI answers?
- How does this shape a marketer’s earned-media strategy?
- Do the industry’s “top 10 sites AI cites” lists tell you what you need to know?
The citation ecosystem is much broader than the “top 10 sites AI cites” narrative suggests. We find 7,058 unique cited domains across the three engines. The top 10 domains on each engine cover only 11 to 13% of citations. The top 50 domains cover only 29 to 34%. Even a portfolio of the 50 broadest domains still leaves two thirds of the citation ecosystem uncovered. A marketer chasing the “top 10” list is optimizing for the smallest slice of the actual surface.
Table of Contents
TL;DR
- How many unique domains are cited? 7,058 across the three engines. Individually, ChatGPT cites 3,345 unique domains, Google AI Mode cites 3,571, and Perplexity cites 2,574.
- What share of citations do the top 10 domains cover? ChatGPT 12.2%. Perplexity 11.1%. Google AI Mode 13.1%. About 88% of citations sit outside the top 10 on every engine.
- What about the top 50? ChatGPT 29.2%. Perplexity 30.1%. Google AI Mode 34.0%. Even at 50 domains you cover only about a third of citations.
- Which domains have the broadest cross-brand reach? YouTube (cited about 21 tracked brands, 122 prompts, 1,224 answers), Reddit (21 brands, 112 prompts, 797 answers), Wikipedia (15 brands), Facebook (13), LinkedIn (12), G2 (12), Medium (12), Instagram (11), TechRadar (10), Zapier (10), Salesforce.com (9), Google.com (9).
- What is the shape of the ecosystem? Extremely long-tail. The Herfindahl-Hirschman concentration index for each engine sits around 0.003, which is a textbook definition of an unconcentrated market.
- What should marketers do about this? Build a portfolio of 30 to 50 target domains rather than chasing a top-10 list, and expect the portfolio composition to differ per engine.
The Top 10 Domains Cover Only 11 to 13% of Citations
We ranked the domains for each engine by how many distinct AI answers cited them, then measured what share of total citations the top 10 domains covered.
| Engine | Unique cited domains | Top 10 share | Top 50 share |
|---|---|---|---|
| ChatGPT | 3,345 | 12.2% | 29.2% |
| Google AI Mode | 3,571 | 13.1% | 34.0% |
| Perplexity | 2,574 | 11.1% | 30.1% |
Three numbers matter here. The unique cited-domain count on each engine sits between 2,574 and 3,571, and the total unique domains across all three engines is 7,058. That is much broader than a marketer would guess from reading industry coverage. The top 10 share on each engine is between 11.1% and 13.1%, so building your strategy around a top-10 target list means competing for one eighth of the citation surface. And the top 50 share stops at 29 to 34%, so even a bigger list still leaves the bulk of the ecosystem uncovered.
The concentration statistic tells the same story a different way. The Herfindahl-Hirschman Index (HHI) is a standard way economists measure market concentration. A monopoly is 1. A completely fragmented market approaches 0. Our per-engine HHIs sit around 0.003. That is the citation equivalent of hundreds of small players sharing the market with no dominant few. If AI citations were traded on a public market, regulators would call this the most competitive citation market they have ever seen.
The 12 Broadest Domains in B2B AI Citations
Some domains do stand out for reach, even if none of them dominates. We ranked domains by how many tracked B2B brands they were cited alongside, since a domain cited across many different brands has broader utility for a marketer than a domain cited only in one narrow context.
| Domain | Brands cited alongside | Prompts | Answers |
|---|---|---|---|
| youtube.com | 21 | 122 | 1,224 |
| reddit.com | 21 | 112 | 797 |
| en.wikipedia.org | 15 | 40 | 297 |
| facebook.com | 13 | 48 | 222 |
| linkedin.com | 12 | 55 | 702 |
| g2.com | 12 | 34 | 671 |
| medium.com | 12 | 27 | 138 |
| instagram.com | 11 | 67 | 363 |
| techradar.com | 10 | 33 | 489 |
| zapier.com | 10 | 28 | 392 |
| salesforce.com | 9 | 43 | 788 |
| google.com | 9 | 40 | 259 |
The list contains three groups. The first group is UGC and social platforms. YouTube and Reddit sit at the top with 21 brands each, and Facebook, LinkedIn, Instagram, and Medium also appear. These are places where third-party discussion about brands accumulates and where AI engines retrieve heavily. The second group is review and directory platforms. G2 appears with 12 brands, 34 prompts, and 671 answers, which is a strong ROI compared to its narrow topical footprint. Wikipedia appears with 15 brands and is the reference-material anchor. The third group is trade press and vendor domains. TechRadar and Zapier both appear across 10 brands. Salesforce.com appears across 9, mostly as a competitive reference in CRM-adjacent prompts.
The 12-domain list is longer than any “top 10” you will see published, and it still only covers a small fraction of the ecosystem. YouTube’s 1,224 answers is the largest single-domain citation count in our data, and it represents about 1% of the 115,843 citation events. The other 99% of citations sit outside YouTube, spread across roughly 7,000 more domains. That distribution is the practical shape of a marketer’s earned-media surface, and it looks nothing like the “top 10 sites” pitch decks describe.
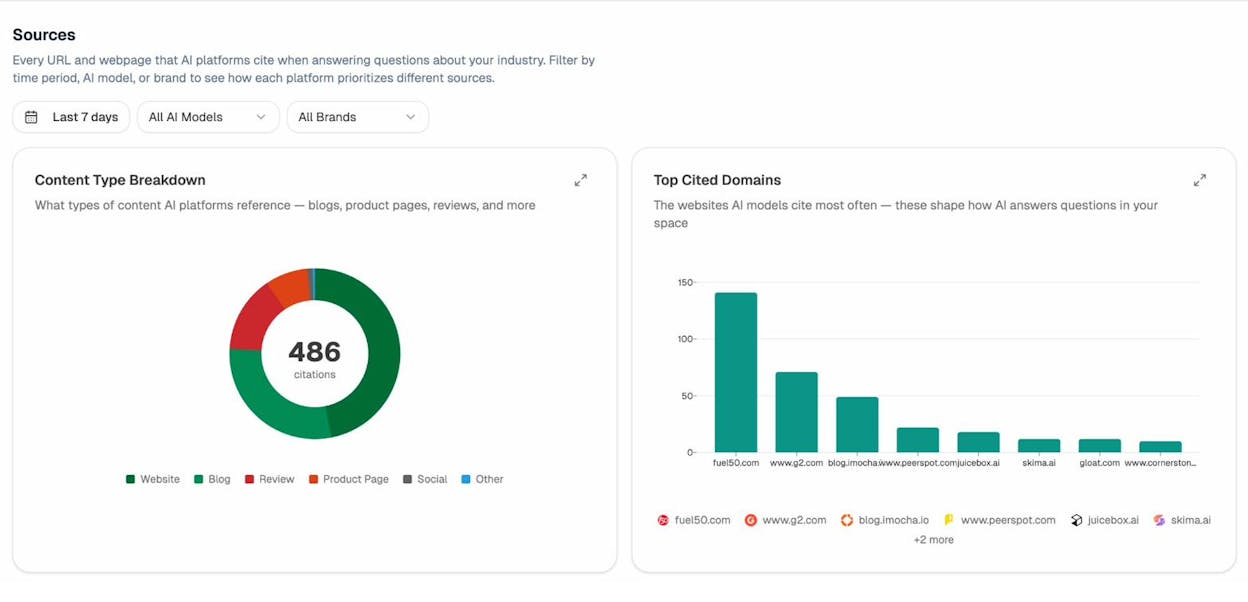
Sources dashboard showing the diversity of the cited-domain ecosystem, including content type breakdown and the top cited domains for a single tracked brand’s prompt panel
Even a Top-50 Portfolio Covers Only About One Third of Citations
The top-50 share on each engine sits between 29% and 34%. If you built a perfect earned-media portfolio covering the 50 most-cited domains on the engine you care about, you would still miss two thirds of the citation ecosystem. The remaining 66 to 71% of citations come from domains that do not appear on any top-50 list, and they cover the specific topical territories where mid-funnel and bottom-funnel buyers actually spend their query time.
The remaining 6,000-plus long-tail domains are not junk. They are the niche vertical sites, the smaller trade press, the industry-specific communities, the vendor documentation, and the aggregators that AI engines pull from when a query gets specific. A prompt about “best pipeline forecasting tool for enterprise sales teams” will not pull a citation from a top-10 list. It will pull from the vertical-specific review site, the vendor’s own documentation, and the LinkedIn post from an ops leader who wrote about their setup last quarter.
For a marketer, this reframes the target list. Instead of a fixed short list of 10 sites, the practical asset is a portfolio of 30 to 50 domains ranked by relevance to your specific tracked prompts. The Citation Analytics view surfaces this per-brand, per-engine, per-prompt view of the actual sources AI engines are citing on your specific prompts, so a marketer can build the portfolio from data rather than from a generic list published by an outside vendor.
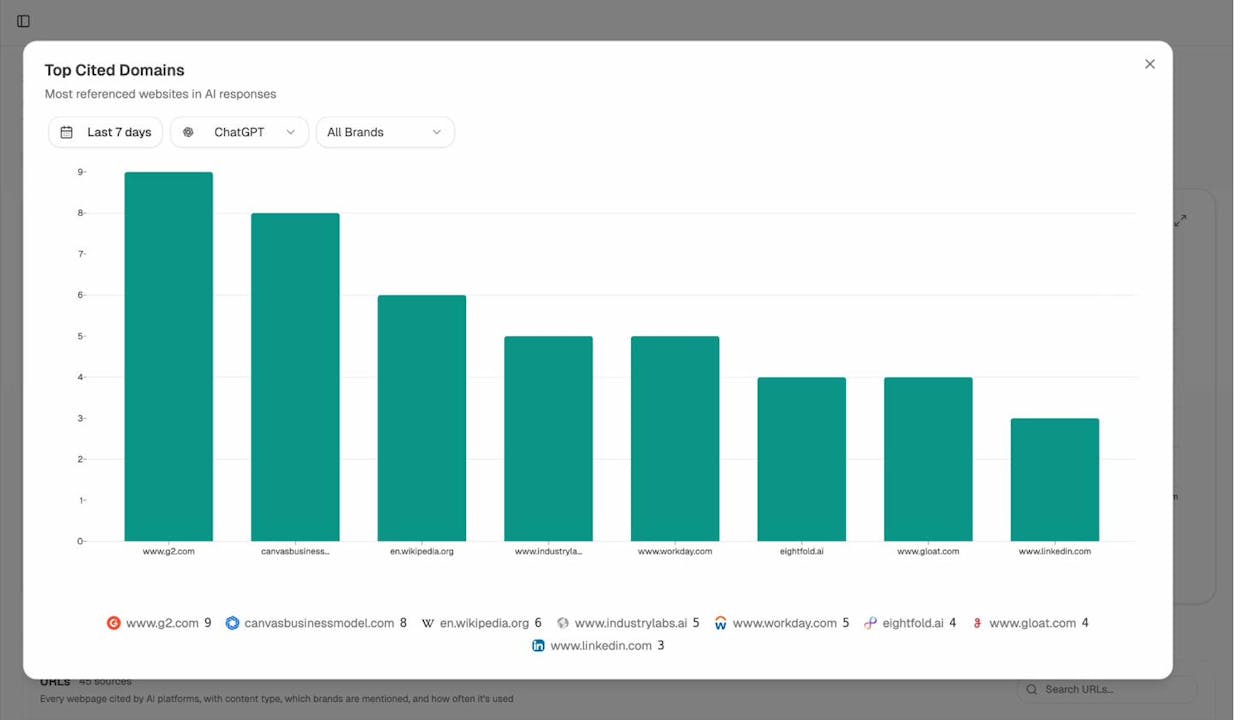
Top Cited Domains view filtered to one engine, showing the tail-heavy distribution of cited domains for a specific tracked brand’s prompt panel
How This Compares to Other Public Studies
The “which domains does AI cite most” question has been studied at large scale in the last twelve months, and the published headlines conflict wildly. Here is where our finding sits in that landscape.
Evertune analyzed 200 million prompts across five months and reported that “even the most-cited domain on any platform rarely exceeds 5 percent of total citations,” and that Wikipedia, Reddit, LinkedIn, and YouTube combined rarely tops 5%. The other 95% spreads across thousands of domains. That is essentially our finding at a much larger scale. Their 5% ceiling on the single most-cited domain and our 12% top-10 share are consistent with each other. A single-domain ceiling of 5% and a top-10 share of 12% implies exactly the long-tail shape we measured.
Peec AI analyzed 30 million sources across five AI engines and published a top-10 domain list ranked by direct citations. Reddit sat at the top on every engine. Peec’s contribution is a ranked list. Peec’s own reporting is careful about this, but the way marketers read it is to build a strategy around the top 10. Our finding says that even if you succeed on the entire Peec top-10 on your target engine, you have covered about one eighth of the actual citation surface.
5W Public Relations / Everything-PR published an AI Platform Citation Source Index synthesizing 680 million citations across five engines and reported that the top 15 domains absorb 68% of the AI answer pipeline, with Reddit at approximately 40%. That number sits at the opposite end of the range from ours and Evertune’s. The difference is query mix. Their 680 million citations include heavy consumer-query volume where Reddit is genuinely dominant. Our 115,843 citations are all B2B prompts where Reddit shows up 797 times, or roughly 0.7% of total citations. When a marketer reads “Reddit is 40% of AI citations” and thinks it applies to their B2B category, they are misreading a consumer-weighted finding as a universal one. In B2B specifically, the concentration is much lower.
Digital Applied analyzed 5,000+ queries across five AI surfaces and reported that AI answers typically pull from three to six domains per query. Our per-answer citation count in the citation-presence piece was 3.6 for ChatGPT, 5.3 for Google AI Mode, and 6.7 for Perplexity, which matches Digital Applied’s range. But the individual answer being narrow does not mean the ecosystem is concentrated. Each of the many thousands of individual answers pulls a narrow set, and those narrow sets differ across answers. The aggregate is fragmented even when each single answer is not.
The pattern across all four studies is consistent once you separate consumer from B2B and per-answer from aggregate. Consumer-heavy studies with aggregate citation share show high concentration (Reddit 40%). B2B or evenly weighted studies with per-answer domain measurement show extreme fragmentation (top 10 = 12%, HHI 0.003). If you are a B2B marketer, the 12% top-10 share is your number. The 40% top-15 number applies to a different measurement and a different audience.
What This Means for Content Strategy
Three things follow from the 12% top-10 share.
The first is that “get placed on the top 10 sites” is not the right pitch for a B2B AI-visibility program. The 88% of the ecosystem outside the top 10 is where most of the citation opportunity actually sits, and the top-10 list changes when you switch engines. A ChatGPT top-10 target list will look different from a Google AI Mode target list, because the domains those engines pull from partially overlap but never fully match, as we documented in our cross-engine consensus piece.
The second is that the practical asset is a per-engine, per-brand portfolio of the sources AI actually cites on your specific tracked prompts. Generic top-10 lists and top-50 lists do not do that job. What you want is a specific list generated from your own citation data. That list will typically contain 30 to 50 domains and will have a mix of UGC platforms, review sites, niche trade press, vendor documentation, and industry-specific communities. The Citation Analytics view surfaces this list per tracked brand, and the Sources dashboard shows the distribution over time so you can spot new entrants as they climb into your citation set.
The third is that the platforms with broad cross-brand reach are the highest-ROI first-move investments, but each has to be pursued with a specific tactic. YouTube’s 21-brand reach comes with a content-production cost. Reddit’s 21-brand reach comes with a community-participation cost. G2’s 12-brand reach comes with a review-generation cost. Wikipedia’s 15-brand reach comes with an editorial-gates cost. None of them are cheap. But if you have to prioritize the first three domains to invest in, the broadest-reach list is the right filter and the Listicle Outreach guide covers the practical playbook for the earned-media side.
The Bigger Story
The “top 10 sites AI cites” article is a genre now. Every SEO tool company has published one. Some of them are useful as reference material for understanding which platforms have broad reach. Most of them are misleading as strategy documents because they imply that placement on those 10 sites is where AI visibility comes from. In B2B, that implication does not hold. The 10 most-cited domains cover 12% of citations. The other 88% is where the strategy actually sits.
There are two reasons the industry keeps publishing these lists anyway. The first is that a ranked top-10 list is a shareable asset. It reads well as a LinkedIn carousel, it makes a clean chart in a webinar deck, and it converts to inbound traffic on the tool company’s blog. A 7,058-domain histogram does none of those things. The second is that vendors selling PR services benefit from a narrative that concentrates the target list. If the story is “get placed on these 10 sites,” the sales motion is clear. If the story is “build a portfolio of 30 to 50 domains that fits your specific tracked prompts and adjust it monthly,” the sales motion is much more work. The top-10 list is not necessarily wrong. It is just the version of the finding that fits a sales cycle better than the portfolio version does.
The right mental model here is the portfolio. A portfolio of 30 to 50 domains covers a much bigger share of citations, adapts as the ecosystem shifts, and reflects the specific prompts your buyers actually ask. A fixed target list of 10 domains does none of those things. Building the portfolio requires per-brand citation data, which is why we ship it as a core view rather than a secondary report.
This finding stacks with the other pieces in the State of AI Search series. Cross-engine consensus is rare, so the portfolio has to be per-engine. Within-engine positions are durable at 83%, so a portfolio investment compounds once won. Google AI Mode cites a source in 97% of answers, so it deserves the largest share of the portfolio budget when you are building the first version. Website authority does not predict citations at the page level, so the portfolio should not filter for DR alone. And the citation ecosystem itself is broad, so the portfolio should have 30 to 50 entries rather than 10.
The rest of this State of AI Search series unpacks the other structural patterns we found in the same dataset. Later pieces look at how the engines differ on YouTube and Reddit citations specifically, how cited-page sentiment relates to answer sentiment, and how mention density varies across the three engines.
The finding to hold onto from this piece is the simple one. The top 10 cited domains on each engine cover only 11 to 13% of citations. There are about 7,000 more. Build the portfolio around the specific prompts your buyers actually ask. Skip the generic top-10 list.
This research was conducted using Analyze AI, which tracks brand visibility, citation share, and per-domain citation performance across ChatGPT, Perplexity, Google AI Mode, and every other major AI engine.

Ernest

Ibrahim
![Featured image for The State of AI Search in B2B [2026]](/_next/image?url=https%3A%2F%2Fwww.datocms-assets.com%2F164164%2F1785857899-16-state-of-ai-search-b2b-2026.png&w=3840&q=75)

![Featured image for Domain Authority Does Not Predict AI Citations [2026 Study]](/_next/image?url=https%3A%2F%2Fwww.datocms-assets.com%2F164164%2F1785857675-04-authority.png&w=3840&q=75)
![Featured image for ChatGPT Pulls 69% of Citations from Brand Sites [2026]](/_next/image?url=https%3A%2F%2Fwww.datocms-assets.com%2F164164%2F1785857882-15-source-family-mix.png&w=3840&q=75)