
Which organic and AI-search metrics belong on an executive dashboard?
Short answer
Six metrics, no more: organic-attributed pipeline, revenue per intent bucket, brand mention rate split by AI surface, share of voice against three named competitors, citation share, and mention consistency. The test for whether a metric belongs is simple. If a CEO can't make a different decision because of the number, it belongs in your team's operating dashboard instead.
The two-minute test every metric has to pass
An executive dashboard exists so a CEO or CFO can answer three questions in under two minutes. Are we winning or losing, where, and what should change.
Run each metric you're considering through one question: if this number doubled or halved, would leadership do something different? Keyword rankings fail that test because the response is "tell the SEO team." Organic-attributed pipeline passes because the response is a budget decision.
That test is why most SEO dashboards fail. They mix operating metrics like crawl errors and backlink counts with outcome metrics, and the mix turns a 90-second scan into a 20-minute session nobody has time for.
The six that pass
Organic-attributed pipeline. Total pipeline value with organic first-touch, plotted monthly, in dollars. This sits at the top because it's the number the rest of the dashboard explains. See How do I measure organic-influenced pipeline without claiming false precision?.
Revenue per intent bucket. Bottom-funnel commercial, comparison, product-adjacent, top-funnel educational. This is what tells leadership which content type compounds and which produces traffic without pipeline.
Brand mention rate by AI surface. Split by ChatGPT, Perplexity, and Google AI Mode, never blended, because the three behave differently enough that one number hides the decision.
According to our own state of AI search research, analysing over 22,000 answers:
| Surface | Brand mention rate | Citation presence | Avg. citations per answer |
|---|---|---|---|
| ChatGPT | 32.3% | 68.3% | 3.60 |
| Google AI Mode | 33.7% | 97.4% | 5.33 |
| Perplexity | 41.7% | 93.2% | 6.71 |
Perplexity mentions brands 9.4 percentage points more often than ChatGPT on the same prompt-day. Blend those into one "AI visibility: 36%" and you've deleted a channel-prioritisation decision your CEO could have made.
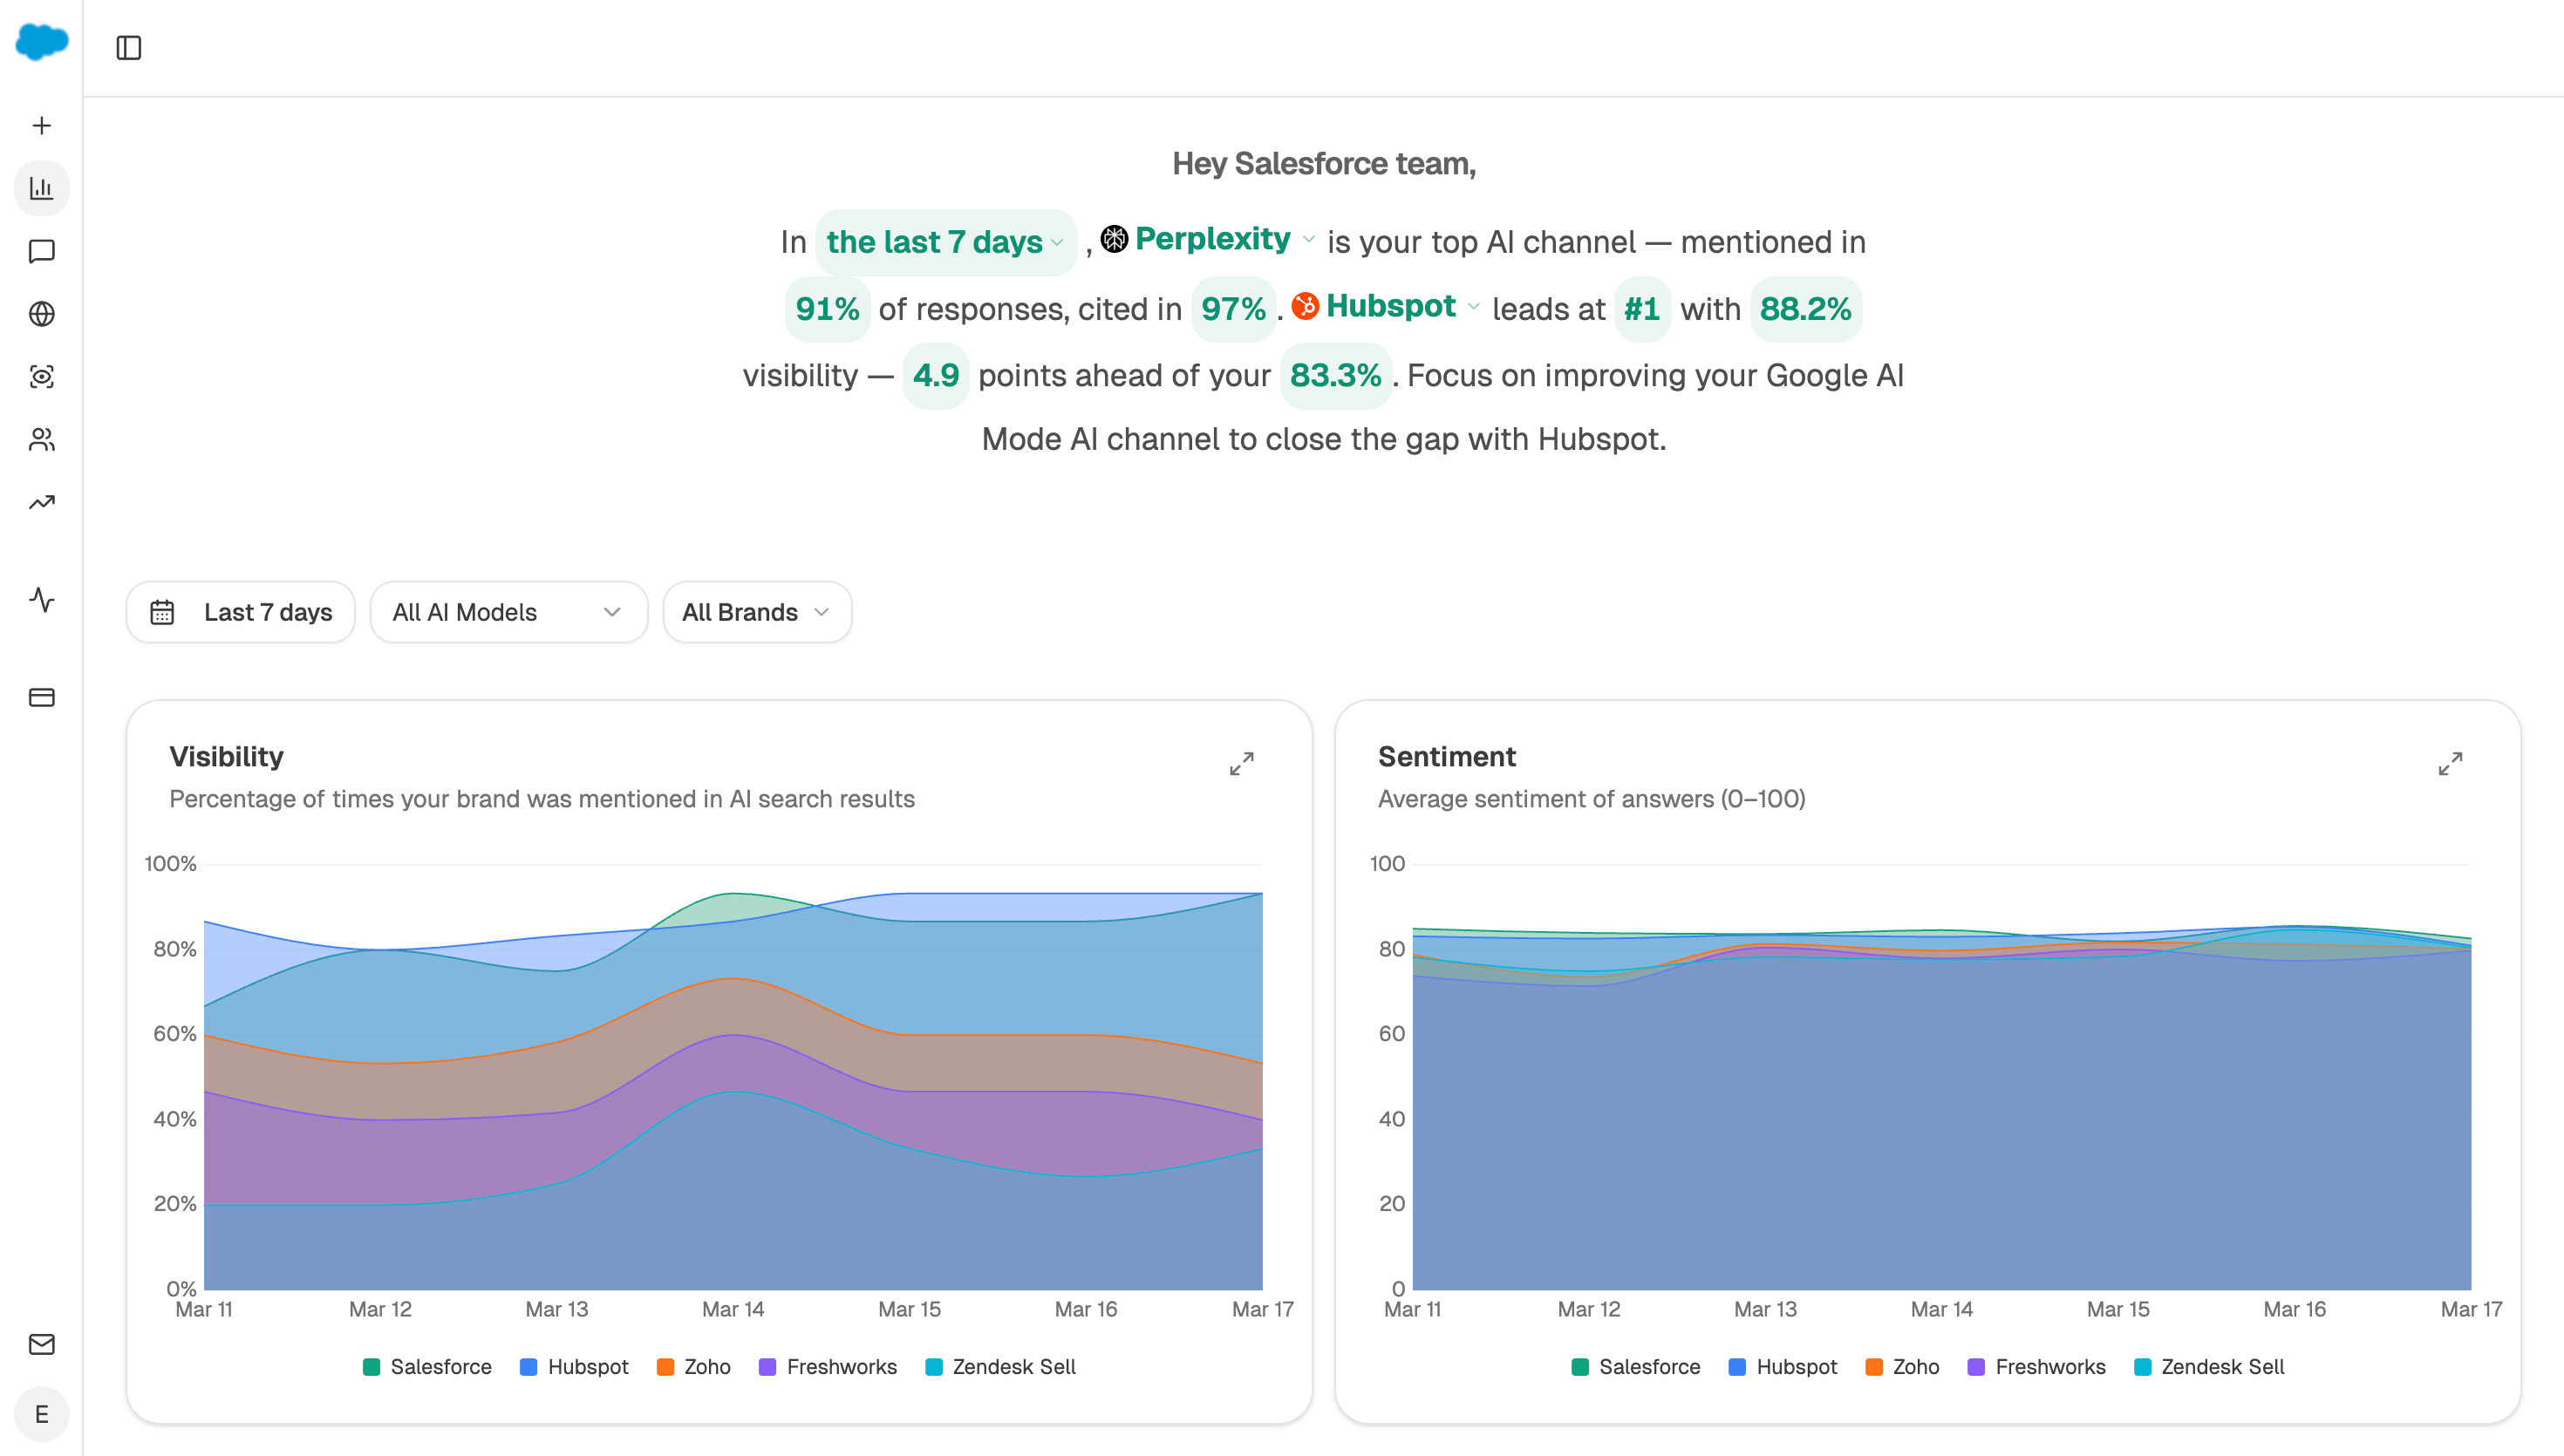
Share of voice against three named competitors. Not a floating percentage. Share of voice on a specific prompt set against three specific rivals, updated weekly. Naming the competitors is what turns a data point into a strategy conversation. See How to Compare Your AI Visibility Against Your Competitors.
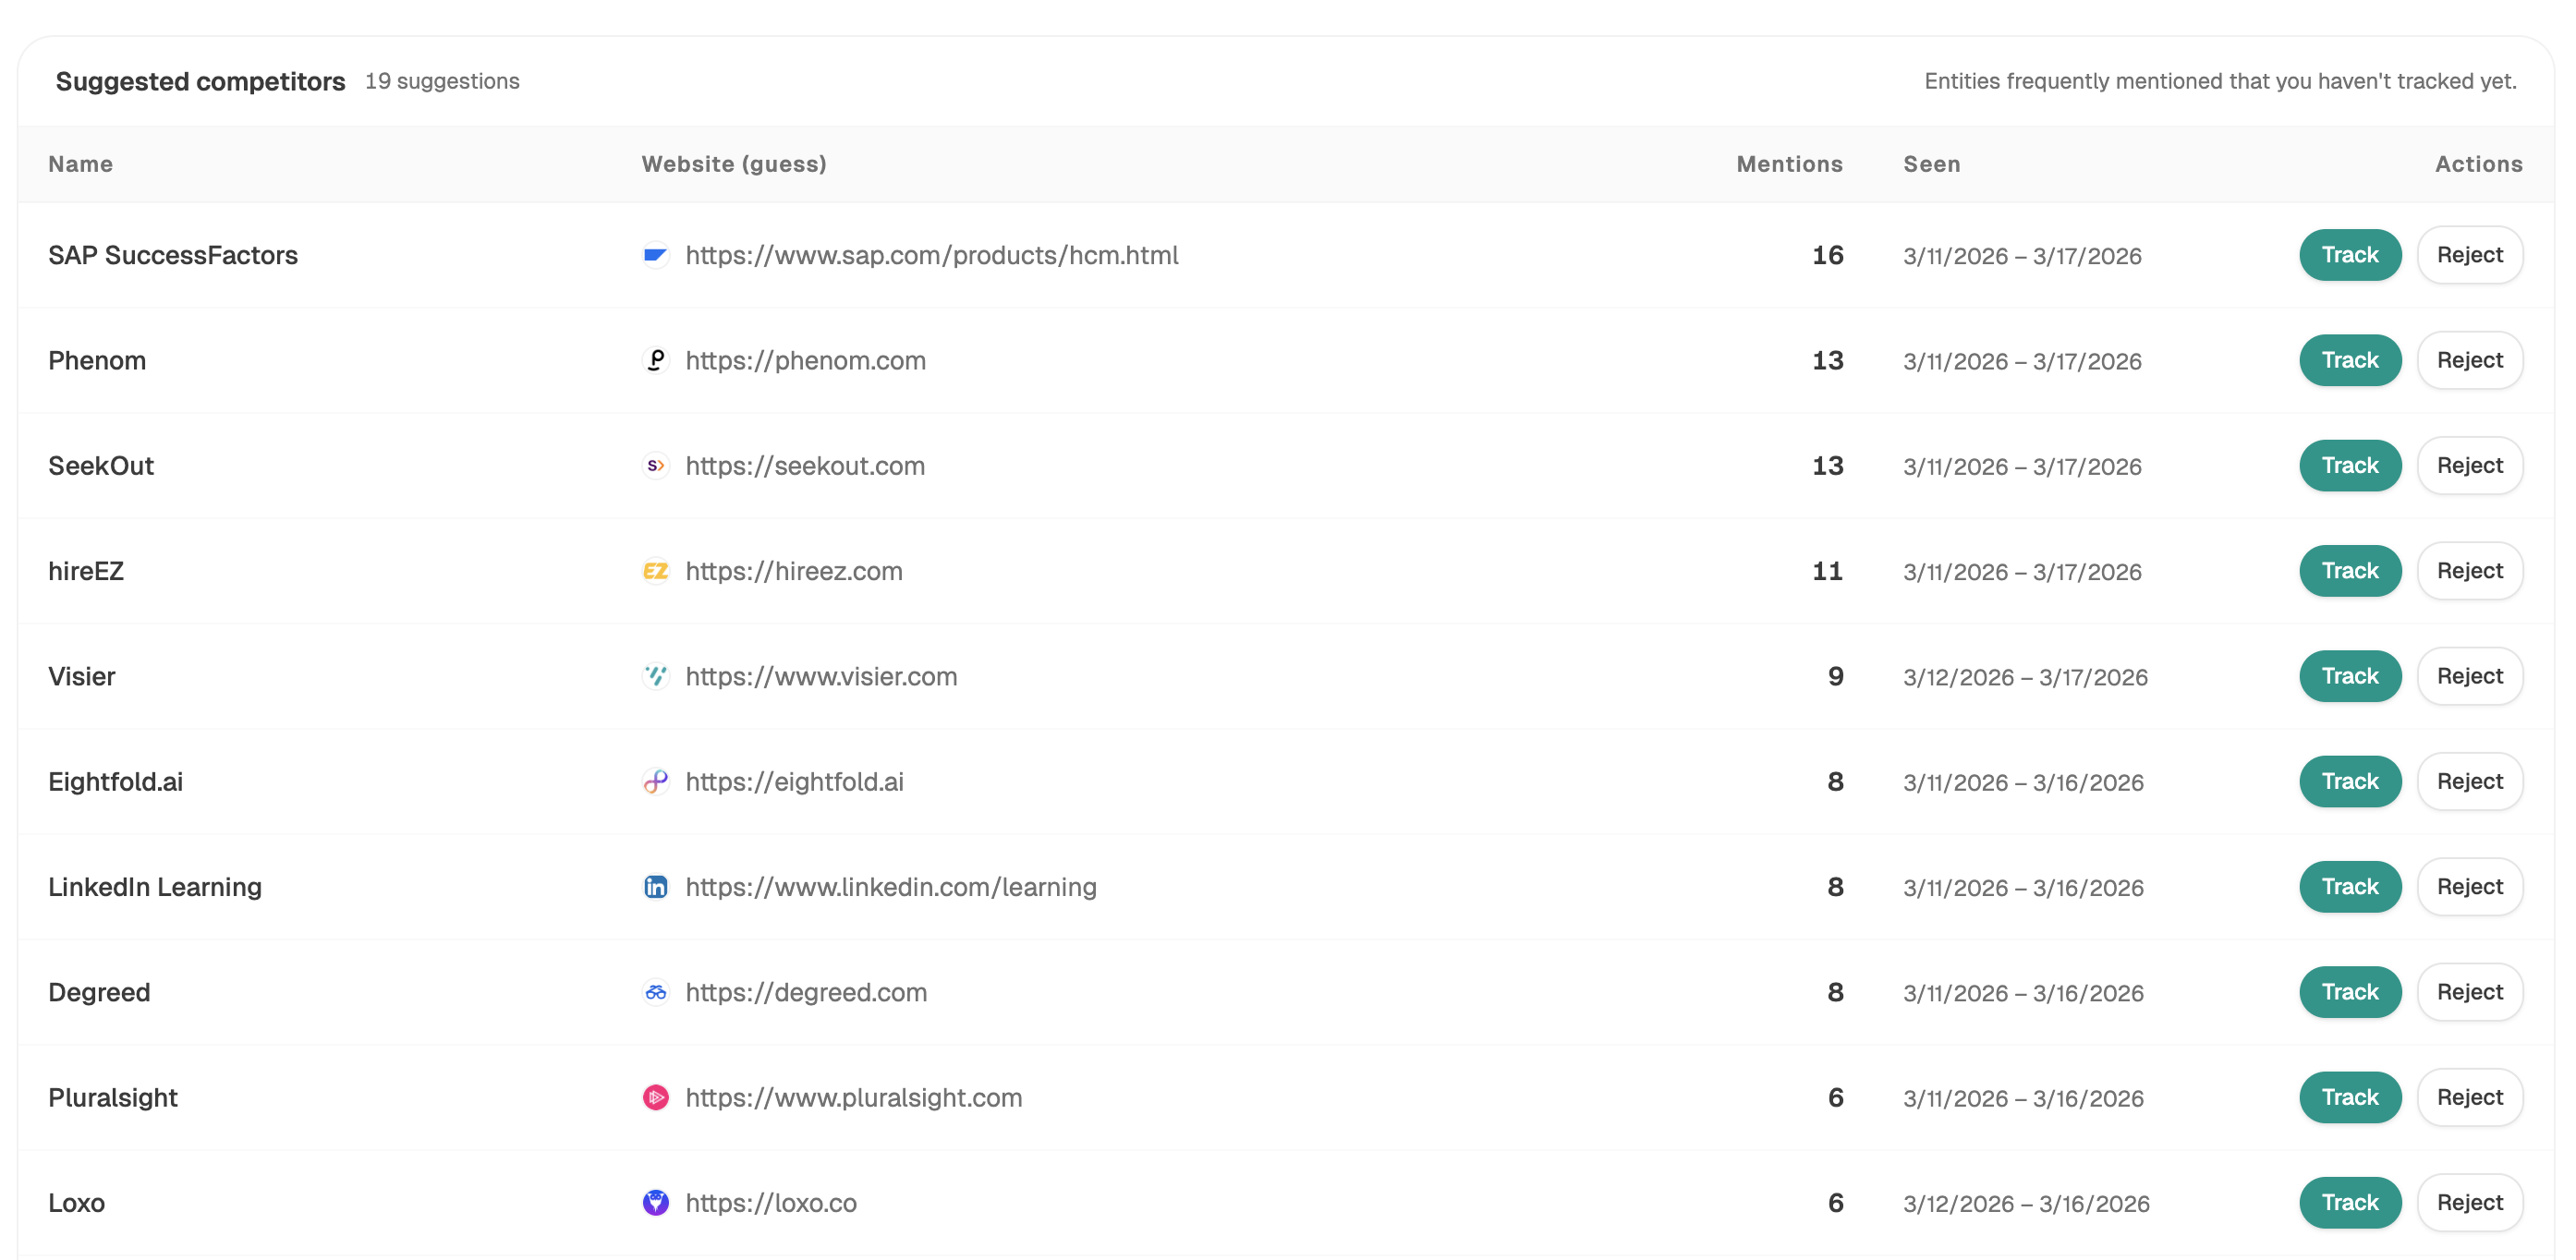
Citation share. The percentage of AI citations across tracked prompts linking to your domain. Different from mention rate, because a model can cite you without naming you. High citation share plus flat mention rate means you're being used as a source without credit, which is a fixable content problem rather than a positioning one.
Mention consistency. The metric nobody reports and every executive should see. Once your brand appears in an AI answer for a prompt, how likely is it to appear next time?
Our research found next-observation mention probability is 83.2% on ChatGPT after a mention versus 9.9% after a miss, with the same pattern on Google AI Mode (84.2% vs 11.5%) and Perplexity (83.3% vs 12.1%). AI visibility is sticky in both directions, which changes how you resource the work. Breaking in once compounds. Missing once persists. Because presence is lumpy rather than smooth, researchers argue visibility should be measured as a distribution across runs, prompts, and time rather than as one snapshot, so report a monthly average with its range rather than a single weekly reading.
What gets cut, and why executives don't miss it
Keyword rankings for individual queries, domain rating, backlink counts, raw traffic without a revenue tie, impressions. Every one of these fails the two-minute test because no executive changes a decision based on them.
They still matter to your team, so keep them in the operating dashboard. If a CEO wants a specific keyword rank, they can ask. See 10 SEO Metrics That Actually Matter (And 4 That Don't) for the team-level list.
The layout that gets read
Three rows, six numbers, and a plain-English note at the top explaining the biggest change since last month.
Top row carries pipeline and revenue per bucket with month-over-month deltas. Middle row shows mention rate per surface and share of voice. Bottom row shows citation share and mention consistency.
The note at the top is the piece most teams skip and the piece that makes the dashboard readable by people outside marketing. Without it, executives interpret the numbers themselves and usually interpret them wrong.
Automate it in Analyze AI
Each of the six metrics maps to a native node, which is what makes a weekly cadence realistic rather than aspirational.
Visibility Score returns the percentage of prompt results mentioning your brand per provider, with totals and a daily trend. Citation Share returns the percentage of citations pointing to your domain versus competitors. Sentiment Score returns average sentiment across results, which matters because being mentioned badly is a different situation from not being mentioned. Get Perception Quadrant positions every tracked brand on presence against narrative strength and returns takeaway copy, which for an executive audience often communicates more than the numbers do.
The weekly report agent:
Start (schedule, Monday 7am) → Visibility Score (per provider) → Citation Share → Sentiment Score → Get Perception Quadrant → Get Visibility Events → brand-vs-competitor recipe (three named rivals) → GA4 AI Traffic Overview → HubSpot Get CRM Objects → workflow-memory (last three runs) → exec-one-pager recipe → Prompt LLM (write the commentary, flagging whether each metric moved beyond its normal observed range) → DOCX export → Send Email to leadership.
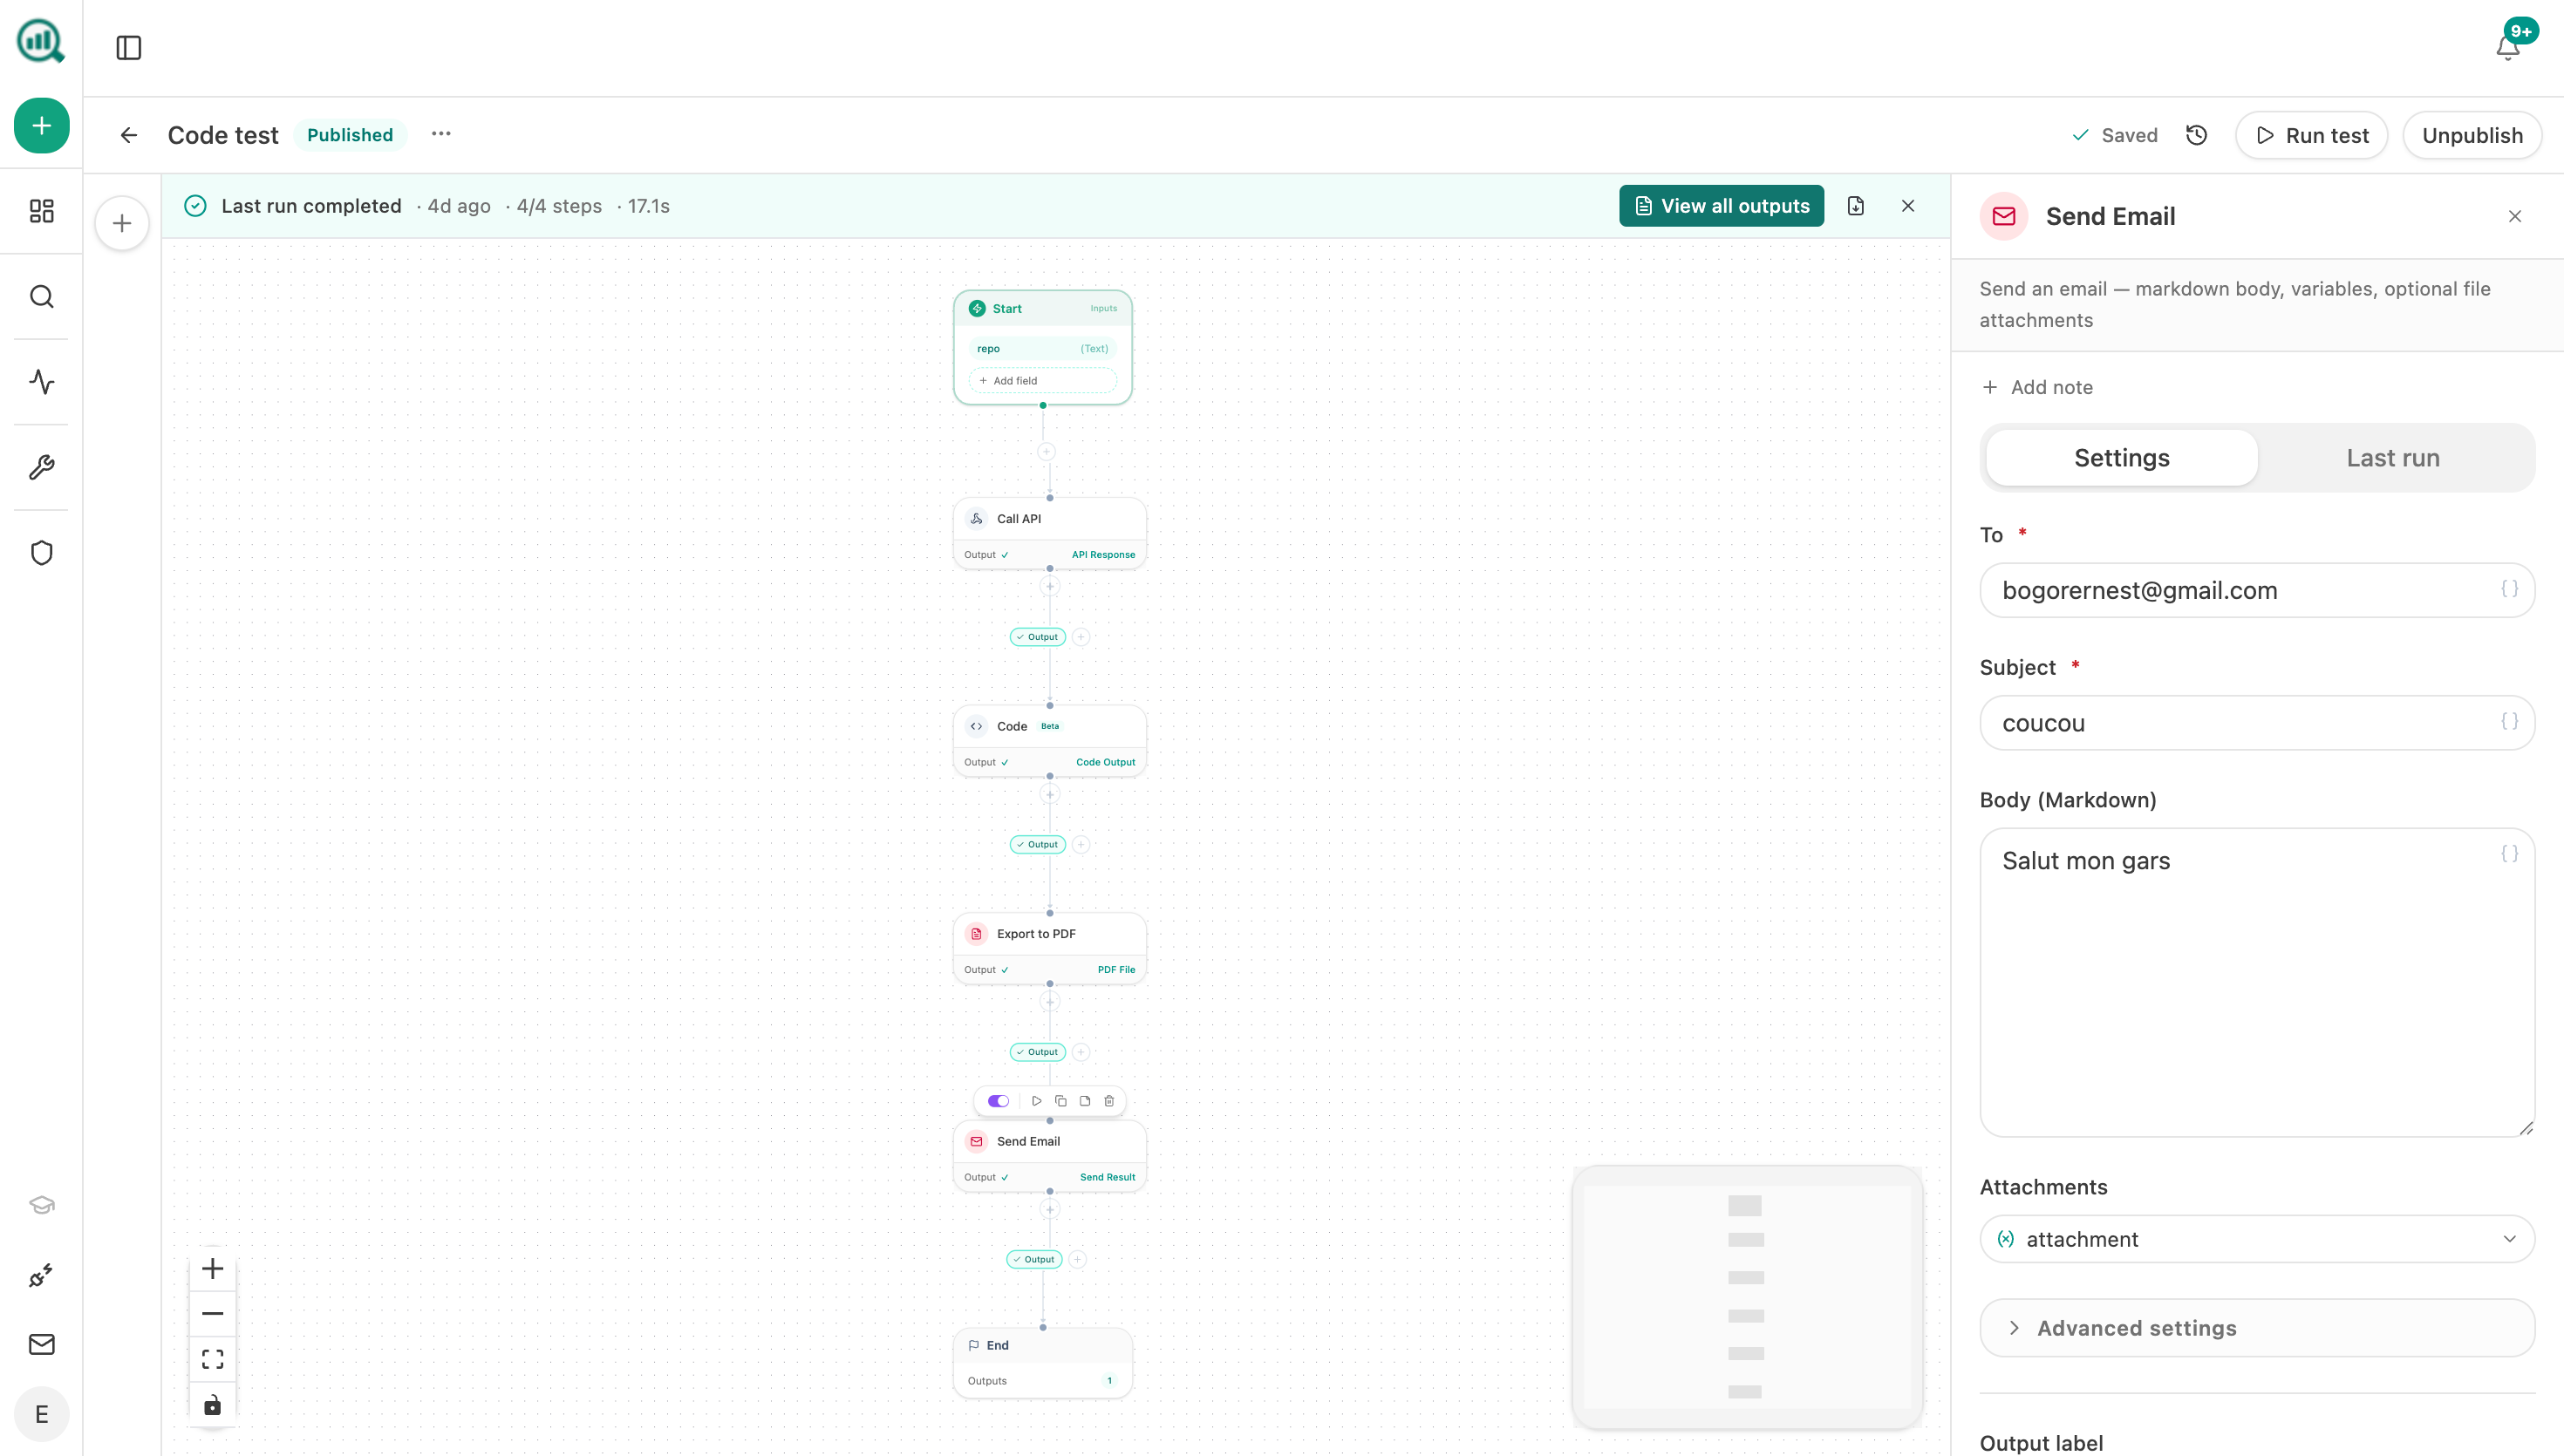
workflow-memory is what lets the commentary say "this moved beyond normal variance" rather than just reporting a number, and that distinction is the difference between a dashboard people act on and one they skim.
FAQ
Related answers
- How do I prove SEO is generating revenue and not just traffic?
- How do I put a number on "AI visibility" for a monthly report?
Want an executive-ready AI-search dashboard by the end of the week? Start a free Analyze AI trial and connect your GA4, GSC, and CRM in one afternoon.