
Which pages produce qualified opportunities rather than just form fills?
Short answer
Rank pages by the share of their leads that turned into real opportunities, not by how many forms they collected. The order usually inverts. Your biggest lead source is often a free tool or a popular guide with a low acceptance rate, while a quiet comparison page produces a handful of leads that sales take every time.
Build the ranking
You need one export from your CRM and one from analytics.
- Pull every lead from the last 12 months with the page they first landed on and the page they converted on.
- Add whether each became an opportunity, and the deal value if it closed.
- Group by conversion page.
- For each page, work out leads, opportunities, the share that converted, and total value.
- Sort by opportunity share, then look at total value.
Here is what it usually looks like.
| Page | Leads | Opportunities | Share | Value |
|---|---|---|---|---|
| Free ROI calculator | 412 | 21 | 5% | $84,000 |
| "What is attribution" guide | 288 | 12 | 4% | $41,000 |
| Comparison against a competitor | 47 | 19 | 40% | $312,000 |
| Integration setup page | 61 | 17 | 28% | $196,000 |
| Pricing page | 39 | 16 | 41% | $224,000 |
The calculator produces nine times the leads of the comparison page and less than a third of the value. Ranked by leads it is your best page. Ranked by what it produces it is close to your worst.
Use both columns, not just the share
A high share on its own is misleading. A page with three leads and two opportunities scores 67% and tells you nothing.
So read the table with two rules. Ignore any page with fewer than about 30 leads, because the share will swing wildly. And judge the rest on total value rather than share alone, because a page with a 15% share and 200 leads can beat a page with a 40% share and 40 leads.
What you are looking for is the page that scores well on both, and the page that scores terribly on share while dominating your lead count. The first is what to build more of. The second is what to stop celebrating in your monthly report.
Separate the page that converted from the page that convinced
One important caveat. The page someone filled a form on is rarely the page that persuaded them.
Most people convert on a pricing page or a demo form, which means those pages absorb credit earned elsewhere. That is why the table above should be built twice, once on the conversion page and once on the first page they ever landed on.
Comparing the two lists tells you which pages open relationships and which close them. Both matter, and confusing them leads teams to stop writing the content that fills the top of the funnel. How do I separate first-touch, assisted, and last-touch organic revenue covers doing this properly, and how should I value content that influences a deal but doesn't create the lead covers the credit question.
Decide what to do with the popular, unqualified page
The calculator in that table is not a mistake, and deleting it would be. It has three legitimate jobs even at a 5% share.
It earns links and citations, which lifts everything else. It gets you into consideration early. And it feeds your list with people who may buy in two years.
What it should not do is set your content strategy. When a team sees a page producing 400 leads a month, the natural response is to build four more like it, and that is how a library fills up with high-traffic pages that never produce anything. Judge it as reach, budget it as reach, and keep your buying pages funded separately.
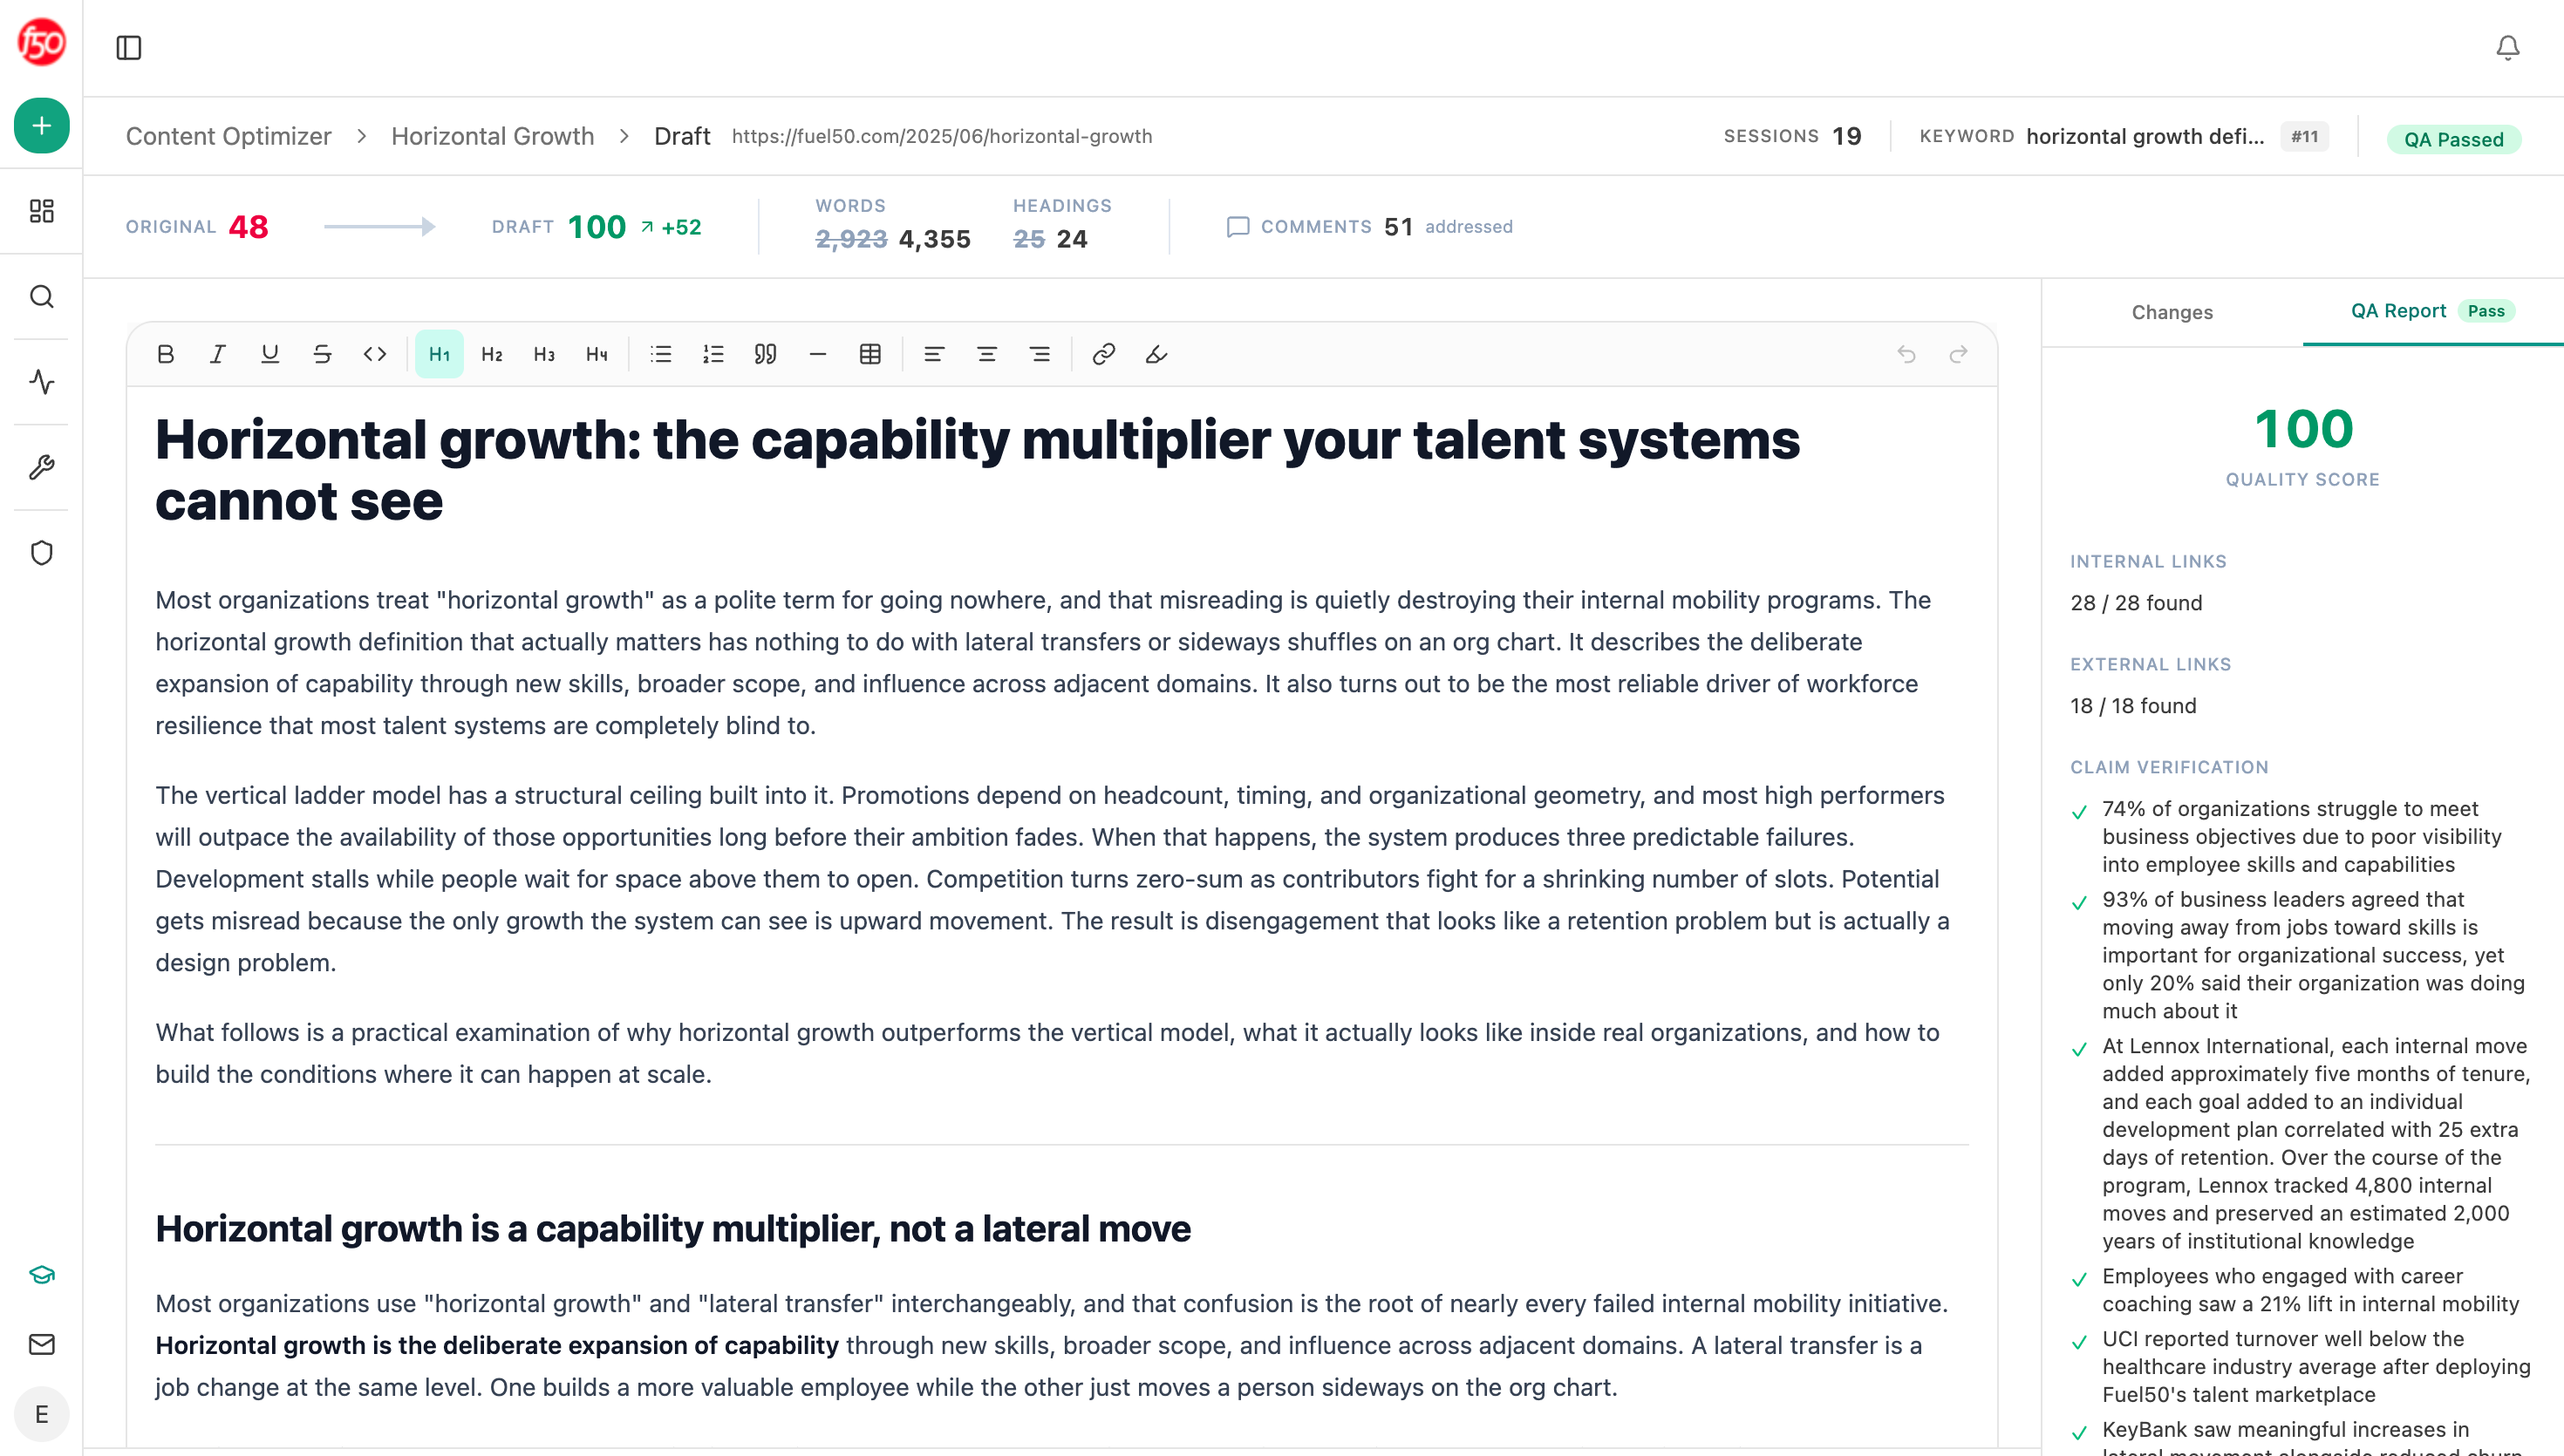 The optimizer returns a rewritten page, which tells you whether a high-traffic page can be repointed or whether the audience is simply wrong.
Check the pages assistants are using
There is a second ranking worth building, because some of your best pages never collect a form at all.
In our own state of AI search research, we counted 115,843 citations across 22,295 answers, spread over 7,055 different sites. Page authority barely predicted whether a page got cited, across the 4,824 pages we checked, so the pages assistants lean on are often not the ones you would expect.
Analyze AI's Citation Pages view lists which of your pages assistants actually pull from, and citation-magnets ranks the ones they return to most. Put that list next to your opportunity ranking. A page with few leads and heavy citation is doing work your CRM cannot see, and it should be kept and updated rather than pruned.
Be careful what you claim from it though. Being cited is not a visit and not a lead, and we do not publish click figures because we do not have them. Treat one check as weak evidence too, since researchers argue visibility should be read as a spread rather than a single snapshot.
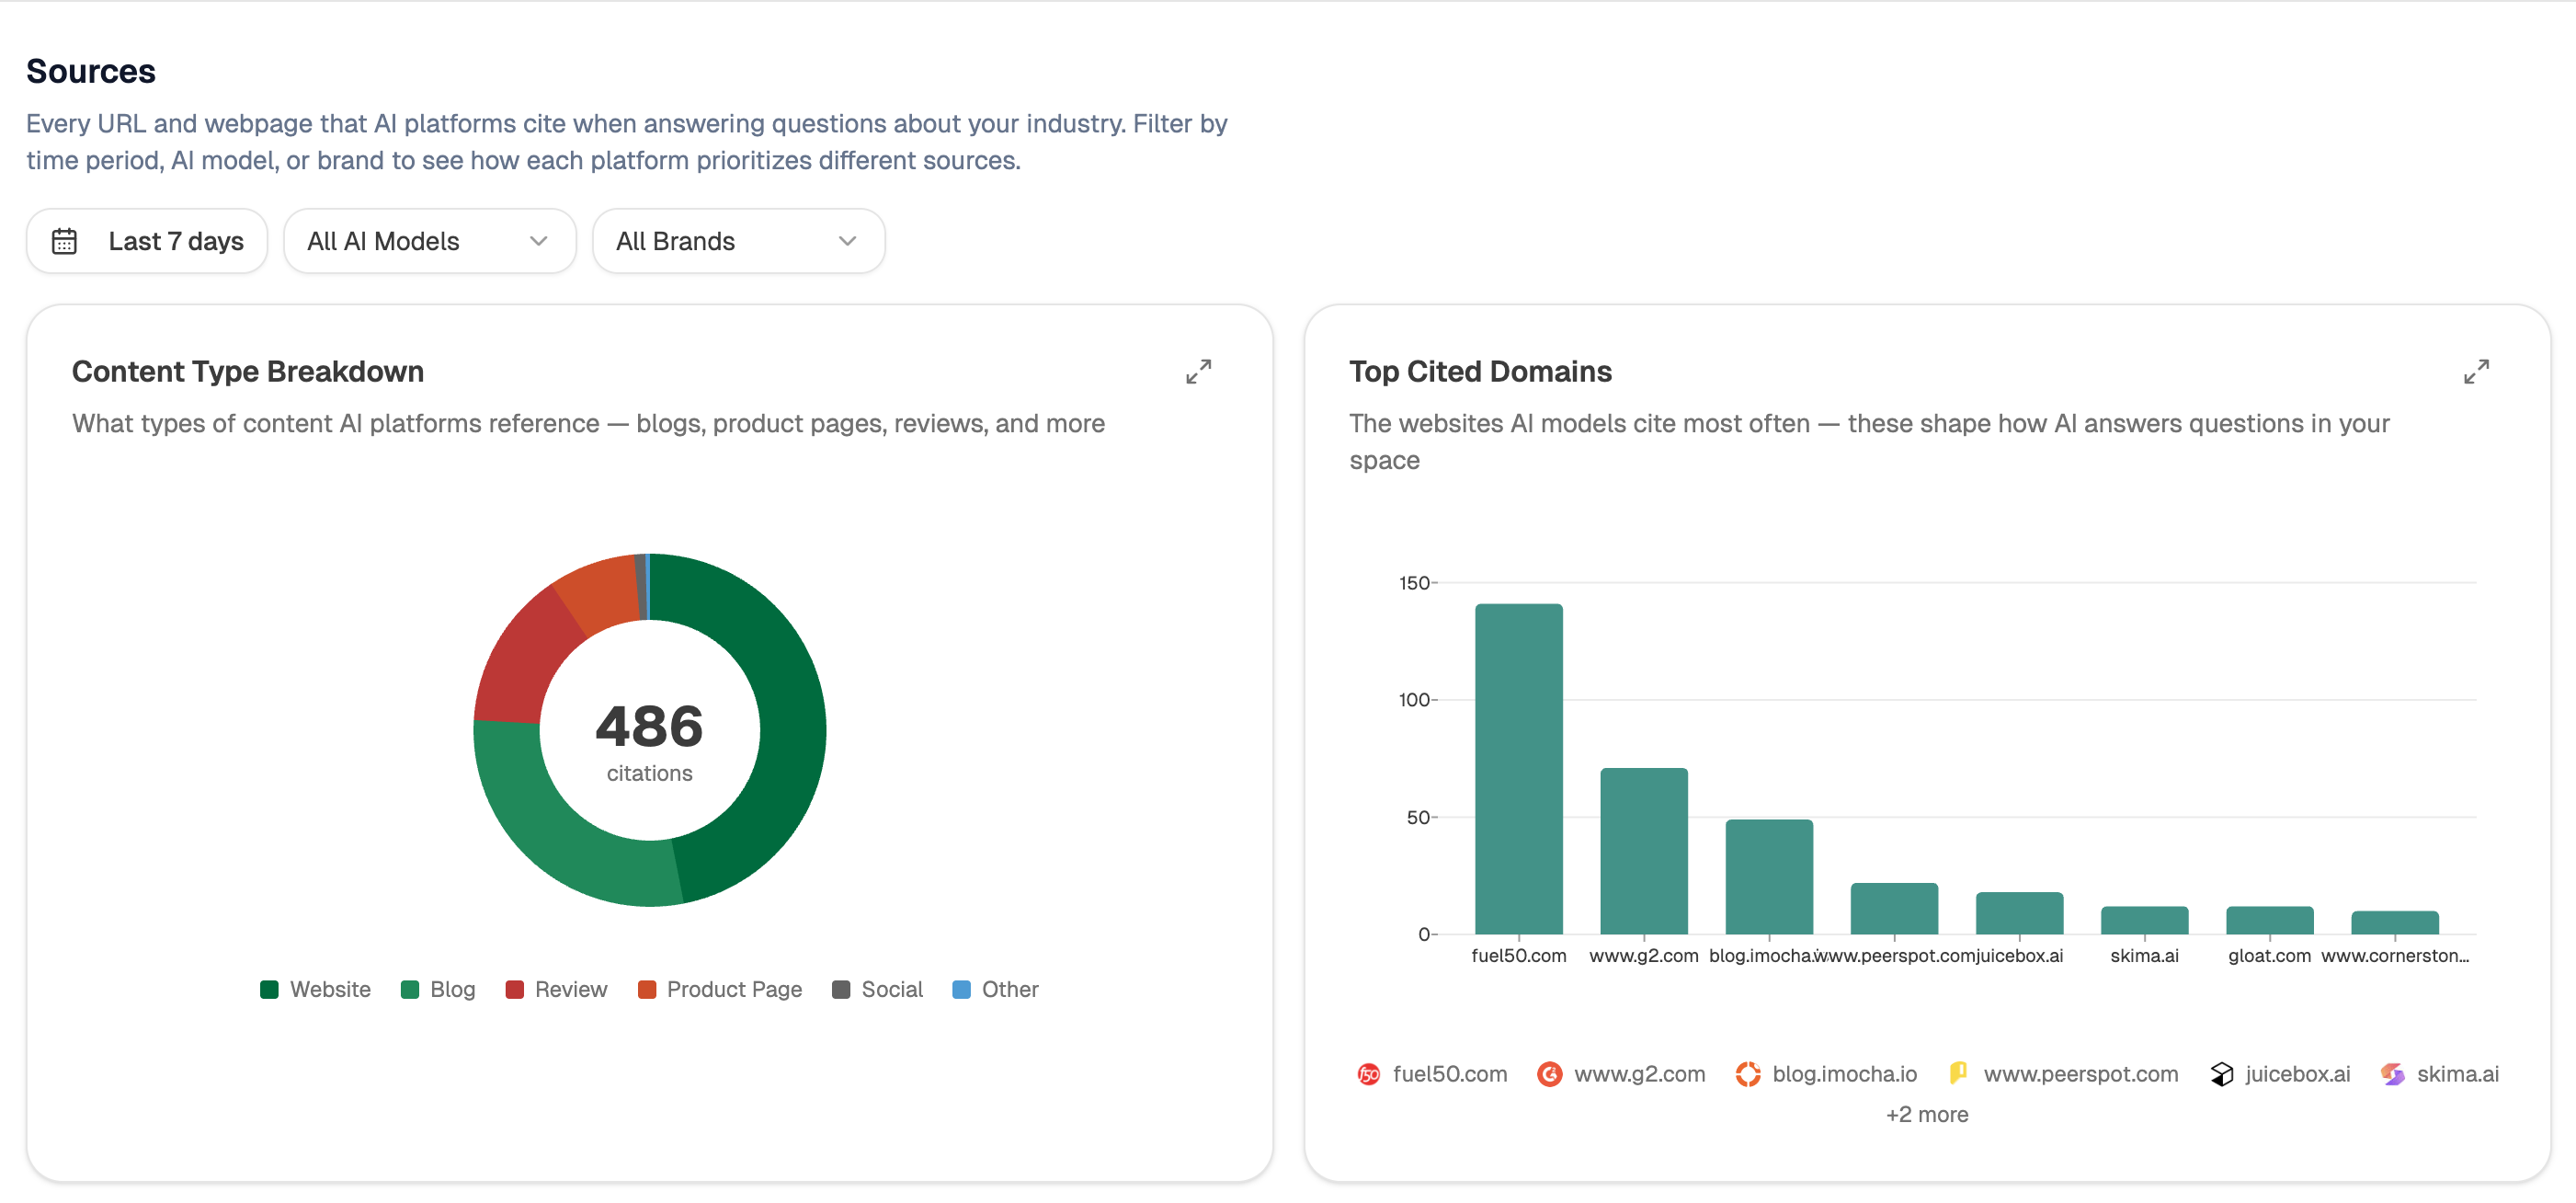 Sources lists the pages assistants pull from, which is the second ranking to read next to your CRM one.
Rebuild the ranking every month
Start (schedule, monthly) → HubSpot Search Contacts for leads with first and converting page → HubSpot Search Deals for outcomes and values → GA4 Page Breakdown for visits per page → Citation Pages for the pages assistants use → Code node building both rankings and dropping pages under 30 leads → Export Excel with the two lists side by side.
Producing both lists in one run is the part to copy. Teams that build only the CRM ranking eventually delete their most-cited pages, because those pages look like dead weight in every report they have.
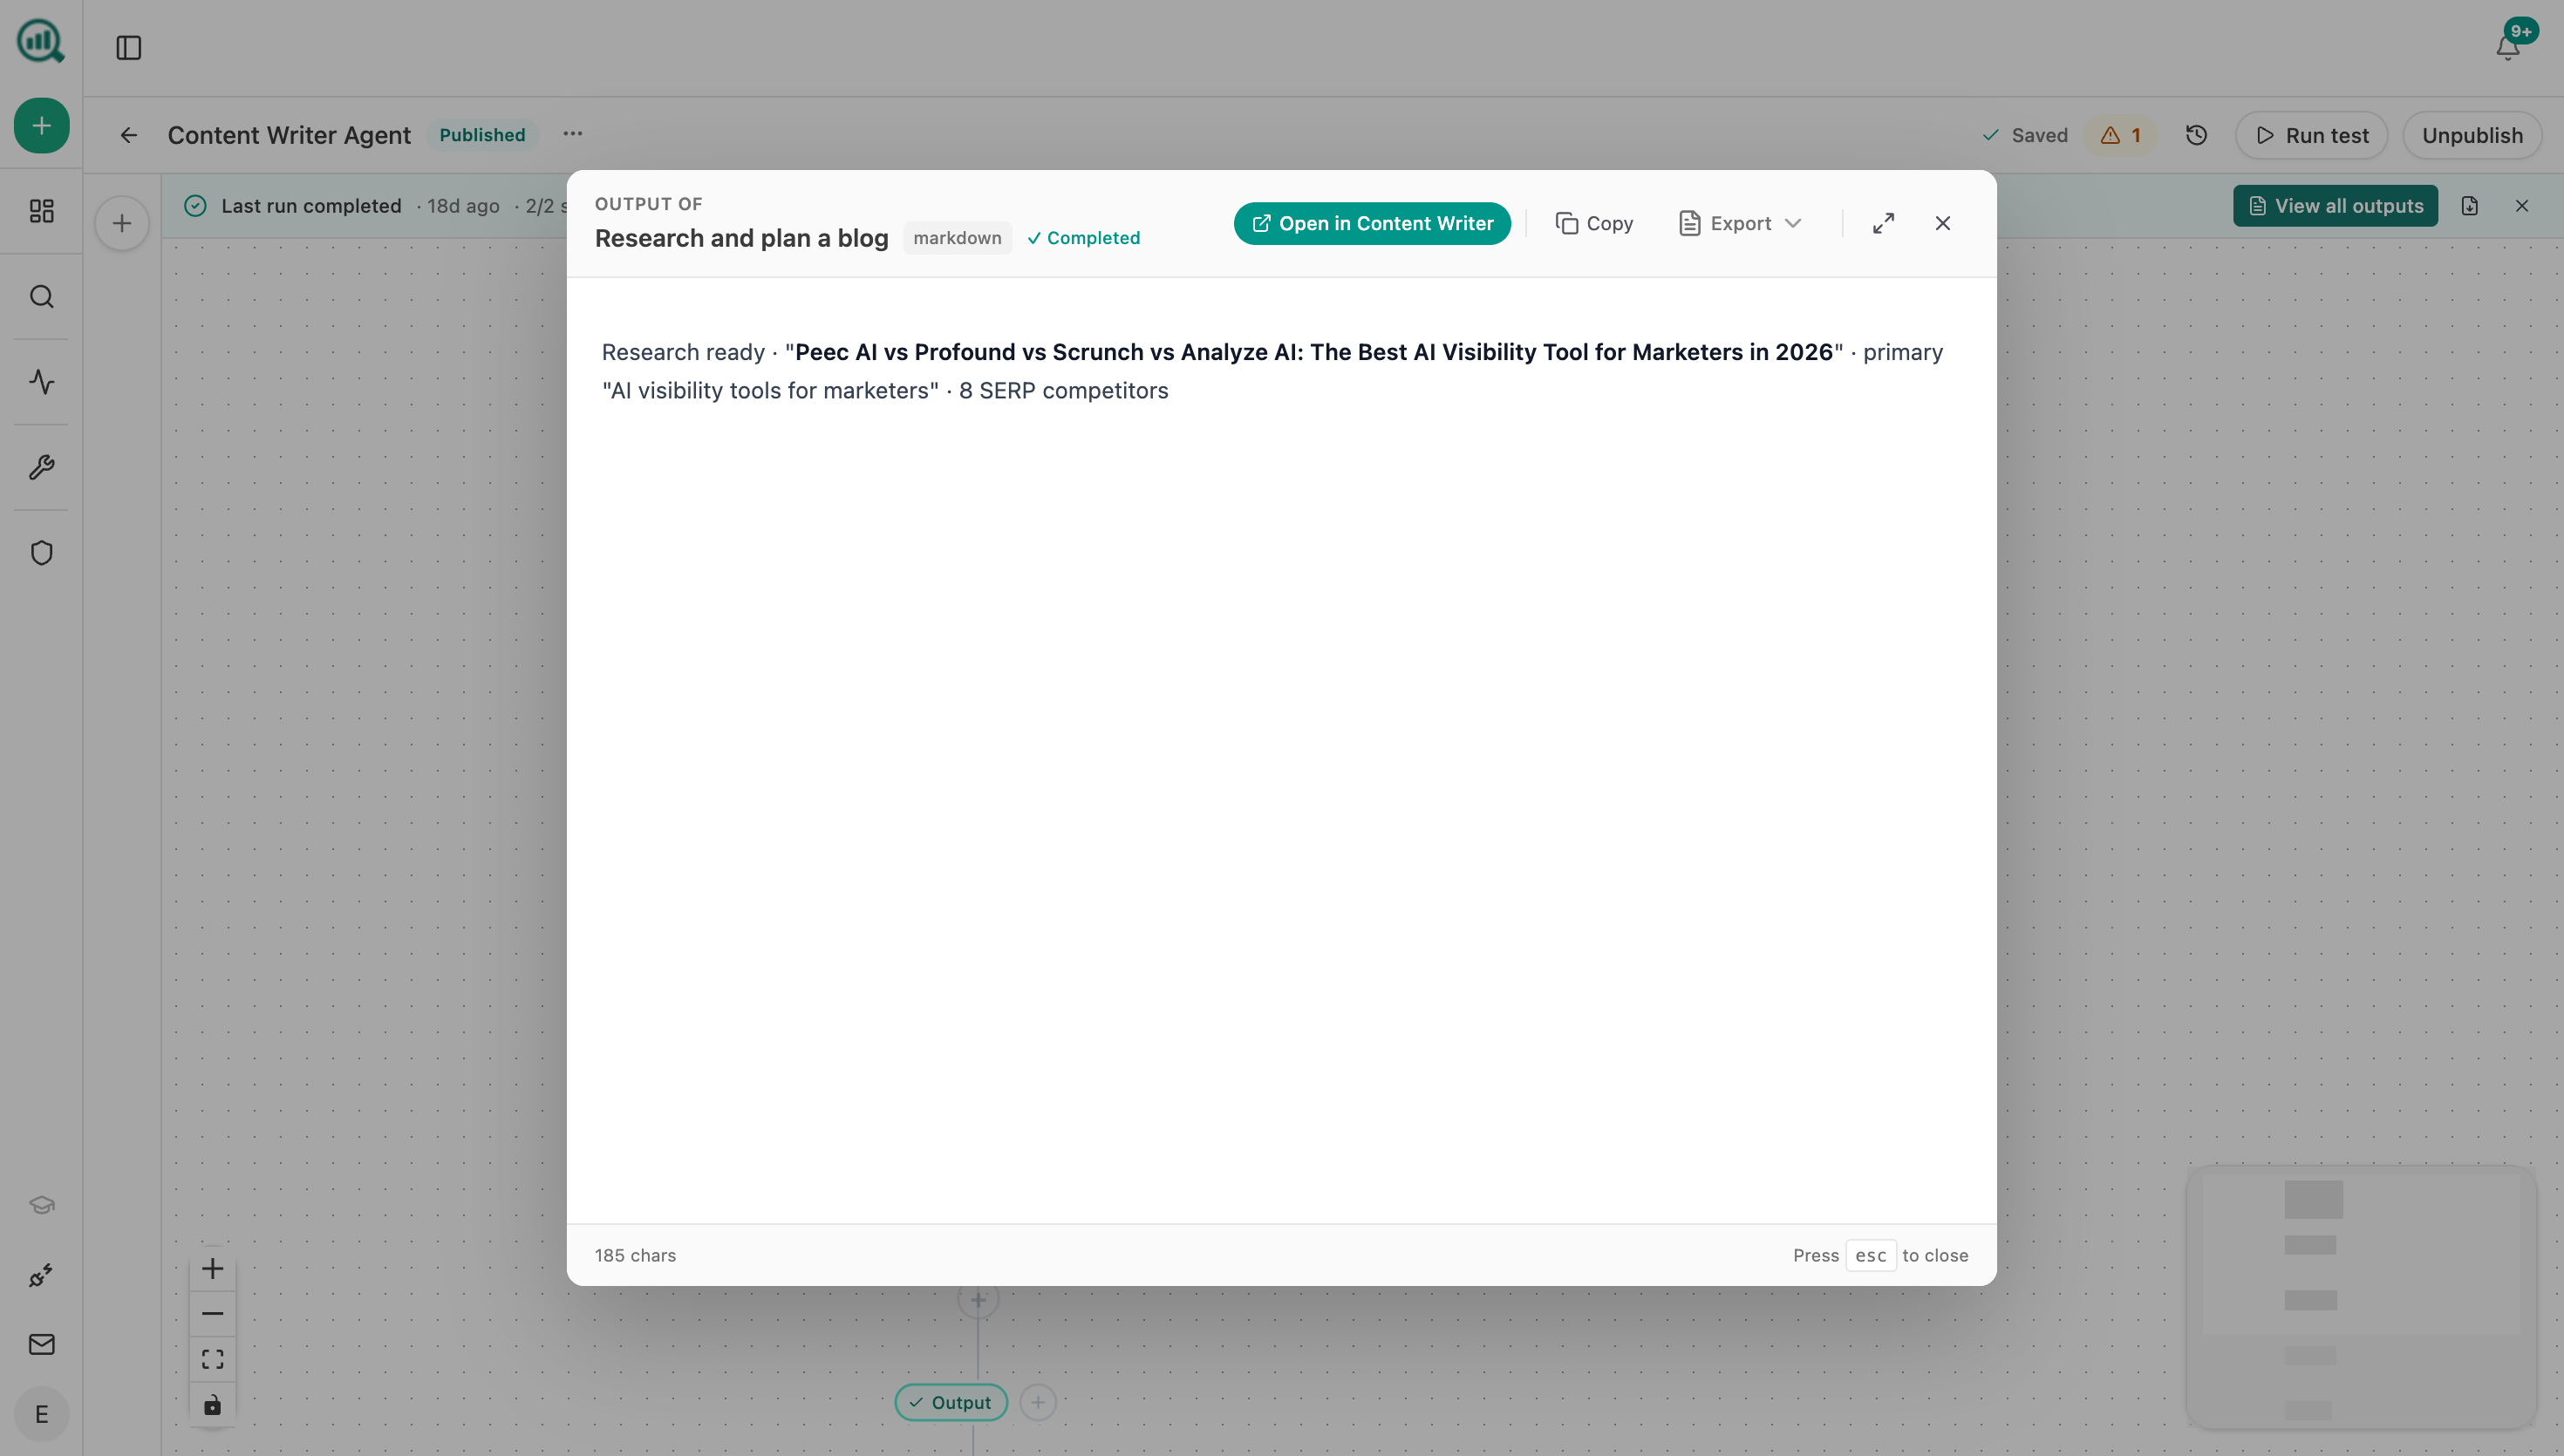 Each run hands back the two rankings together, so a heavily cited page is not judged only on the forms it collects.
FAQ
Related answers
- How do I tell lead volume from lead quality?
- Why do our MQLs never become pipeline?
- Where is our organic funnel actually leaking?
- How do I use conversion and CRM data to pick my next content topics?
Rank your pages by what they produce
Analyze AI joins your pages to CRM outcomes and to the answers assistants cite, then ranks them on both.
Start your free trial