


Summarize this blog post with:
In this article, you’ll learn how search volume data from Google Search Console (GSC) and Google Keyword Planner (GKP) compare across multiple large-scale studies, why GKP overestimates volume in the majority of cases, why GSC is not as reliable as most people assume, and how to use these two tools together to make better keyword decisions. You’ll also learn why traditional search volume is becoming only part of the demand picture now that AI search engines are generating their own answers to the same queries.
Table of Contents
Why GSC and GKP show different numbers
Google gives you two sources of keyword search volume data, and they almost never agree.
Google Search Console shows the actual number of times your page appeared in search results for a specific query. If your page ranks on the front page of Google for “best crm software,” the impressions count in GSC tells you roughly how many times someone searched that phrase and saw your listing.
Google Keyword Planner estimates the average monthly search volume for a keyword. It was built for advertisers planning Google Ads campaigns, not for SEO professionals evaluating organic opportunities. It pulls from Google’s ad auction data and applies its own rounding and grouping logic before showing you a number.
Both tools come from Google. Both claim to reflect real search behavior. And yet, when you compare them side by side, the numbers diverge significantly.
The question is not whether they disagree. They always do. The question is by how much, why, and what that means for how you prioritize keywords.
What the data says: GKP overestimates search volume most of the time
Multiple independent studies have compared GKP search volume estimates to GSC impression data. The findings are consistent across all of them.
A study of 72,635 keywords in the 1K to 10K search volume range found that GKP overestimates search volume in 91.45% of cases. In 54.28% of cases, GKP drastically overestimates the actual volume, meaning the GKP number was more than 50% higher than what GSC reported.
![[Screenshot: Bar chart showing GKP overestimates search volume 91.45% of the time]](https://www.datocms-assets.com/164164/1777578224-blobid1.png?auto=format,compress&w=1248&fit=max)
An independent study by Upgrow analyzed 33,377 ranking keywords over 16 months and found that Keyword Planner exaggerated impressions across top-10 ranking terms by 163%. That is not a rounding error. That is the difference between estimating 10,000 monthly searches and the real number being closer to 3,800.
The Upgrow study also found that 63% of ranking keywords were extremely underestimated by Keyword Planner, meaning GKP reported a much lower number than what GSC showed for those terms. This seems contradictory at first. But it makes sense once you understand how GKP groups keywords.
When GKP inflates some keywords and deflates others, the total adds up, but the per-keyword accuracy breaks down.
A separate analysis of 60 million keywords by Authoritas revealed that GKP does not actually return precise search volumes at all. It returns values from roughly 60 predetermined “buckets.” So when GKP says a keyword gets 2,600 monthly searches, it does not mean 2,600 people searched that term. It means the keyword fell into the bucket closest to that number.
Here is how those buckets work in practice:
|
What GKP shows |
What it actually means |
|---|---|
|
10 |
Somewhere between 0 and 50 |
|
100 |
Somewhere between 50 and 170 |
|
1,000 |
Somewhere between 720 and 1,600 |
|
2,900 |
Somewhere between 2,100 and 3,400 |
|
10,000 |
Somewhere between 7,200 and 12,000 |
![[Screenshot: GKP search volume interface showing rounded numbers for a set of example keywords]](https://www.datocms-assets.com/164164/1777578237-blobid2.png?auto=format,compress&w=1248&fit=max)
This means every keyword research decision you make based on GKP data starts with a built-in margin of error. And for keywords in the lower volume ranges, that margin can be enormous. A keyword showing “10” in GKP might get 3 searches per month or 40.
GKP groups keywords with similar meaning (and sometimes gets it wrong)
The biggest source of inflation in GKP data is keyword grouping.
GKP treats keywords that it considers synonyms or close variants as a single group, then reports the same search volume for every keyword in that group. This is useful for advertisers who want to know the total reach of a keyword theme. It is misleading for SEO professionals who need to know the specific demand for each variation.
Here is what that looks like in practice. Suppose you check the following keywords in GKP:
-
vpn comparison
-
compare vpn
-
vpn comparisons
-
comparing vpns
-
vpns compared
GKP will show the same search volume for all five. It groups them together and assigns the combined volume to each one. But in reality, “vpn comparison” might get 3,000 searches per month while “vpns compared” gets 40. You would never know the difference from GKP alone.
![[Screenshot: GKP showing identical search volumes for grouped keyword variations]](https://www.datocms-assets.com/164164/1777578243-blobid3.png?auto=format,compress&w=1248&fit=max)
This grouping behavior gets picked up by every keyword research tool that pulls its data from GKP, which is most of them.
The grouping is not always limited to close variants. Sometimes GKP groups keywords that are not semantically related at all. One documented example involves the keyword “chusky” being grouped with “husky.” GKP treated “chusky” as a misspelling of “husky” and assigned it the same 550K search volume. But a chusky is a distinct dog breed with its own search intent, not a typo.
Other known false groupings include “american banks” and “bank of america,” “mosquito bites” and “mosquito bits,” and “book a driver” and “drive book.”
These false groupings are uncommon. But when you encounter one during keyword research, it can lead you to target a keyword with dramatically less real demand than GKP suggests.
GKP rounds search volumes into buckets
Beyond grouping, GKP also rounds every search volume into one of roughly 60 predefined buckets.
If you use GKP without running active Google Ads campaigns, you get an even worse experience. Non-advertisers see search volume as broad ranges like “1K to 10K” instead of specific numbers. That is a 10x range. A keyword with 1,200 monthly searches and a keyword with 9,800 monthly searches look identical.
![[Screenshot: GKP showing broad “1K-10K” ranges for non-advertisers vs. the more specific API-level numbers]](https://www.datocms-assets.com/164164/1777578246-blobid4.png?auto=format,compress&w=1248&fit=max)
Even with active ad spend, the numbers returned by the GKP API are still bucketed. The difference is that the API returns a single number from the bucket (like 2,600) instead of a range (like 1K-10K). This makes the data appear more precise than it actually is.
Most third-party SEO tools pull their data from this API. They display the bucketed number as if it were an exact measurement. It is not. It is the midpoint or assigned value of whichever bucket GKP placed that keyword into.
GSC shows local impressions for search queries with local intent
GKP reports search volume at the country level. If a keyword gets one million searches per month in the United States, that is the number you see.
But many keywords trigger locally personalized results. “Golf courses,” “best pizza,” and “plumbers near me” all show different pages depending on the searcher’s location. A golf course directory in Rochester might rank well for “golf courses” in that city but not appear at all in Bakersfield search results.
![[Screenshot: Side-by-side comparison of local SERPs for “golf courses” showing different results by city]](https://www.datocms-assets.com/164164/1777578253-blobid5.png?auto=format,compress&w=1248&fit=max)
The owner of that Rochester golf site will see a fraction of the total national impressions in their GSC data, even though GKP shows the full national volume for that keyword. Only a website that ranks in every location would see GSC impressions close to the GKP number.
This is why keywords with local intent frequently show the largest gaps between GKP and GSC. Studies have found these local keywords often show a 4x or greater difference between the two tools. The Upgrow study confirmed this pattern and found that 72% of local ranking terms reported higher impressions in Keyword Planner, with 63% reporting more than 20% higher.
GSC is not perfect either
GSC is often called the “single source of truth” for keyword data. That reputation is mostly deserved. But GSC has its own limitations that can distort the picture.
Bot traffic inflates impressions
Not all impressions in GSC come from real humans. Rank tracking tools, scraping bots, and ad-clicking bots all generate automated searches that can show up as impressions in your GSC data.
Google’s John Mueller has confirmed that GSC does not filter out all bot-generated impressions. According to the 72,635-keyword study mentioned earlier, GSC data appears artificially inflated in about 0.5% of cases. That is a small percentage, but it matters if you are tracking low-volume keywords where even a few hundred extra impressions can change your interpretation.
GSC hides a large portion of your keyword data
A study of GSC data found that nearly half of all clicks in GSC go to “anonymous” queries, meaning Google does not tell you what keyword drove the click. This happens because of privacy thresholds. When a query does not meet a minimum search count, GSC suppresses it.
This means GSC gives you an incomplete picture of long-tail demand. You can see total clicks and impressions for your site, but you cannot break them down to specific queries for a significant portion of your traffic.
Sampling and data processing delays
GSC data is not real-time. There is typically a 2 to 3 day delay before data appears in reports. For high-traffic sites, Google may also sample the data rather than reporting every single impression. This introduces additional imprecision, especially for trending queries where search volume can change rapidly.
How search volume inaccuracy affects keyword strategy
Understanding these limitations changes how you should approach keyword research.
You should not compare exact search volume numbers across keywords. If GKP says keyword A has 3,600 monthly searches and keyword B has 2,900, the difference is meaningless. Both numbers are bucketed estimates that could be off by hundreds or thousands. Use search volume for directional guidance, not precise comparison.
You should not sum grouped keyword volumes. If you add up the search volumes for 10 variations of a keyword and they are all grouped by GKP, you will massively overcount the total demand. Check whether GKP is showing the same number for multiple variations. If it is, those keywords are grouped.
You should cross-reference GSC and GKP. GSC tells you what is actually happening for keywords you already rank for. GKP gives you estimates for keywords you have not targeted yet. Use them together. When you find a keyword in GKP that looks promising, check if you already rank for it or something similar in GSC. Compare the numbers. If GKP says 5,000 and your GSC shows 600 impressions while you rank in positions 4 through 6, the real volume is probably closer to 2,000 than to 5,000.
You should treat search volume as a range, not a number. Instead of saying a keyword gets 4,400 monthly searches, think of it as “probably somewhere between 3,000 and 6,000.” This mental model matches how the data is actually generated and prevents you from over-indexing on false precision.
How to get more accurate keyword search volume estimates
Here is a practical process for validating and triangulating search volume data.
Step 1: Start with GKP for discovery
Open Google Keyword Planner and enter your seed keywords. Use it to generate a broad list of keyword ideas and get a rough sense of relative demand.
![[Screenshot: Google Keyword Planner keyword ideas report for a seed keyword]](https://www.datocms-assets.com/164164/1777578257-blobid6.png?auto=format,compress&w=1248&fit=max)
Do not treat these numbers as gospel. They are starting points. Your goal at this stage is to build a list of candidates, not to make final decisions.
Step 2: Check GSC for keywords you already rank for
Go to Google Search Console and navigate to the Performance report. Filter by the keywords on your list. For any keyword where you rank in the top 10, the GSC impression count is a much better indicator of real search volume than GKP.
![[Screenshot: Google Search Console Performance report showing impressions for a specific keyword]](https://www.datocms-assets.com/164164/1777578262-blobid7.png?auto=format,compress&w=1248&fit=max)
Pay attention to the position data. If you rank in position 1 or 2, your impression count should be close to the total search volume because your listing appears for nearly every search. If you rank in position 8 or 9, your impressions only reflect the fraction of searchers who scrolled that far.
Step 3: Look for grouping artifacts in GKP
Check whether GKP shows the same search volume for multiple keyword variations. If “email marketing software” and “email marketing tools” and “best email marketing” all show 14,800, they are grouped. The combined volume for that group is 14,800, not 14,800 per keyword.
To identify which variation has the highest individual demand, check each one in GSC if you rank for them. Or use a third-party tool that de-groups keyword data using clickstream or other supplementary data sources.
Step 4: Use Google Trends to validate relative demand
Google Trends does not give you absolute search volume numbers. But it does show you relative search interest over time and across regions. If GKP says two keywords have the same volume but Google Trends shows one with 3x the interest of the other, the GKP data is likely grouped and misleading.
![[Screenshot: Google Trends comparison of two keywords showing significantly different interest levels despite same GKP volume]](https://www.datocms-assets.com/164164/1777578264-blobid8.jpg?auto=format,compress&w=1248&fit=max)
Google Trends is also useful for identifying seasonal keywords where the 12-month average from GKP hides dramatic peaks and valleys.
Step 5: Use the Analyze AI Keyword Generator for additional keyword ideas
When building out your keyword list, use multiple tools to ensure you are not missing terms that GKP does not surface. The Analyze AI Keyword Generator can help you find keyword variations that GKP might group or suppress entirely.
You can also use the Keyword Difficulty Checker to assess how competitive each term is before committing resources to content creation.
Step 6: Validate with the SERP Checker
Before finalizing your target keywords, check what actually ranks. Use the Analyze AI SERP Checker to see the current search results for each keyword. This helps you understand the search intent behind a keyword, which no volume number can tell you.
![[Screenshot: SERP results for a keyword showing the types of content that currently rank]](https://www.datocms-assets.com/164164/1777578269-blobid9.png?auto=format,compress&w=1248&fit=max)
A keyword with 5,000 monthly searches but a SERP full of Reddit threads, forums, and Wikipedia pages signals a very different opportunity than a keyword with 2,000 monthly searches where the SERP is dominated by product pages and comparison articles.
Why search volume is only half the demand picture in 2026
Here is something that GSC, GKP, and most SEO tools do not account for at all.
A growing percentage of search queries now get answered directly by AI. ChatGPT, Perplexity, Google’s AI Overviews, Claude, and Copilot all generate direct answers to the same questions that used to drive clicks to websites. When someone asks ChatGPT “best crm software for startups,” that query never shows up in Google Search Console. It never gets counted in Keyword Planner.
This does not mean search volume data is useless. SEO is not dead, and Google remains the dominant search platform by a wide margin. But it does mean that keyword search volume now captures only the Google portion of total demand. AI search represents an additional organic channel that runs in parallel.
The practical implication is straightforward. When you evaluate a keyword, you are now evaluating two things at once. You are evaluating the Google search opportunity (which GSC and GKP can help you estimate, with the caveats discussed above). And you are evaluating the AI search opportunity (which requires different tools entirely).
How to measure demand in AI search
Traditional keyword research does not apply to AI search in the same way. People do not type two-word queries into ChatGPT. They ask full questions, describe situations, and request recommendations in natural language.
This means “search volume” in the AI search context is better understood as “prompt volume.” How often do people ask AI search engines questions where your brand, product, or topic would be a relevant answer?
Analyze AI tracks this directly. The Prompt Tracking feature lets you monitor specific prompts across ChatGPT, Perplexity, Claude, Google AI, and Copilot to see how often your brand appears, what position you hold, and which competitors show up alongside you.
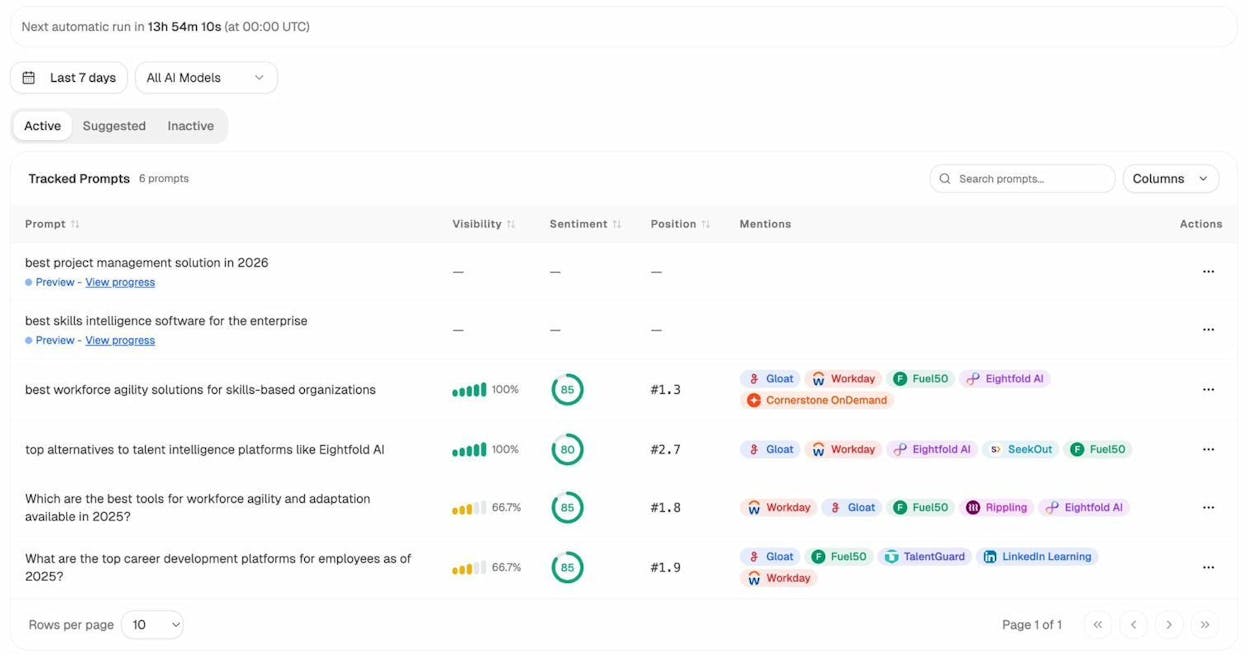
For example, where GSC would show you impressions for “best project management software,” Analyze AI shows you whether your brand appears when someone asks ChatGPT “what is the best project management tool for remote teams in 2026.”
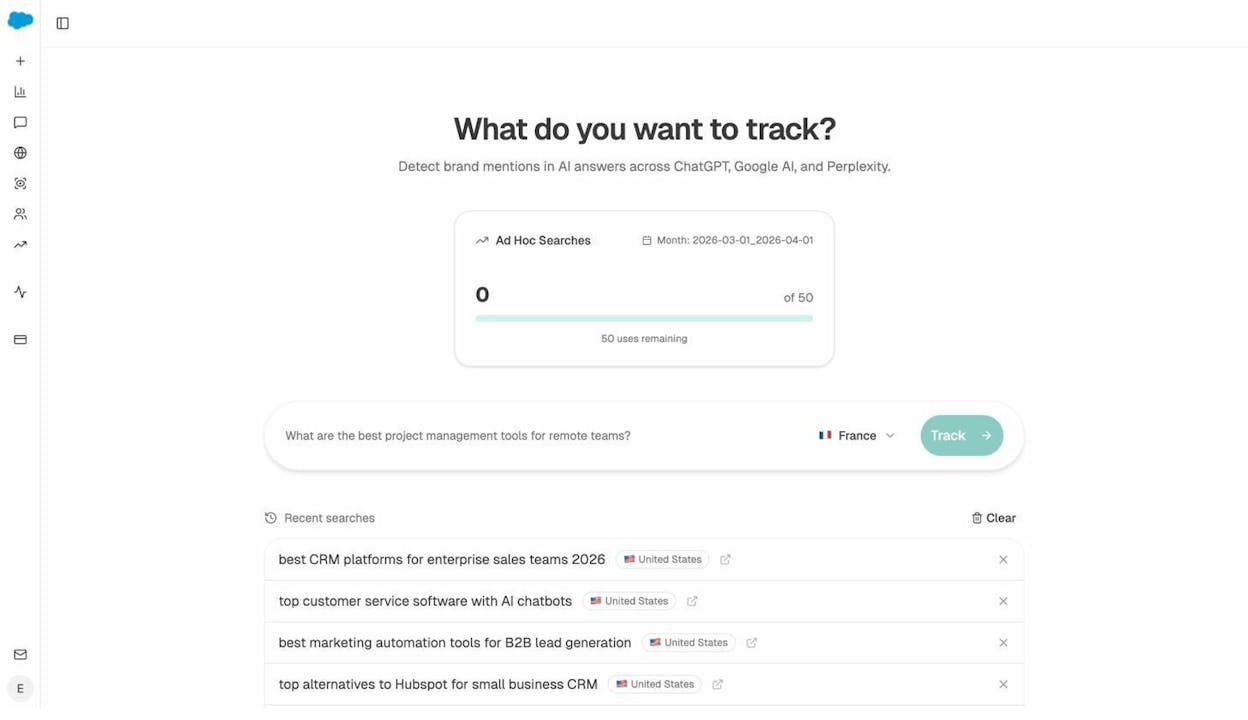
The Ad Hoc Prompt Searches feature lets you run one-off prompt checks across multiple AI engines to see exactly how they respond to questions relevant to your business.
How to track the traffic AI search actually sends you
Beyond visibility in AI answers, you also want to know whether AI search engines are driving actual visitors to your site. Analyze AI’s AI Traffic Analytics connects to your analytics to show you sessions, engagement, bounce rate, and conversions from each AI platform.
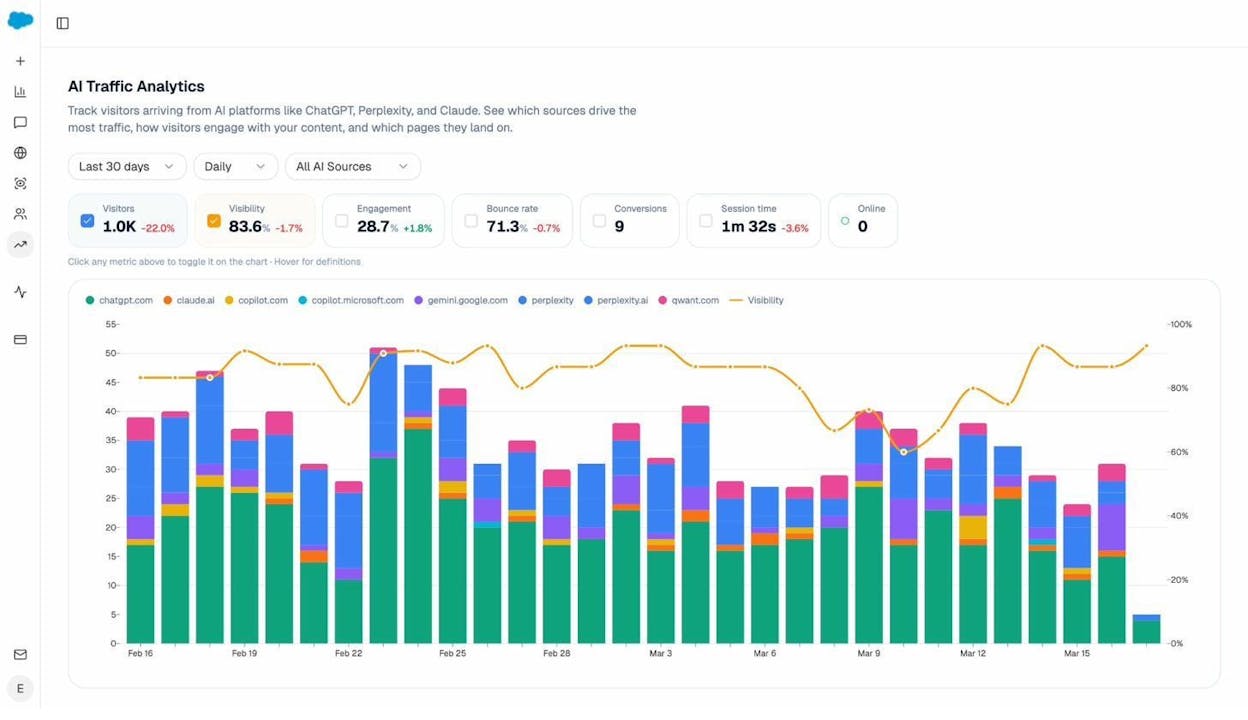
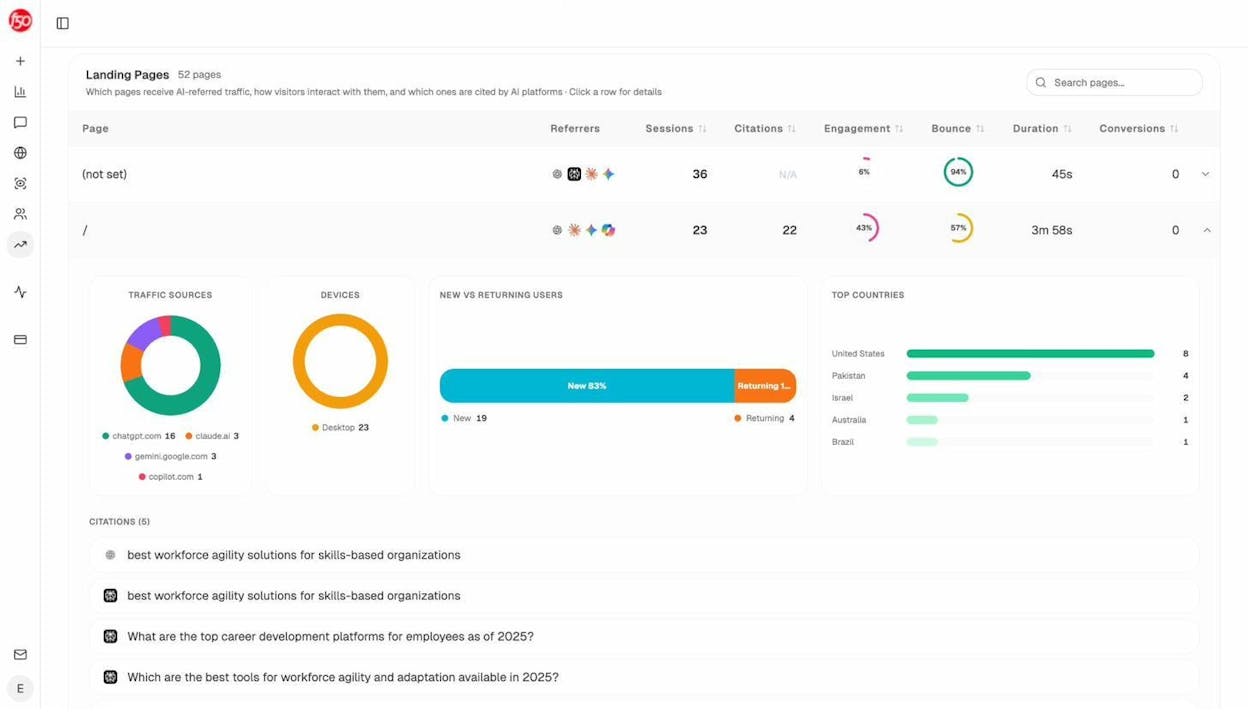
You can drill down to see which specific landing pages receive AI-referred traffic, which prompts led users to your site, and how these visitors behave compared to organic Google traffic.
This data is the AI search equivalent of GSC’s Performance report. It tells you what is actually happening, not what a planner tool estimates might happen.
How to find AI search opportunities your competitors are winning
In traditional SEO, you would use a content gap analysis to find keywords where competitors rank and you do not. The same logic applies to AI search.
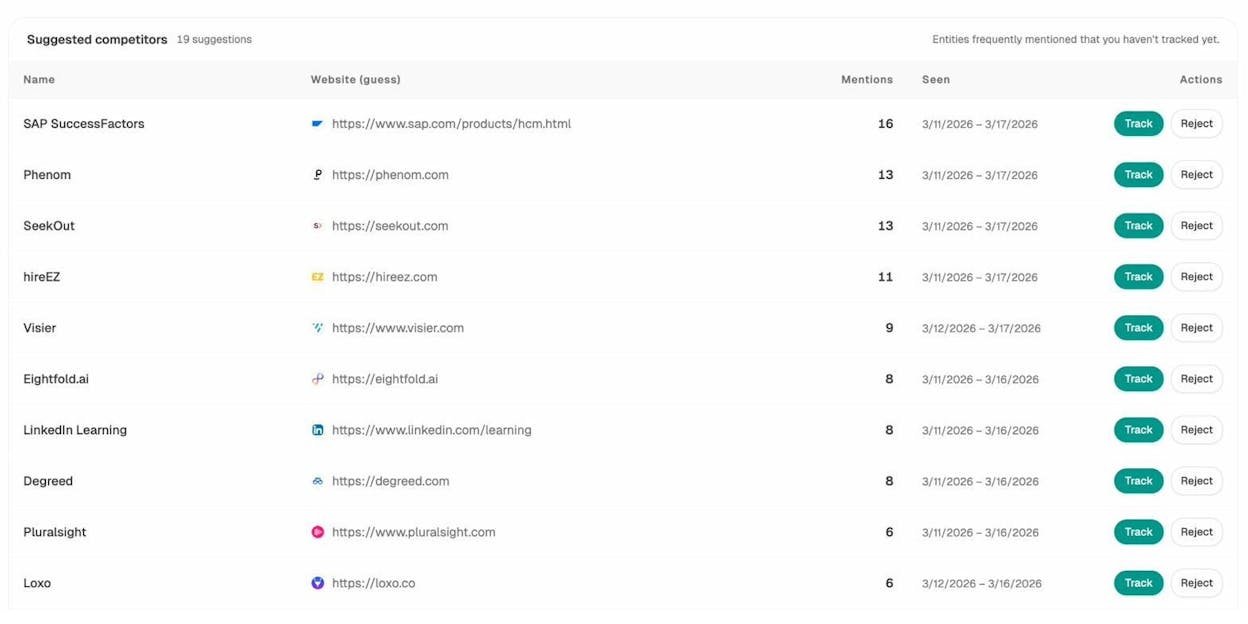
Analyze AI’s Competitor Intelligence shows you which brands appear in AI answers across your industry. You can see competitor mention counts, discover new competitors you did not know about, and identify the prompts where they show up and you do not.
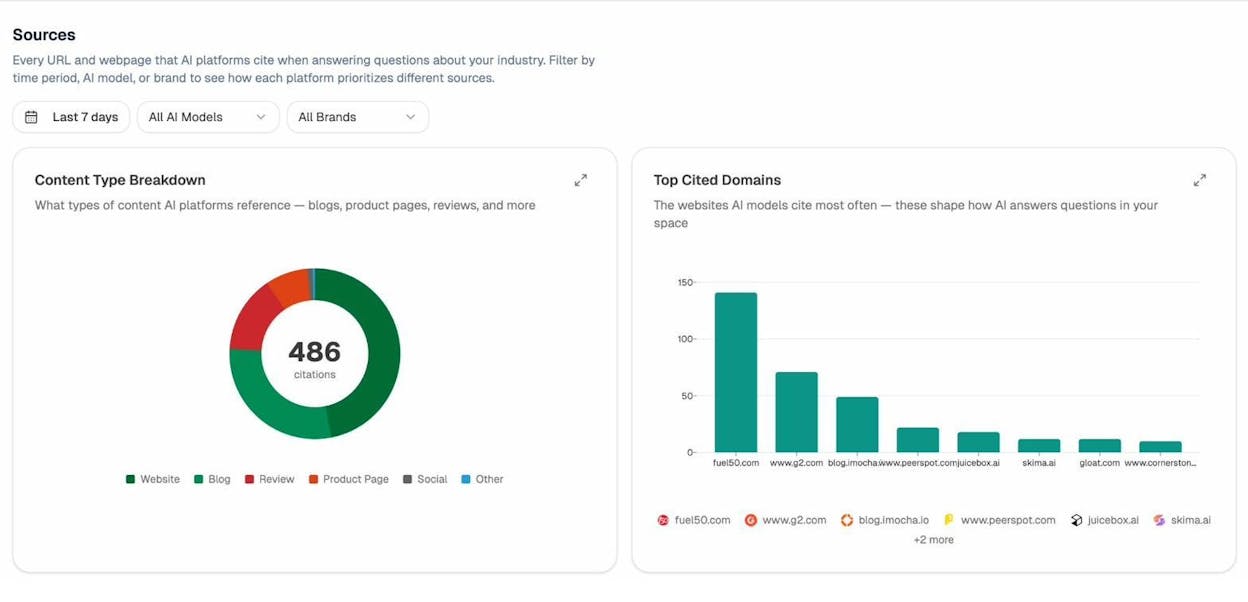
The Sources report reveals which domains and content types AI models cite most frequently in your space. If a competitor’s blog posts get cited 3x more often than yours, that tells you something specific about what AI models consider authoritative in your category.
How to bring it all together
The most complete picture of keyword demand in 2026 combines three data points:
-
GSC impressions for keywords you already rank for in Google. This is your closest approximation of real Google search volume.
-
GKP estimates for keywords you have not targeted yet, treated as rough directional indicators with a known upward bias.
-
AI prompt visibility from a tool like Analyze AI that shows whether the same topics generate demand in AI search and whether your brand is part of those answers.
A keyword might show modest volume in GKP but have significant prompt volume in AI search. Or it might show high Google volume but generate AI Overviews that reduce organic click-through rates. Either scenario changes your prioritization, and you cannot see it from GSC and GKP alone.
Summary of key findings
|
Finding |
Source |
|---|---|
|
GKP overestimates search volume in 91.45% of cases |
Study of 72,635 keywords |
|
GKP drastically overestimates (by 50%+) in 54.28% of cases |
Study of 72,635 keywords |
|
GKP exaggerated impressions across top-10 terms by 163% |
Upgrow study of 33,377 keywords |
|
63% of keywords were extremely underestimated by GKP |
Upgrow study of 33,377 keywords |
|
7% of keywords with GSC impressions show 0 in GKP |
Upgrow study of 33,377 keywords |
|
GKP uses roughly 60 predetermined volume buckets |
Authoritas analysis of 60 million keywords |
|
GSC impressions inflated by bots in about 0.5% of cases |
Study of 72,635 keywords |
|
Nearly half of GSC clicks go to anonymous (hidden) queries |
Study of GSC hidden terms |
Final thoughts
GSC and GKP are both useful tools, but for different purposes. GSC gives you the closest thing to ground truth for keywords you already rank for. GKP gives you rough demand estimates for keywords you have not targeted yet.
The core problem is that most people treat GKP data as precise when it is directional at best. It groups keywords, rounds into buckets, and consistently overestimates volume. Cross-referencing GKP with GSC, Google Trends, and third-party tools gives you a much clearer picture.
And in 2026, even a perfect Google search volume number only tells you part of the story. AI search engines now handle a growing share of the queries that used to live exclusively in Google. Tracking your visibility in AI search is no longer optional if you want a complete understanding of how people find information in your category.
The brands that will win are the ones that optimize for both channels. Not by treating AI search as a replacement for SEO, but by treating it as an additional organic channel that compounds what already works.
Ernest
Ibrahim


