


Summarize this blog post with:
In this article, you’ll learn how to run a competitive analysis that gives you a clear picture of where you stand against rivals. You’ll get a step-by-step process, a downloadable template, and a real-world example to follow. You’ll also learn how to extend your analysis to AI search, the channel most businesses still ignore when sizing up competitors.
Table of Contents
What Is a Competitive Analysis?
A competitive analysis (also called a market competitive analysis or competitor analysis) is the process of identifying your competitors and evaluating their strategies, strengths, and weaknesses relative to yours.
The goal is not to copy what competitors do. It is to understand the landscape well enough to make better decisions about positioning, pricing, messaging, content, and product development.
A good competitive analysis answers questions like:
-
Who are our direct competitors, and who is gaining ground?
-
Where do competitors reach our audience that we do not?
-
What do customers like and dislike about their products?
-
How do our features and pricing compare?
-
What content topics do they own that we should compete for?
-
Which competitors appear in AI search results when buyers ask for recommendations?
That last question is new. But it matters. When someone asks ChatGPT for the best tool in your category, the response is a competitive ranking. If your competitor shows up and you don’t, you just lost a potential buyer without ever knowing they existed.
How to Use the Template
Before diving in, grab the template. It consists of two documents:
The spreadsheet is your input document. It has tables for entering competitor data across every step of the analysis. It also includes a ChatGPT prompt for processing user reviews.
![[Screenshot of competitive analysis spreadsheet template with tabs for competitors, share of voice, pricing, features, and reviews]](https://www.datocms-assets.com/164164/1776976575-blobid1.png?auto=format,compress&w=1248&fit=max)
The slide deck is your output document. It pulls from the spreadsheet data to create a presentation you can share with your team or leadership.
![[Screenshot of competitive analysis slide deck template showing title slide and sample chart slides]](https://www.datocms-assets.com/164164/1776976587-blobid2.jpg?auto=format,compress&w=1248&fit=max)
You do not need to make these look polished yet. The point is to collect the data first and worry about presentation later. Every marketer has their own slide deck style, so feel free to customize.
The template covers these eight tasks:
-
Identify your direct competitors
-
Compare share of voice
-
Compare pricing and features
-
Find strengths and weaknesses from reviews
-
Analyze competitive positioning
-
Run a content gap analysis
-
Track competitors over time
-
Present conclusions
Let’s walk through each one.
1. Identify Your Direct Competitors
Direct competitors are businesses that sell a similar product to the same audience. They matter more than indirect competitors because buyers will compare you against them in reviews, rankings, and purchase decisions.
You probably know your top two or three competitors already. The goal of this step is to find the ones you might be missing, and to narrow your list to a manageable 3 to 5 companies.
Here are three ways to find direct competitors.
Look at keyword overlap in organic search
Sites that rank for the same keywords as you are competing for the same audience. Some of those sites will be review platforms like G2 or media publications. Skip those. Focus on businesses that sell what you sell.
To find organic competitors:
-
Go to a tool like Ahrefs’ Site Explorer, Semrush, or Analyze AI’s Keyword Generator and enter your domain
-
Look at the organic competitors report, which shows sites ranking for similar keywords
-
Visit each site and confirm they are direct competitors (not just content overlap)
![[Screenshot of an organic competitors report showing domains, common keywords, and traffic estimates]](https://www.datocms-assets.com/164164/1776976593-blobid3.png?auto=format,compress&w=1248&fit=max)
You can also use the SERP Checker from Analyze AI to see who ranks for your most important keywords. Enter your top five to ten target keywords and note which competitor domains appear most frequently.
![[Screenshot of Analyze AI SERP Checker showing competitor domains ranking for a target keyword]](https://www.datocms-assets.com/164164/1776976595-blobid4.png?auto=format,compress&w=1248&fit=max)
See who is advertising
If a company spends money on ads for keywords related to your product, they are almost certainly a direct competitor. Check paid search ads using a keywords tool.
-
Enter a few broad keywords related to your product category (e.g., “project management software” or “CRM tool”)
-
Look at the Ads history or Paid search report
-
Note which domains show up consistently
![[Screenshot of an Ads history report showing advertisers bidding on a category keyword]](https://www.datocms-assets.com/164164/1776976605-blobid5.png?auto=format,compress&w=1248&fit=max)
Find who AI search engines recommend instead of you
This is the step most competitive analysis guides skip entirely. When a buyer asks ChatGPT, Perplexity, or Gemini a question like “best project management tool for remote teams,” the AI engine returns a ranked list of recommendations. That list is a competitive set, and it may differ from what you see in traditional search results.
To find your AI search competitors, use Analyze AI’s Competitor Intelligence dashboard. The platform monitors AI-generated answers across multiple engines and identifies which brands get mentioned alongside yours.
You get two views:
Tracked competitors shows the competitors you are already monitoring, along with their mention counts and when they were last seen in AI answers.
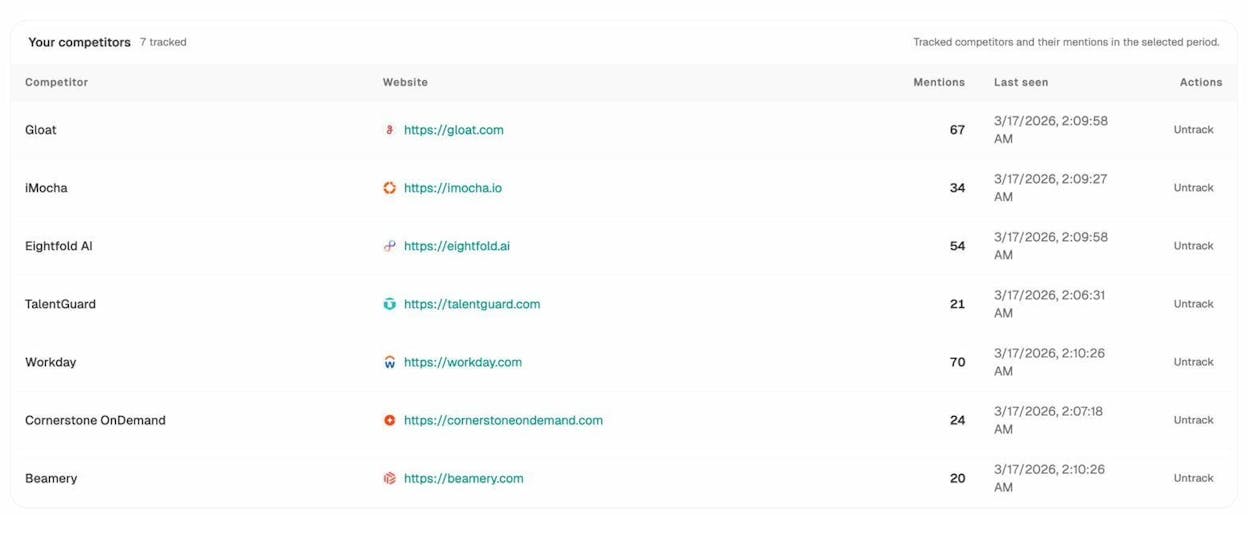
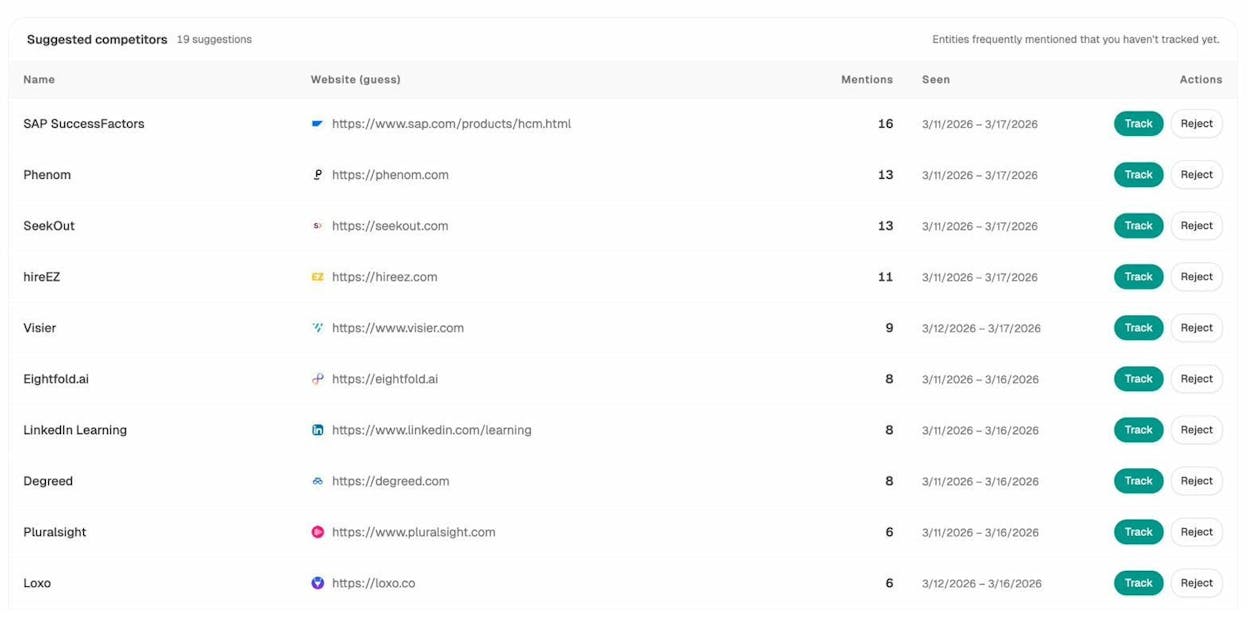
Suggested competitors surfaces brands that frequently appear in AI answers about your space but that you have not added to your tracking list yet. These are the ones you might be overlooking.
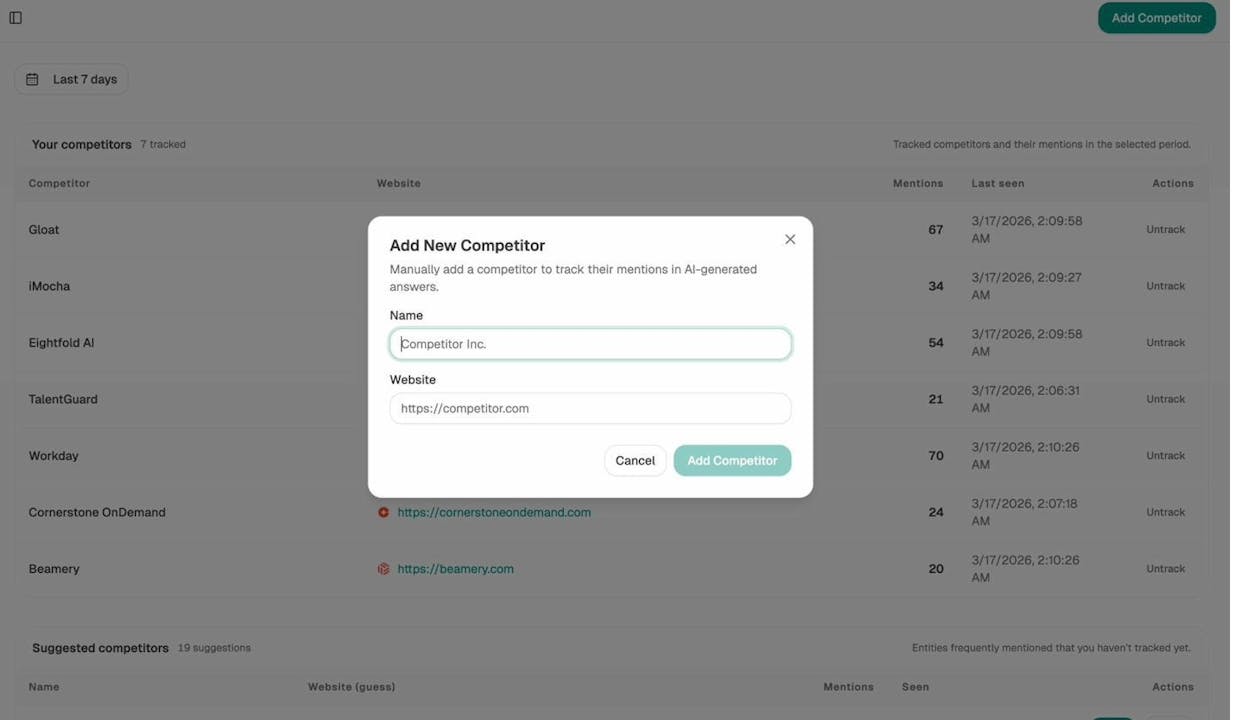
You can also add competitors manually if you already know who to track.
This is a fast way to confirm your competitor list and spot new entrants that AI engines are already recommending.
Once you have your list, narrow it down to 3 to 5 direct competitors and add them to your template.
How to validate your competitor list
Before moving forward, pressure-test your list with a few quick checks:
|
Validation check |
Why it matters |
|---|---|
|
Do they sell a similar product to the same audience? |
Filters out content competitors and indirect competitors |
|
Do they appear in product review sites like G2 or Capterra in your category? |
Confirms buyers consider them as alternatives |
|
Do they show up in AI search answers for your key prompts? |
Confirms they compete in the emerging discovery channel |
|
Are they roughly in your weight class (similar size, domain authority, funding stage)? |
Ensures the comparison is actionable |
If a competitor fails most of these checks, move them to a “watch list” rather than your primary analysis.
2. Compare Share of Voice
Share of voice (SOV) measures how much of the total conversation in your space you own compared to competitors. A higher SOV means your competitors are reaching your audience more often than you are.
You should measure SOV in at least two channels: organic search and social media. If you want a complete picture, add AI search visibility as a third.
Organic share of voice
Organic SOV tells you what percentage of search traffic for your key topics goes to you versus competitors. You can measure this with rank tracking tools.
-
Set up a rank tracking project with your target keywords
-
Add your competitor domains
-
Look at the share of voice or visibility score for each domain
![[Screenshot of a rank tracker competitors overview showing organic share of voice percentages for tracked brands]](https://www.datocms-assets.com/164164/1776976626-blobid9.png?auto=format,compress&w=1248&fit=max)
Enter the numbers in your template and paste the chart into your slide deck.
A common finding is that one or two competitors dominate organic SOV while others lag behind. If you are the one lagging, that is a signal to do an SEO competitor analysis and find the gaps.
Social share of voice
Social SOV measures how much of the social media conversation in your category involves your brand versus competitors. You can measure this with social listening tools like Brand24, Sprout Social, or Brandwatch.
-
Create monitoring projects for your brand name and each competitor’s brand name
-
Run a comparison report filtering for social media channels
-
Screenshot the SOV breakdown and add it to your deck
![[Screenshot of a social listening tool’s share of voice comparison showing brand mentions across social platforms]](https://www.datocms-assets.com/164164/1776976628-blobid10.png?auto=format,compress&w=1248&fit=max)
AI search share of voice
This is where competitive analysis gets interesting for 2026 and beyond. Traditional SOV covers Google and social media. But an increasing number of buyers now get their first impression of your brand from AI search engines.
AI search share of voice measures how often AI engines mention your brand compared to competitors when answering relevant questions. Analyze AI calculates this automatically.
In the Overview dashboard, you can see your visibility percentage compared to tracked competitors across all AI models over any time period.
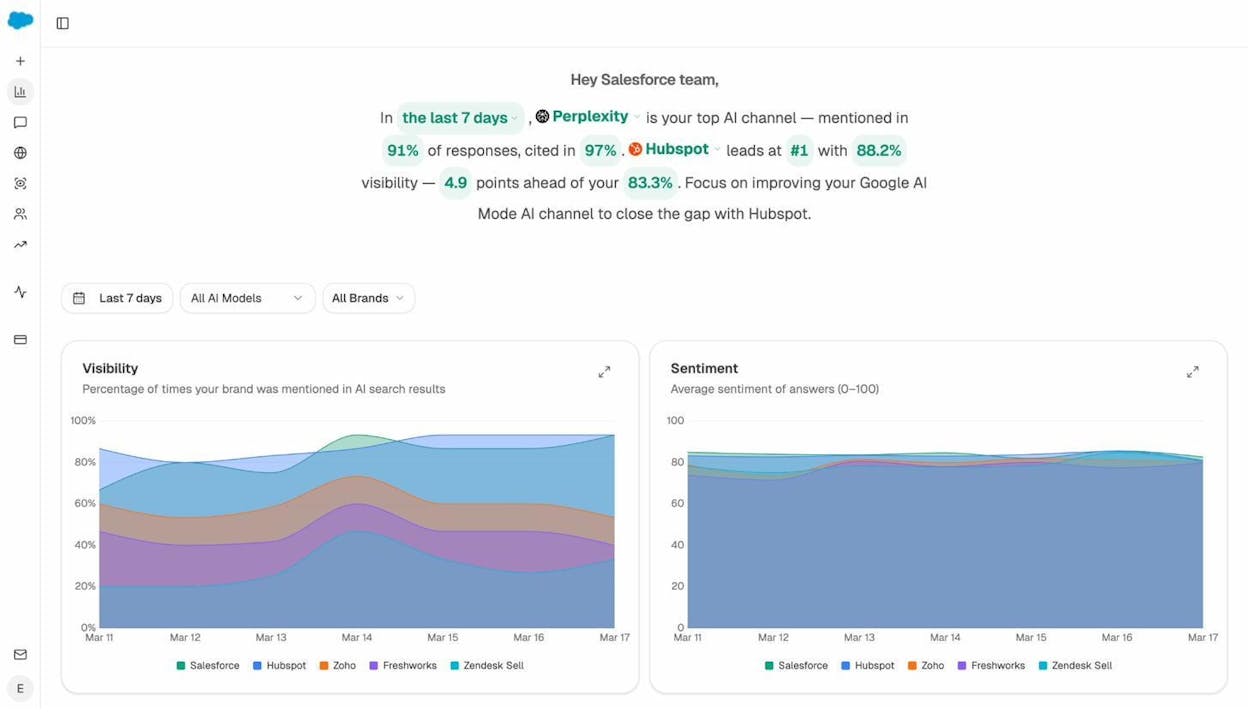
You can also drill down to a specific AI engine to see where you lead and where you trail.
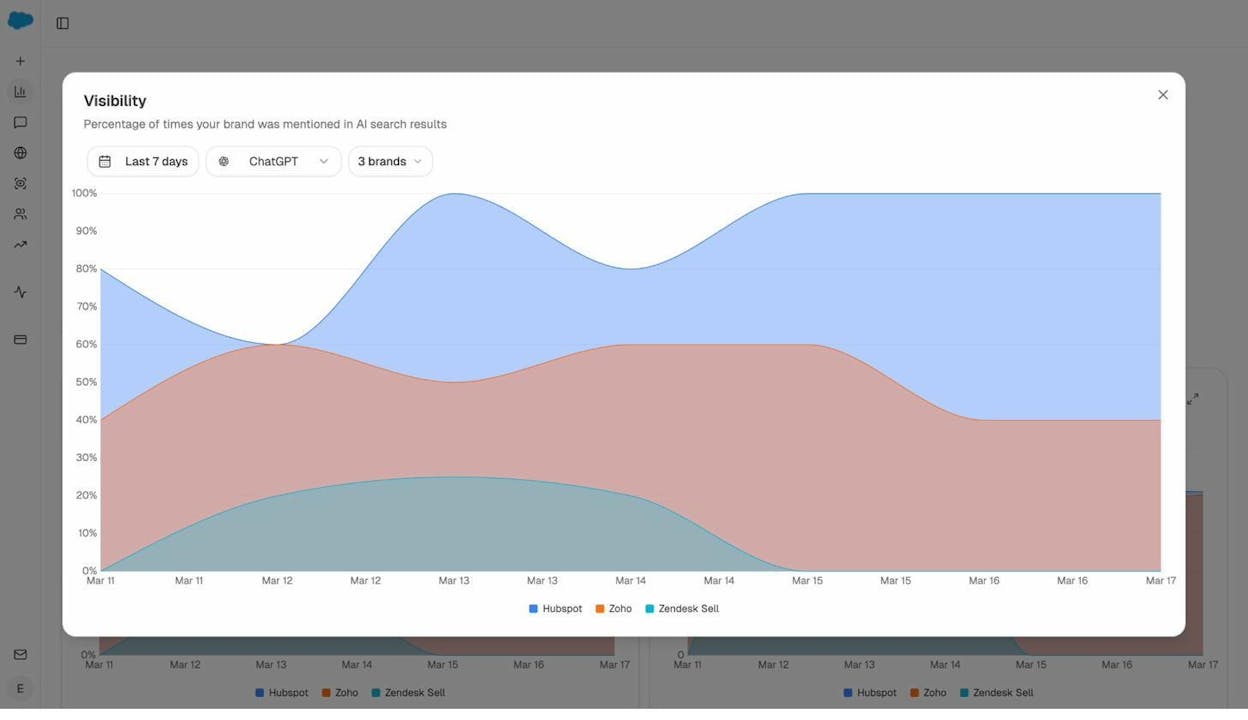
The insight here is directional. If a competitor has 88% visibility on ChatGPT while you have 52%, they are being recommended to buyers far more often than you are. That is a share of voice problem you cannot fix with Google Ads or social media posts.
Enter these numbers in your template alongside organic and social SOV for a complete picture.
3. Compare Pricing and Features
Buyers evaluate products on two dimensions: does it do what I need, and can I afford it? Your competitive analysis needs to answer both questions clearly.
Compare features
Build a feature comparison matrix. The easiest way to start is by visiting each competitor’s pricing page. Most SaaS companies list features by tier. Some even publish their own competitor comparison pages.
Here is how to build the matrix:
-
List every feature that any competitor offers in your template
-
Mark which competitors offer each feature (use a “1” for yes, leave blank for no)
-
Count the total features per competitor
The result is a feature coverage score. If one competitor offers 30 out of 35 features while another offers 18, buyers who care about breadth will lean toward the first.
|
Feature |
Your product |
Competitor A |
Competitor B |
Competitor C |
|---|---|---|---|---|
|
Feature 1 |
✓ |
✓ |
✓ |
|
|
Feature 2 |
✓ |
✓ |
✓ |
|
|
Feature 3 |
✓ |
✓ |
✓ |
|
|
Feature 4 |
✓ |
✓ |
||
|
Total |
3 |
3 |
3 |
2 |
![[Screenshot of a completed feature comparison spreadsheet tab with 1s and blanks across four competitors]](https://www.datocms-assets.com/164164/1776976652-blobid13.png?auto=format,compress&w=1248&fit=max)
Compare pricing
Pricing comparison is tricky because companies structure their plans differently. Some offer annual discounts. Others have usage-based pricing. Enterprise plans are often custom-quoted.
To keep things practical, compare the entry-level paid plan (excluding free tiers) across all competitors. Note the price and what is included at that level.
If there are significant gaps between tiers, note that too. A $50/month jump from one tier to the next is different from an $800/month jump. Large gaps between plans can signal an opportunity to offer a mid-range option.
Enter pricing data in your template and copy the resulting chart into your deck.
What AI engines say about your pricing
Here is a nuance most analyses miss. AI engines form opinions about your pricing based on reviews, comparison articles, and your own website copy. If ChatGPT tells a buyer that your product is “expensive relative to alternatives,” that perception affects purchase decisions before the buyer ever visits your pricing page.
You can check what AI engines say about your product’s pricing and value by running an ad hoc prompt search in Analyze AI. Enter a prompt like “is [Your Product] worth the price compared to [Competitor]?” and see what each AI engine responds.
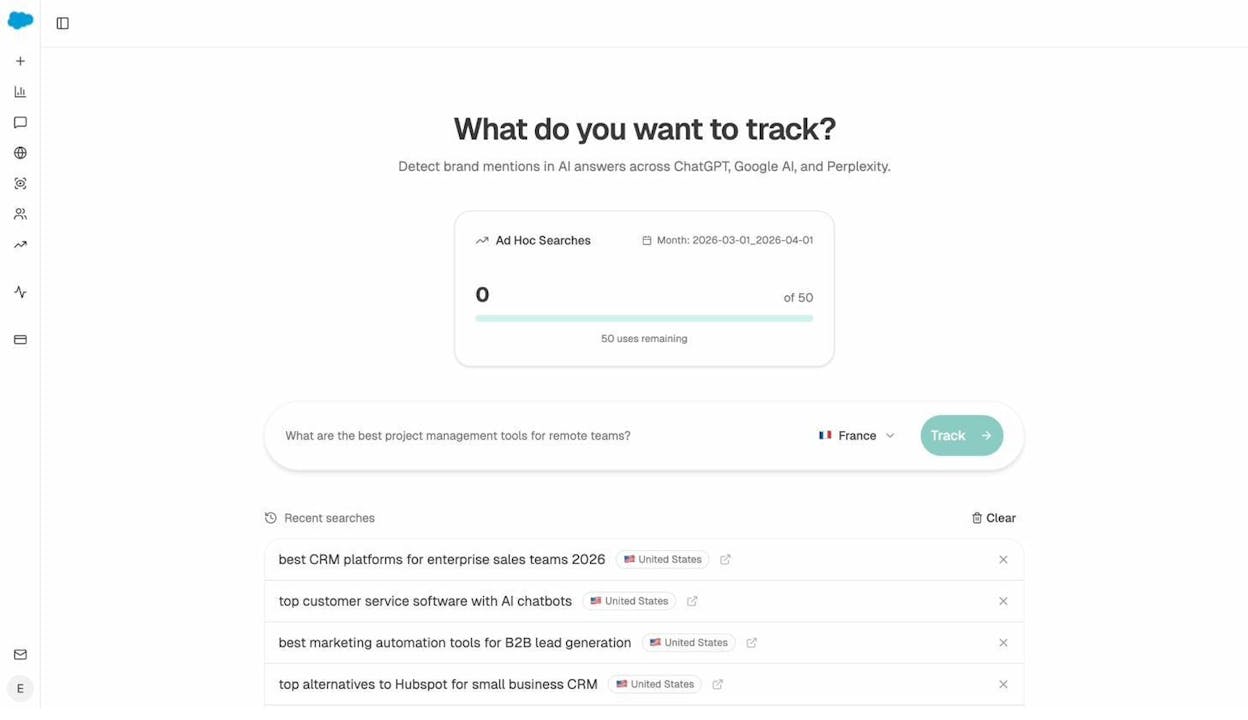
If the sentiment is negative on pricing, that is a signal to either adjust your messaging or create content that reframes your value proposition. The AI Sentiment Monitoring feature in Analyze AI will also flag risk terms like “overpriced” or “limited free plan” so you can catch negative narratives early.
4. Find Strengths and Weaknesses From Reviews
Customer reviews are one of the most underused resources in competitive analysis. They tell you exactly what real users love and hate about your competitors’ products. That insight is gold for product development, marketing messaging, and sales enablement.
Where to find reviews
The best sources for B2B product reviews are G2, Capterra, and Trustpilot. For B2C, add Amazon reviews and Reddit threads.
A key technique: focus on reviews rated 2 to 4 stars. Here is why.
Five-star reviews are often incentivized or lack specifics. One-star reviews are frequently written in frustration and are overly emotional. The most thoughtful, actionable feedback comes from users who liked some things but not others. They give you the nuance.
Use AI to analyze reviews at scale
Manually reading hundreds of reviews is not practical. Use ChatGPT, Claude, or another LLM to process them.
Here is the process:
-
Open ChatGPT or Claude and paste the analysis prompt from the template
-
Go to G2 or Capterra and find your competitor’s reviews filtered to 2 to 4 stars
-
Copy and paste 20 to 50 reviews into the chat (do not hit enter yet)
-
Once you have pasted all reviews, hit enter to run the analysis
-
Ask the AI to create charts showing the most praised and most criticized aspects
![[Screenshot of ChatGPT with the competitive analysis review prompt loaded]](https://www.datocms-assets.com/164164/1776976665-blobid15.png?auto=format,compress&w=1248&fit=max)
Repeat this for each competitor. The output gives you a side-by-side view of what each competitor does well and where they fall short.
What AI engines say about your competitors
Reviews shape what humans think about products. But they also shape what AI engines think.
AI models pull from review sites, Reddit, comparison articles, and product documentation to form their opinions. When ChatGPT says “Competitor X is known for intuitive onboarding but limited integrations,” that narrative came from somewhere. And it influences every buyer who asks.
Analyze AI’s Perception Map gives you a visual of how each competitor is positioned in AI answers along two dimensions: visibility and narrative strength.
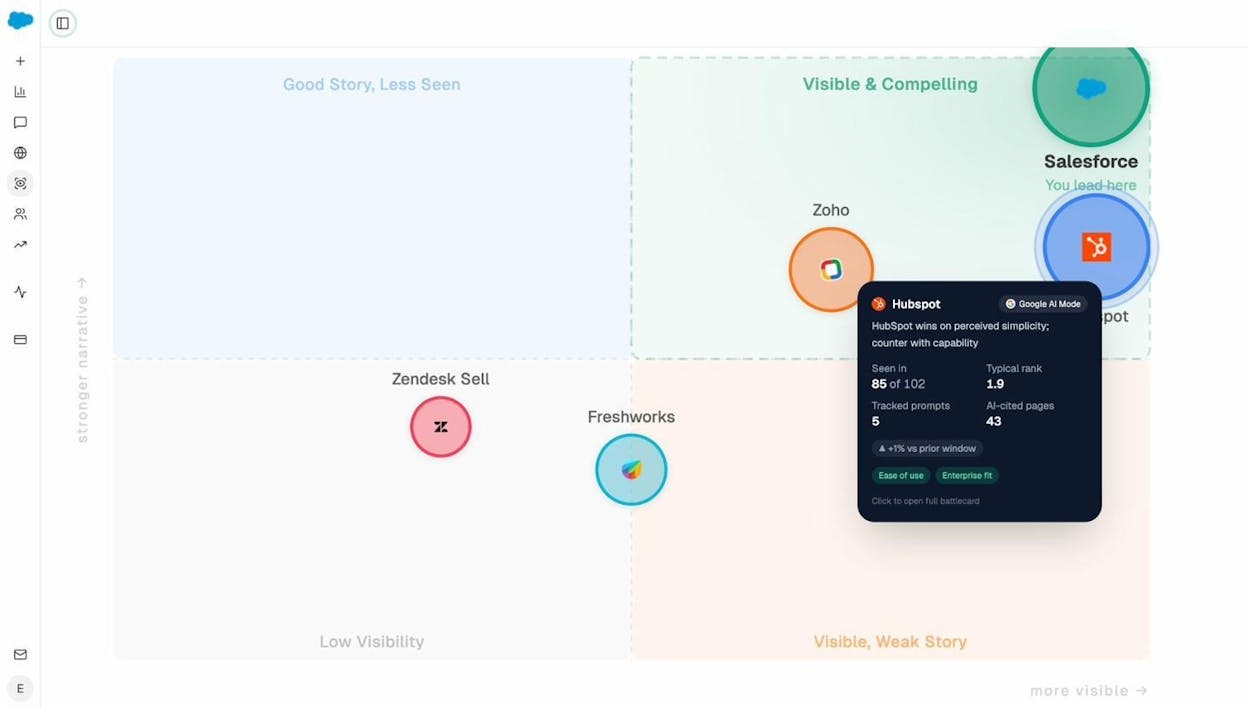
Brands in the top-right quadrant are both visible and compelling. They are the ones AI recommends with conviction. Brands in the bottom-left are barely mentioned, and when they are, the narrative is weak.
Click on any competitor to see their typical rank, how many prompts they appear in, their sentiment score, and which narratives AI engines associate with them (like “ease of use” or “enterprise fit”).
This is competitive intelligence you cannot get from G2 reviews alone. It tells you not just what customers think, but what the AI models that increasingly influence purchase decisions think.
5. Analyze Your Competitive Position
At this point you have competitor data on visibility, features, pricing, and reviews. Now step back and look at the bigger picture.
Run a quick SWOT analysis
A SWOT analysis (Strengths, Weaknesses, Opportunities, Threats) is a classic framework for a reason. It forces you to synthesize everything you have learned into four clean categories.
|
Helpful |
Harmful |
|
|---|---|---|
|
Internal |
Strengths: What you do better than competitors (e.g., deeper feature set, better pricing, stronger reviews) |
Weaknesses: Where competitors outperform you (e.g., lower SOV, missing features, negative sentiment in AI answers) |
|
External |
Opportunities: Gaps in the market you can exploit (e.g., unserved keywords, weak AI search competitors, underpriced tier) |
Threats: Risks from competitors or the market (e.g., well-funded new entrant, negative AI narrative gaining traction) |
Keep each quadrant to 3 to 5 bullet points. More than that and you are not prioritizing.
Map your competitive position
Beyond SWOT, it helps to visualize where you sit relative to competitors. A simple two-axis chart works well.
Common axes include:
-
Price (low to high) vs. feature richness (basic to comprehensive)
-
Brand awareness (low to high) vs. customer satisfaction (low to high)
-
Organic traffic (low to high) vs. AI search visibility (low to high)
Plot each competitor on the chart. The gaps you see are your opportunities.
For AI search specifically, Analyze AI’s Perception Map (shown in the previous section) does this automatically. It plots competitors on visibility vs. narrative strength using real data from AI engines. You do not need to estimate or guess.
6. Run a Content Gap Analysis
A content gap analysis identifies topics your competitors rank for in search that you do not have content for. It is one of the most actionable outputs of any competitive analysis.
Find SEO content gaps
You can find content gaps using SEO tools:
-
Enter your domain and 2 to 3 competitor domains into a competitive analysis or content gap tool
-
Filter for keywords where competitors rank in the top 10 but you do not
-
Set a minimum search volume (20+) to focus on keywords worth targeting
-
Export the list and sort by relevance to your business
![[Screenshot of a content gap analysis tool showing keywords competitors rank for but you do not]](https://www.datocms-assets.com/164164/1776976676-blobid17.png?auto=format,compress&w=1248&fit=max)
Not every keyword gap is worth filling. Focus on keywords that align with your product and have clear buyer intent. A keyword like “what is [category]” attracts a different audience than “best [category] tool for [use case].” Both matter, but the second drives more pipeline.
For a more detailed walkthrough, see our guide to SEO competitor analysis.
Find AI search content gaps
AI search engines recommend brands based on a different logic than Google. A competitor might outrank you in Google but never get mentioned by ChatGPT. Or vice versa.
Analyze AI’s Prompt Tracking dashboard shows you which prompts your competitors win and which ones you are missing from entirely.
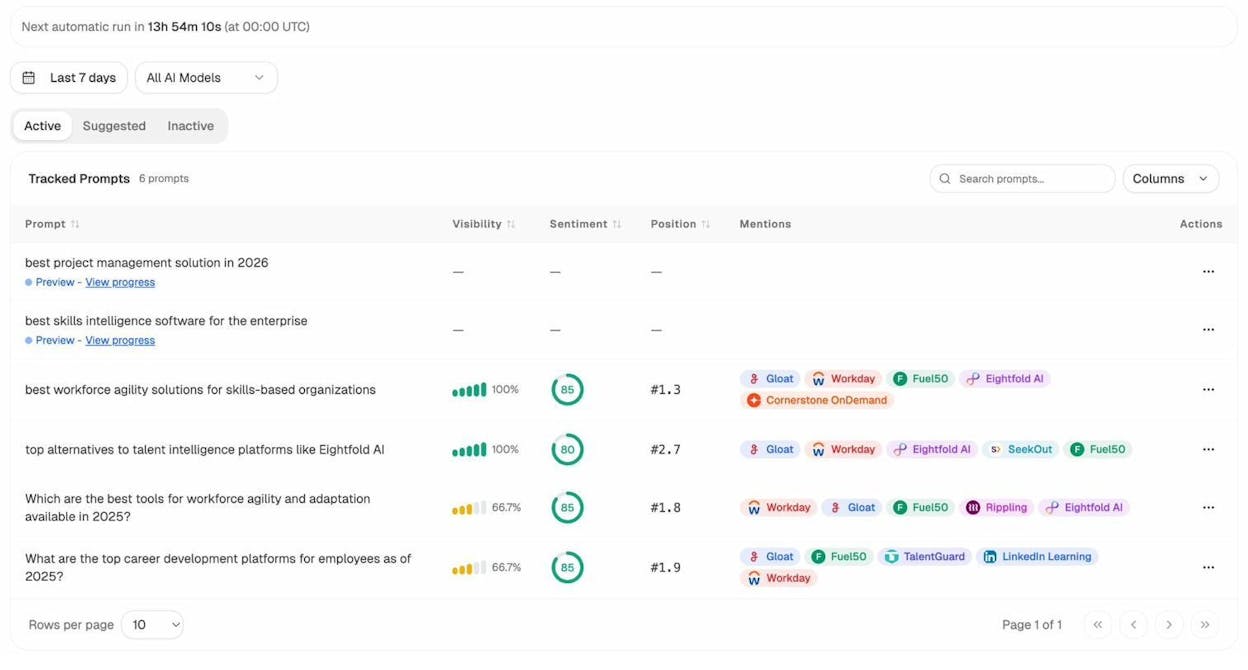
Each row shows a tracked prompt (the kind of question a buyer would ask an AI engine), your visibility percentage, your average position, and which competitors also appear. When your visibility is 0% or low while competitors show 100%, that is a gap worth closing.
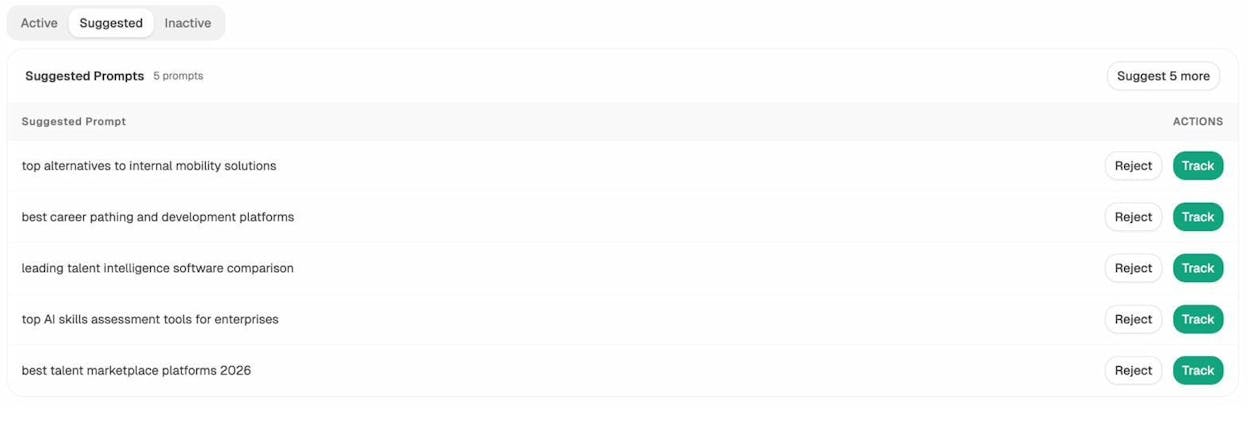
Analyze AI also suggests prompts you should be tracking based on your industry and competitors. These are questions buyers are likely asking AI engines that you have not started monitoring yet.
To understand why competitors appear and you do not, check the Sources dashboard. It shows every URL and domain that AI engines cite when answering questions in your space.
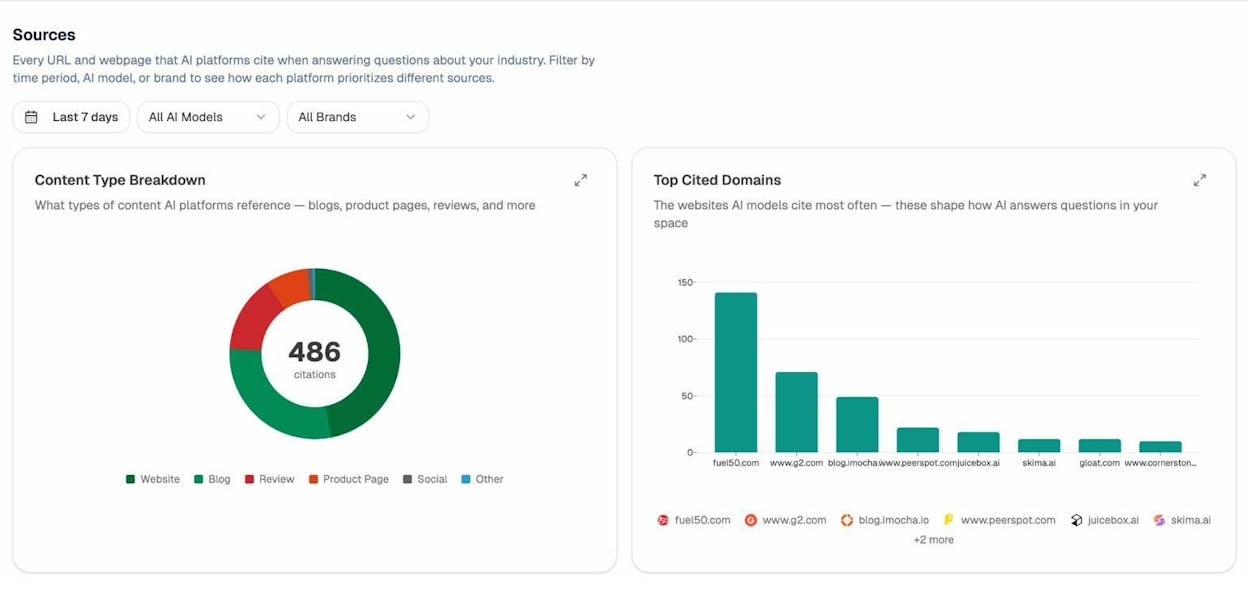
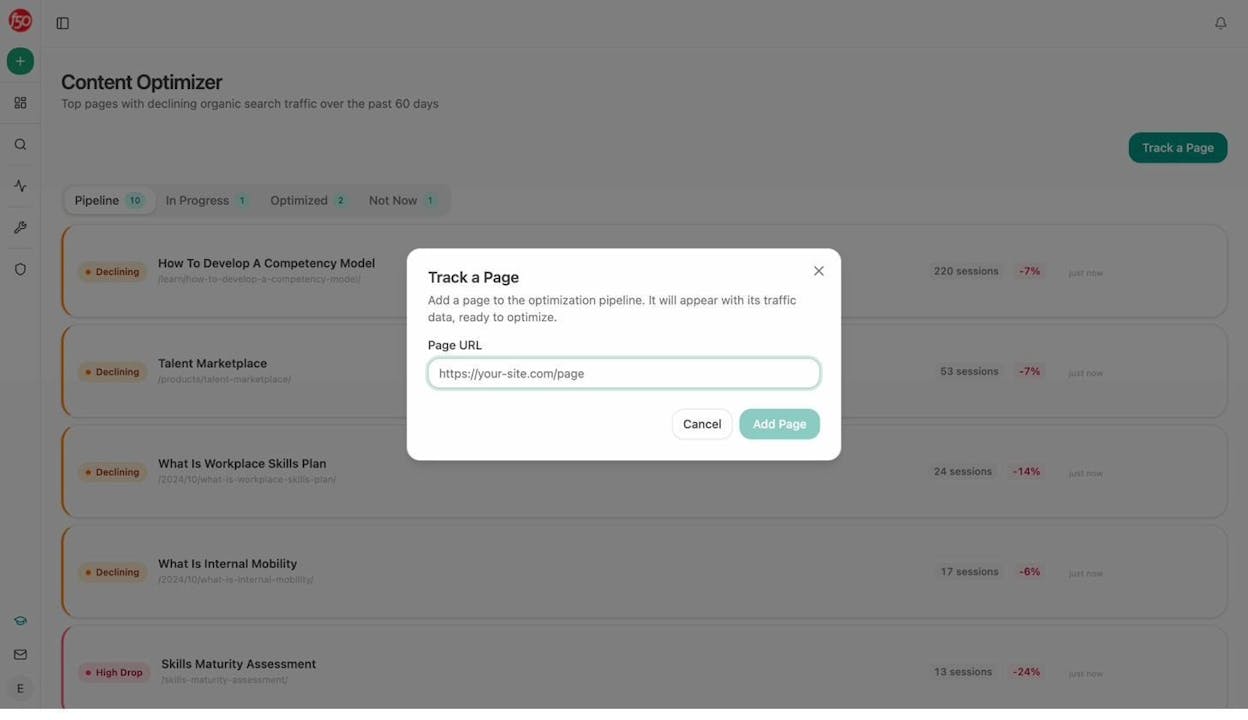
If a competitor’s blog post keeps getting cited as a source for AI answers while your content is ignored, you know exactly what to create or improve. The Content Optimizer in Analyze AI can help you audit your existing pages and identify what to fix so they get cited by AI models.
7. Compare Purchasing Convenience
This step is simple but often reveals surprising differences. How easy is it for a buyer to actually purchase your product compared to competitors?
Go through each competitor’s signup or purchase flow and note which convenience features they offer.
Common features to compare:
|
Convenience feature |
Your product |
Competitor A |
Competitor B |
Competitor C |
|---|---|---|---|---|
|
Free trial available |
||||
|
No credit card required for trial |
||||
|
Self-serve signup (no sales call needed) |
||||
|
Monthly billing option |
||||
|
Transparent pricing on website |
||||
|
Money-back guarantee |
||||
|
Live chat support during signup |
||||
|
Onboarding wizard or guided setup |
||||
|
Custom/enterprise plan available |
Place a “1” in each cell where the feature is offered. Copy the resulting chart into your deck.
If your competitor offers a frictionless self-serve signup with a 14-day free trial and no credit card, while you require a sales call and annual commitment, that is a conversion barrier worth discussing with your team.
8. Track Competitors Over Time
A competitive analysis is not a one-time exercise. Markets shift. Competitors launch new features, adjust pricing, publish new content, and gain or lose visibility. The insights you gathered today will be stale in three months if you do not update them.
Set up ongoing SEO monitoring
Use a keyword tracking tool to monitor rank changes for your most important keywords on a weekly or monthly basis. Track both your positions and your competitors’ positions so you can spot when someone starts gaining ground.
You can use tools like Analyze AI’s Keyword Rank Checker for quick spot checks, or a full rank tracker for ongoing monitoring.
Set up ongoing AI search monitoring
For AI search, Analyze AI runs your tracked prompts on a daily cadence across all monitored AI engines. You do not need to log in every day to check results.
The Weekly Email Digest sends a prioritized summary to your inbox every Monday. It includes visibility changes, competitor movements, citation momentum, and pages gaining or losing AI traffic.
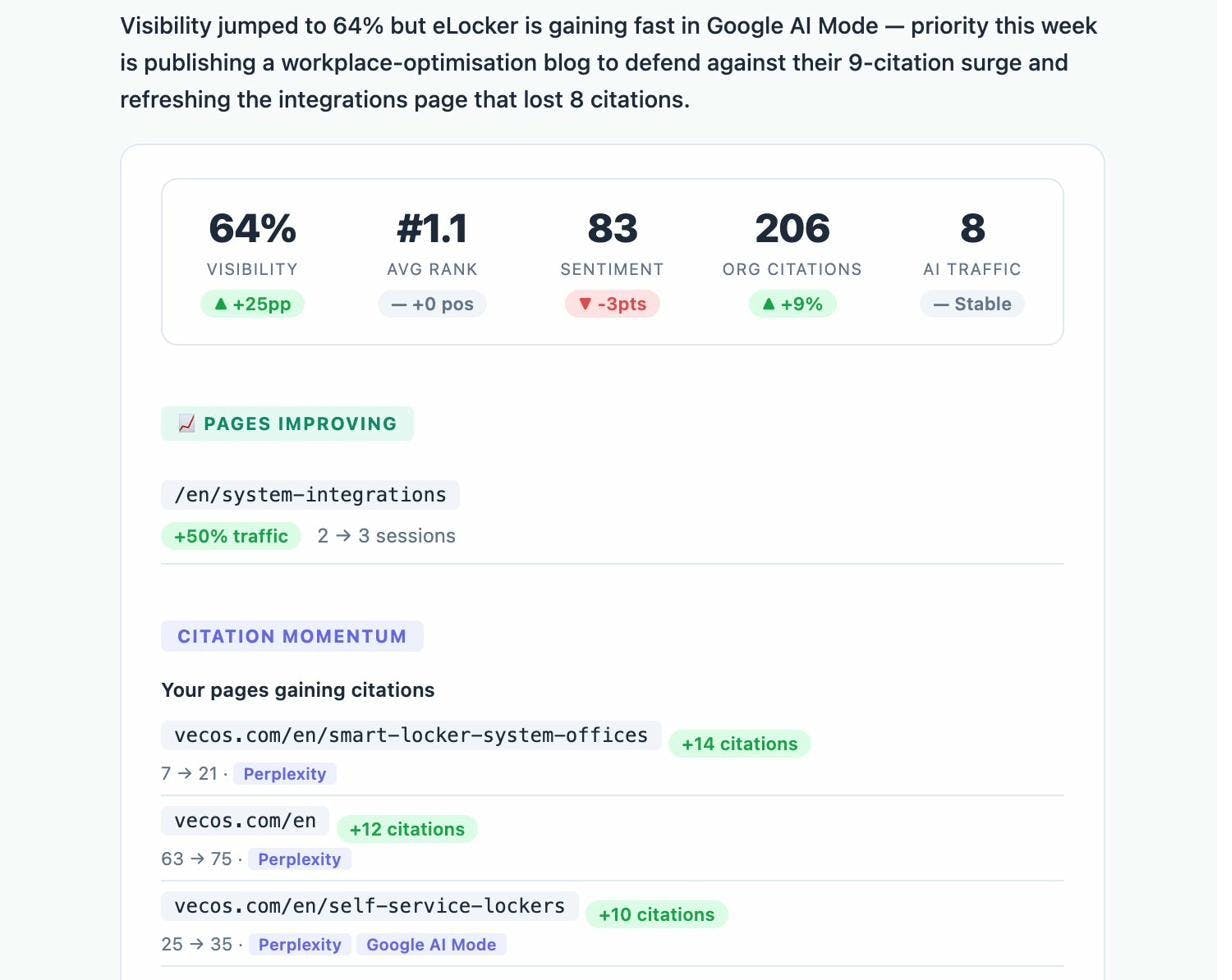
This means you can keep a pulse on competitor activity without dedicating hours each week to manual research. When something changes, like a competitor gaining five new citations on Perplexity or overtaking you on three key prompts, you will know before it compounds into a bigger problem.
Track AI-referred traffic to your site
Beyond monitoring visibility, you should track how much traffic AI search engines actually send to your website. This closes the loop from visibility to business impact.
Analyze AI’s AI Traffic Analytics connects to your GA4 account and breaks down visitors by AI source (ChatGPT, Claude, Perplexity, Gemini, Copilot, and others).
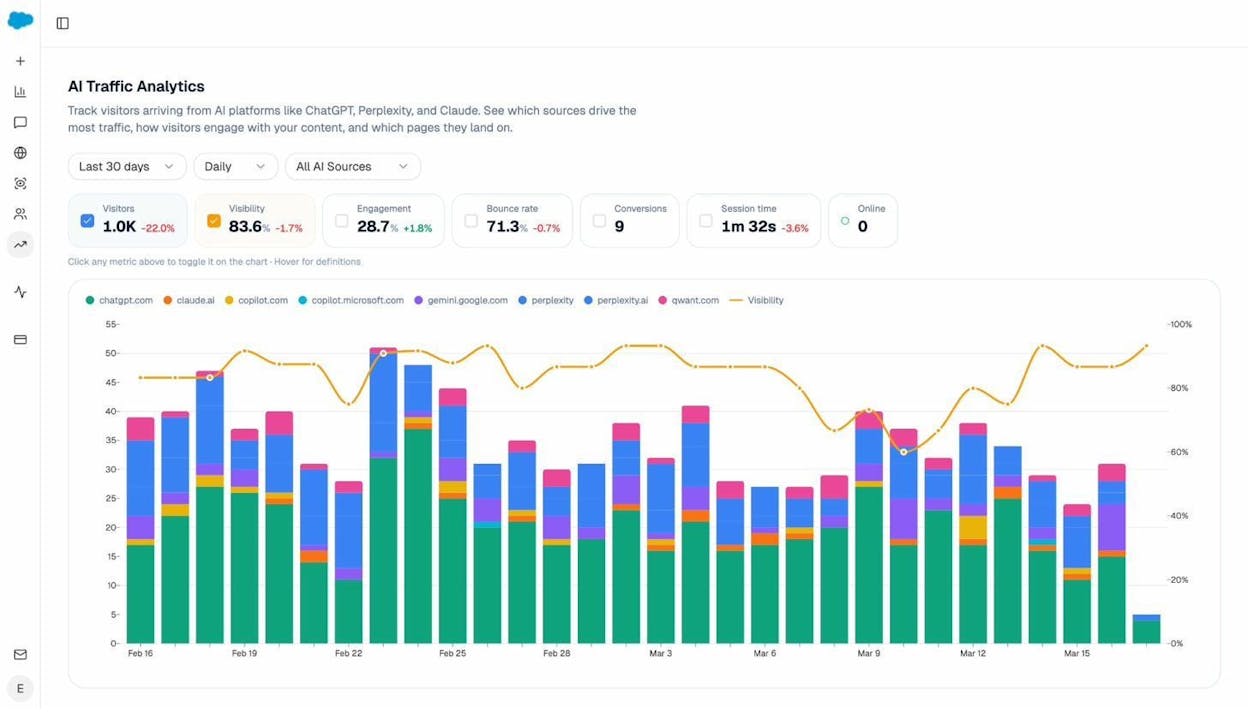
You can drill down to see which specific landing pages receive AI-referred traffic, how visitors engage, and whether they convert.
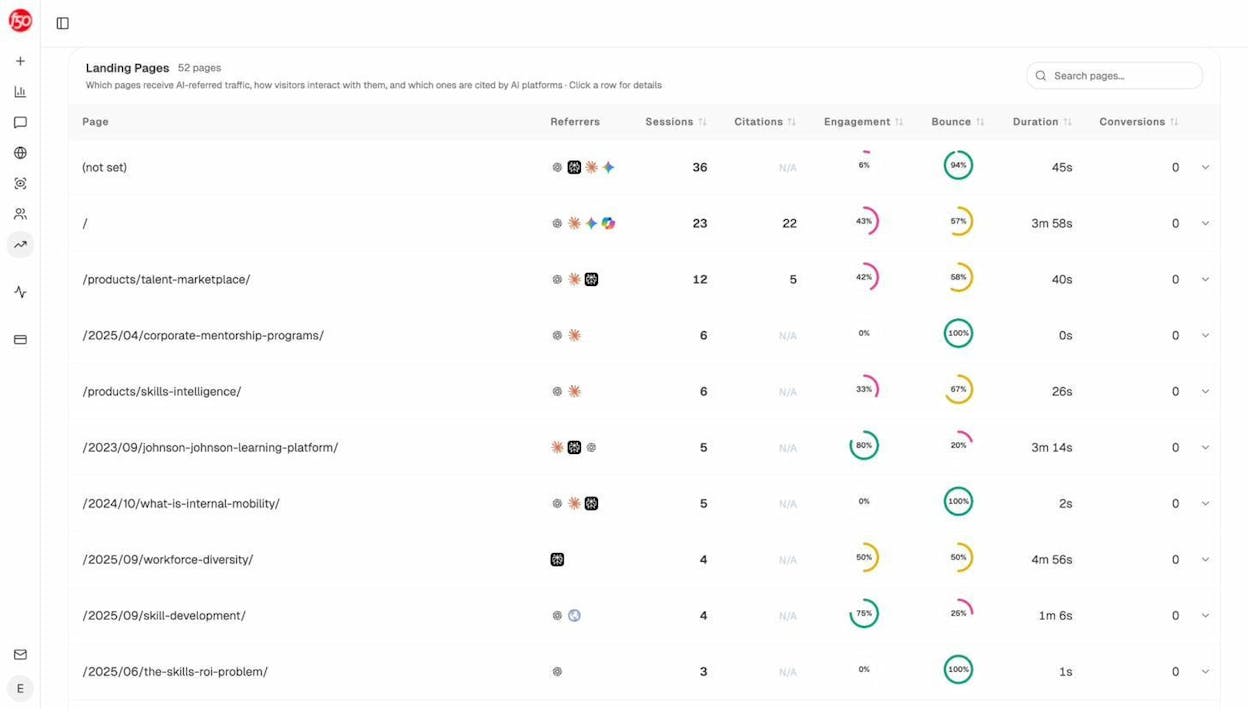
This data helps you answer a critical question: which of your pages actually work in AI search? Once you know, you can study what those pages have in common and replicate the pattern across your content.
9. Present Conclusions
This is where you turn data into decisions. Sum up your findings and suggest specific actions.
Good conclusions are:
-
Specific. “Our organic SOV is 12% compared to Competitor A’s 38%. We should close this gap by producing content on the 15 keyword clusters where they rank and we do not.”
-
Prioritized. You cannot fix everything at once. Rank your recommendations by impact and effort.
-
Actionable. Each conclusion should lead to a clear next step someone can own.
Here are examples of the kind of conclusions a competitive analysis might produce:
Share of voice finding: “We have the lowest organic SOV and zero AI search visibility on 8 of 12 key prompts. Recommendation: run a full SEO content strategy sprint and begin tracking AI prompts immediately.”
Pricing finding: “We are the most expensive option at the entry tier but do not offer the most features. Recommendation: either add the missing features or introduce a lower-priced tier.”
Review finding: “Three out of four competitors receive complaints about onboarding complexity. Our onboarding is rated highly. Recommendation: amplify onboarding experience in marketing messaging and landing pages.”
AI search finding: “Competitor B appears in 95% of AI answers in our space with positive sentiment, while we appear in only 40%. Their blog content is cited 3x more often as a source. Recommendation: audit our top 10 blog posts using the Content Optimizer and close citation gaps.”
Enter conclusions in the final slide of your template deck. Keep it to one slide per major finding and recommendation.
Common Competitive Analysis Mistakes
After walking through the full process, here are five mistakes to watch for.
Analyzing too many competitors. Stick to 3 to 5 direct competitors. More than that and the analysis becomes unwieldy without adding proportional insight. You can keep a longer “watch list” for periodic check-ins.
Confusing content competitors with business competitors. A media publication that ranks for your keywords is not a direct competitor. They are competing for attention, not customers. Focus your analysis on companies that sell similar products.
Ignoring AI search entirely. If your competitive analysis only covers Google and social media, you are missing a channel that shapes buyer perception before they ever click on a search result. AI search is an additional organic channel that complements traditional SEO, and the brands that monitor it now will have an advantage.
Doing it once and never updating. Markets are dynamic. Set a cadence for refreshing your analysis. Quarterly is a reasonable starting point for a full refresh. Weekly monitoring (using automated tools) catches shifts in between.
Going too deep without acting. Competitive analysis is a means to an end. The end is better decisions. If you spend three weeks on analysis and never change your strategy, the analysis was a waste. Timebox your research, present findings, and move to execution.
Final Thoughts
A competitive analysis is one of the most useful exercises a marketing team can do. It shows you where you are strong, where you are vulnerable, and where the opportunities are.
The process we covered here works for any business. Identify competitors. Measure share of voice. Compare features and pricing. Mine reviews for strengths and weaknesses. Map your competitive position. Find content gaps. Set up ongoing monitoring. Present your conclusions.
The part that most businesses have not caught up to yet is extending this process to AI search. When a buyer asks an AI engine for a recommendation and your competitor shows up instead of you, that is a competitive loss. It just happens to occur in a channel that traditional analytics tools do not track.
You can start monitoring your AI search competitive landscape today with Analyze AI. Set up your competitors, track the prompts that matter, and get a weekly digest of who is gaining ground. The brands that pay attention to this now will compound their advantage while others are still figuring out that it matters.
Ernest
Ibrahim


