


Summarize this blog post with:
Core Web Vitals are three performance metrics that Google uses to evaluate how real users experience your pages. They measure visual load speed, visual stability, and responsiveness. The three metrics are:
-
Largest Contentful Paint (LCP) — how fast the biggest visible element loads
-
Cumulative Layout Shift (CLS) — how much the page layout moves around as it loads
-
Interaction to Next Paint (INP) — how quickly the page responds when a user clicks, taps, or types
Google collects this data from real Chrome users through the Chrome User Experience Report (CrUX). If you use Chrome and have opted in to share usage data, your browsing experience feeds into these numbers.
Mobile Core Web Vitals have been a ranking signal since May 2021. Desktop signals followed in February 2022. They are part of Google’s broader Page Experience signals, which also include HTTPS, no intrusive interstitials, and mobile-friendliness.
Here are the benchmarks for each metric:
|
Metric |
Good |
Needs Improvement |
Poor |
|---|---|---|---|
|
LCP |
≤ 2.5 seconds |
> 2.5s – ≤ 4s |
> 4 seconds |
|
INP |
≤ 200 milliseconds |
> 200ms – ≤ 500ms |
> 500 milliseconds |
|
CLS |
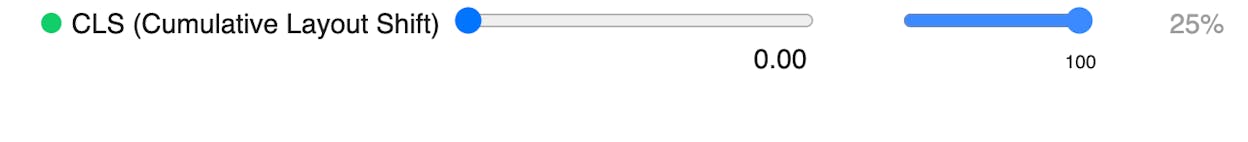
≤ 0.1 |
> 0.1 – ≤ 0.25 |
> 0.25 |
Google assesses these at the 75th percentile. That means if 70% of your visitors experience “good” performance but 5% land in the “needs improvement” bucket, your page is still flagged as “needs improvement.” You need at least 75% of visits to hit the “good” threshold for each metric.
In this article, you’ll learn what Core Web Vitals are, why Google uses them as a ranking signal, how to measure each metric on your site, and step-by-step fixes for every issue you’re likely to encounter. You’ll also learn why fast, well-structured pages are increasingly important for AI search engines — and how to track the connection between page performance and AI referral traffic.
Table of Contents
Largest Contentful Paint (LCP)
Largest Contentful Paint measures how long it takes to render the single largest visible element in the viewport. It represents the moment a visitor perceives the page as visually loaded.
The LCP element is usually a hero image, the <h1> heading, or a large text block. But it could be any of these HTML elements:
-
<img> tags
-
<image> elements inside <svg>
-
The poster image of a <video> element
-
Background images loaded via the url() CSS function
-
Block-level text elements (paragraphs, headings)
Why this metric matters: if a visitor lands on your page and the main content takes longer than 2.5 seconds to show up, they’re looking at a half-loaded screen. That’s the visual equivalent of making someone wait in line before they’re allowed to read your page.
How to identify your LCP element
You need to know which element is actually triggering your LCP measurement before you can fix it.
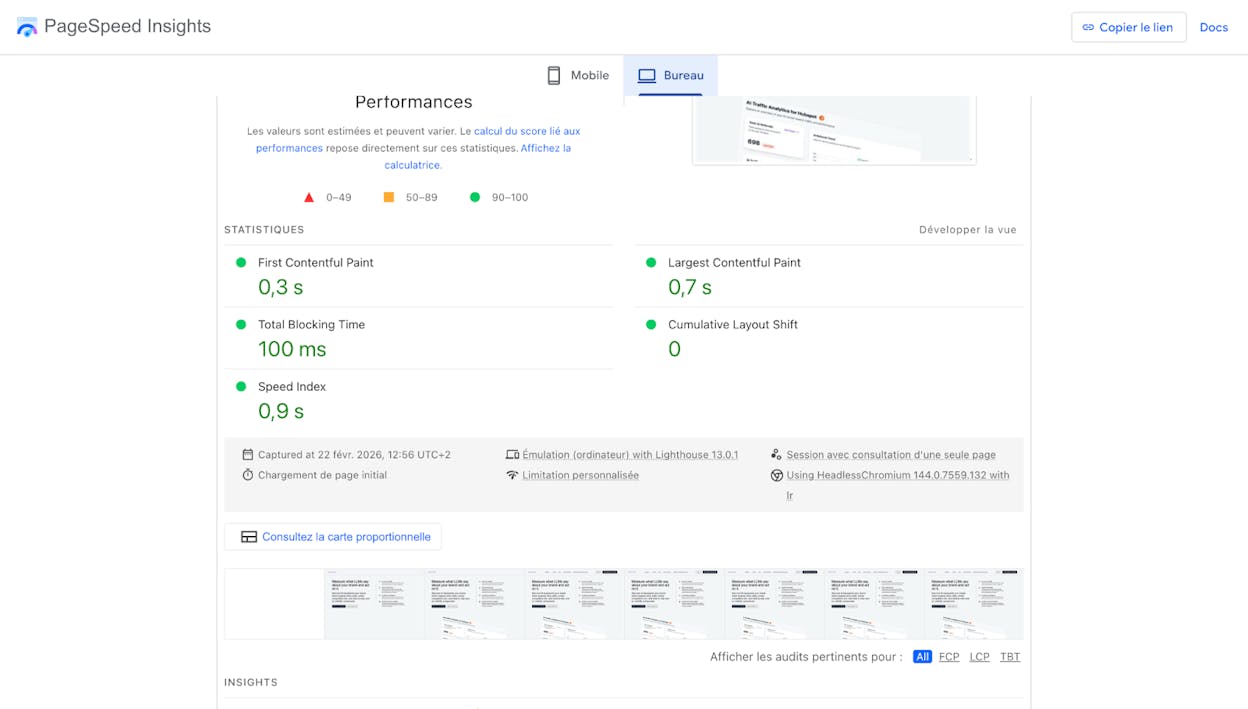
In PageSpeed Insights:
Go to PageSpeed Insights, enter your URL, and scroll to the Diagnostics section. The LCP element will be listed explicitly. You’ll also notice a blue “LCP” tab at the top of the diagnostics — click it to filter for LCP-related issues only.
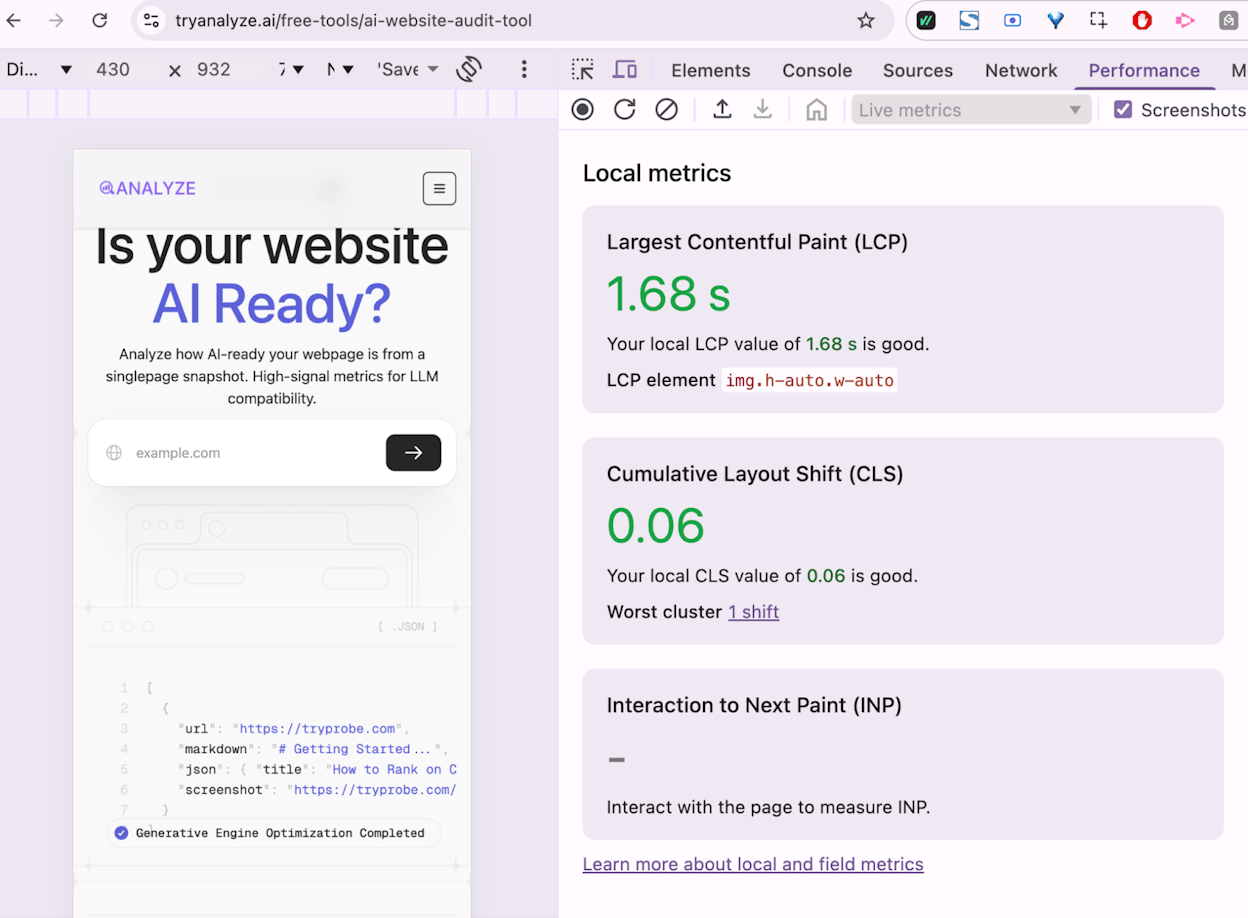
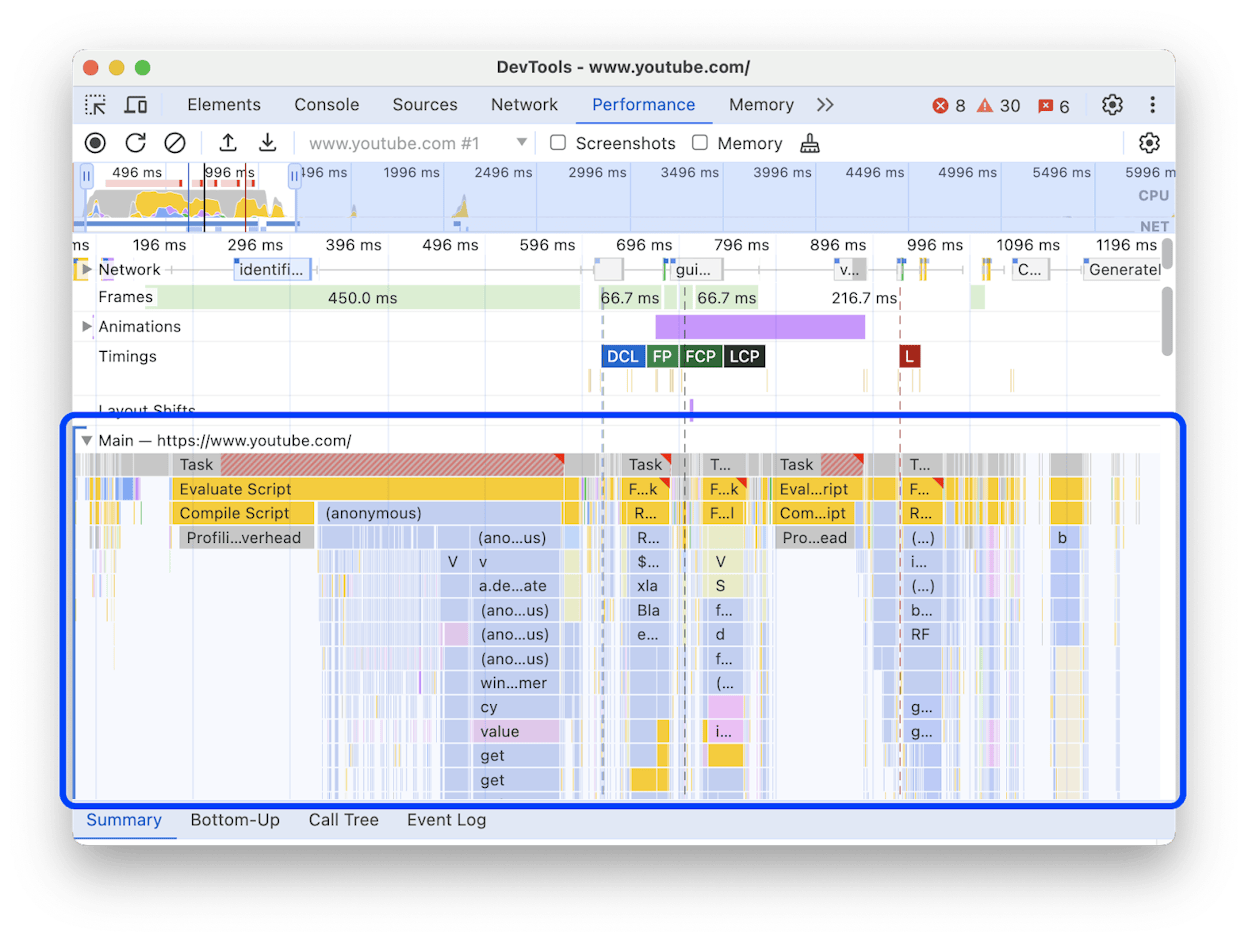
In Chrome DevTools:
-
Open DevTools (F12 or right-click → Inspect).
-
Go to the Performance tab.
-
Check the “Screenshots” checkbox.
-
Click “Start profiling and reload page” (the circular arrow icon).
-
Look for “LCP” on the timing track in the waterfall.
-
Click the LCP marker — it will highlight the exact DOM element that triggered it.
This step matters because many site owners assume their hero image is the LCP element when it’s actually the <h1> text or a background image. Fixing the wrong element wastes time.
Common causes of slow LCP
LCP problems almost always trace back to one of four bottlenecks:
1. Slow server response time (TTFB). If your server takes too long to start sending HTML, everything downstream is delayed. You can check Time to First Byte in PageSpeed Insights under the “Server response time” audit.
2. Render-blocking resources. CSS and JavaScript files in the <head> that must download and execute before the browser can paint anything. Every render-blocking file adds delay.
3. Slow resource load time. The LCP element itself (usually an image) is large, not optimized, or hosted on a slow CDN.
4. Client-side rendering. If your page relies on JavaScript to build the DOM before content can appear, LCP will be delayed until that JavaScript runs.
Cumulative Layout Shift (CLS)
Cumulative Layout Shift measures visual stability — how much page elements move around unexpectedly while the page loads. The score is calculated by multiplying the size of the shifting elements by the distance they travel.
Google measures CLS within a five-second window where the most shifting occurs, not across the entire page lifetime. This was an update from the original measurement approach, which penalized long-lived pages like infinite scrolling feeds.
If you’ve ever tried to tap a button on your phone only to have an ad load and push the button down — causing you to click the ad instead — you’ve experienced a layout shift. It’s one of the most frustrating things on the web.
Common causes of CLS
Layout shifts happen when the browser doesn’t know how much space an element will take up before it loads:
Images without explicit dimensions. If your <img> tags don’t include width and height attributes, the browser allocates zero space for the image initially, then reflows the entire layout once the image downloads.
Ads, embeds, and iframes without reserved space. Third-party ad networks are notorious for this. The ad slot starts at zero height, then expands to its full size, pushing everything below it down the page.
Dynamically injected content. JavaScript that inserts banners, cookie notices, or promotional bars above existing content after the initial render.
Web fonts that cause text reflow. When a custom font loads and replaces the fallback font, text blocks can change size, pushing surrounding elements around. This is called FOIT (Flash of Invisible Text) or FOUT (Flash of Unstyled Text).
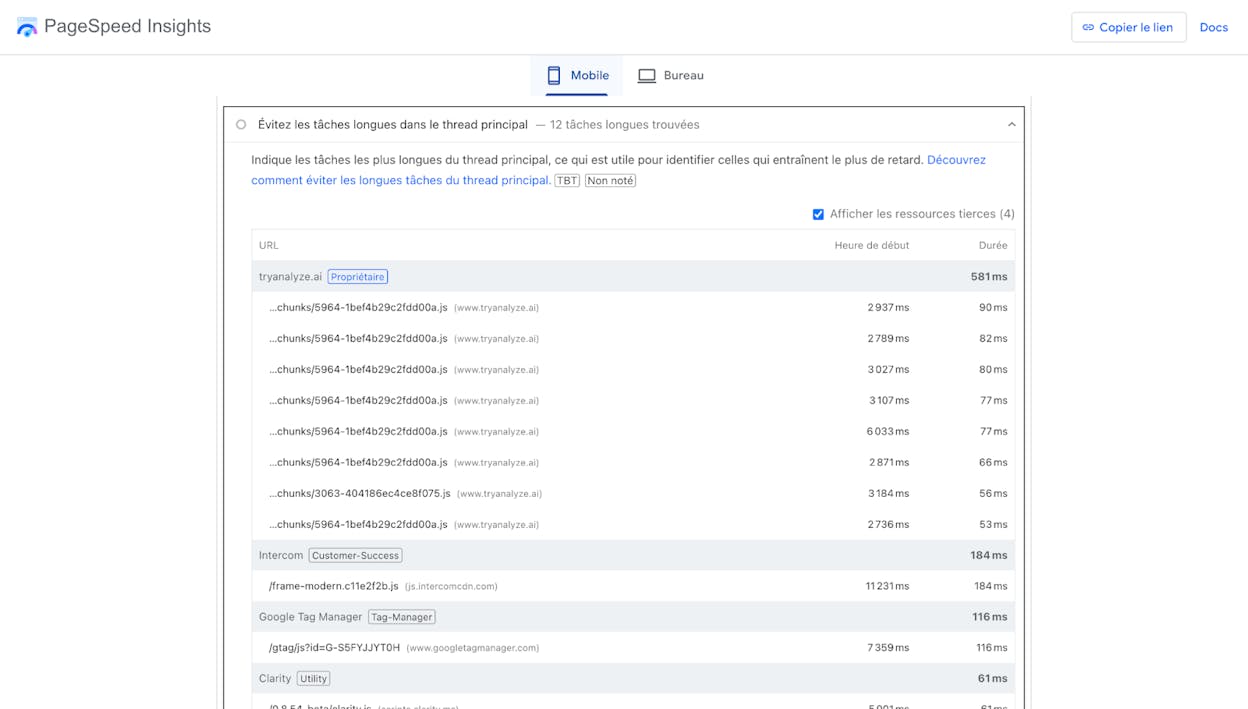
How to see CLS issues
In PageSpeed Insights:
Select the CLS tab to filter diagnostics. The key audit to look at is “Avoid large layout shifts,” which lists the exact elements causing the most shift.
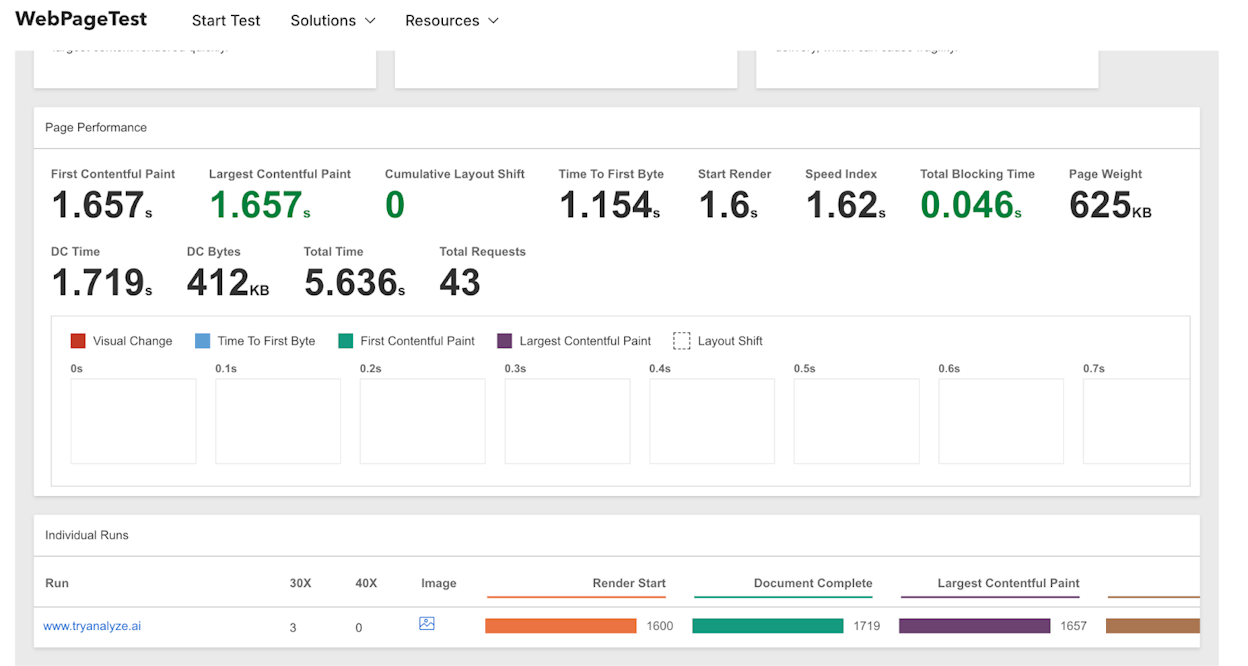
Using WebPageTest:
WebPageTest gives you a visual timeline of layout shifts:
-
Run a test on your URL.
-
Go to Filmstrip View.
-
Enable “Highlight Layout Shifts.”
-
Set thumbnail size to Huge and interval to 0.1 seconds.
You’ll see red/orange overlays highlighting exactly where and when shifts happen. This is especially useful for spotting font-related shifts — you might notice text reflowing between two consecutive 0.1-second frames as the custom font loads.
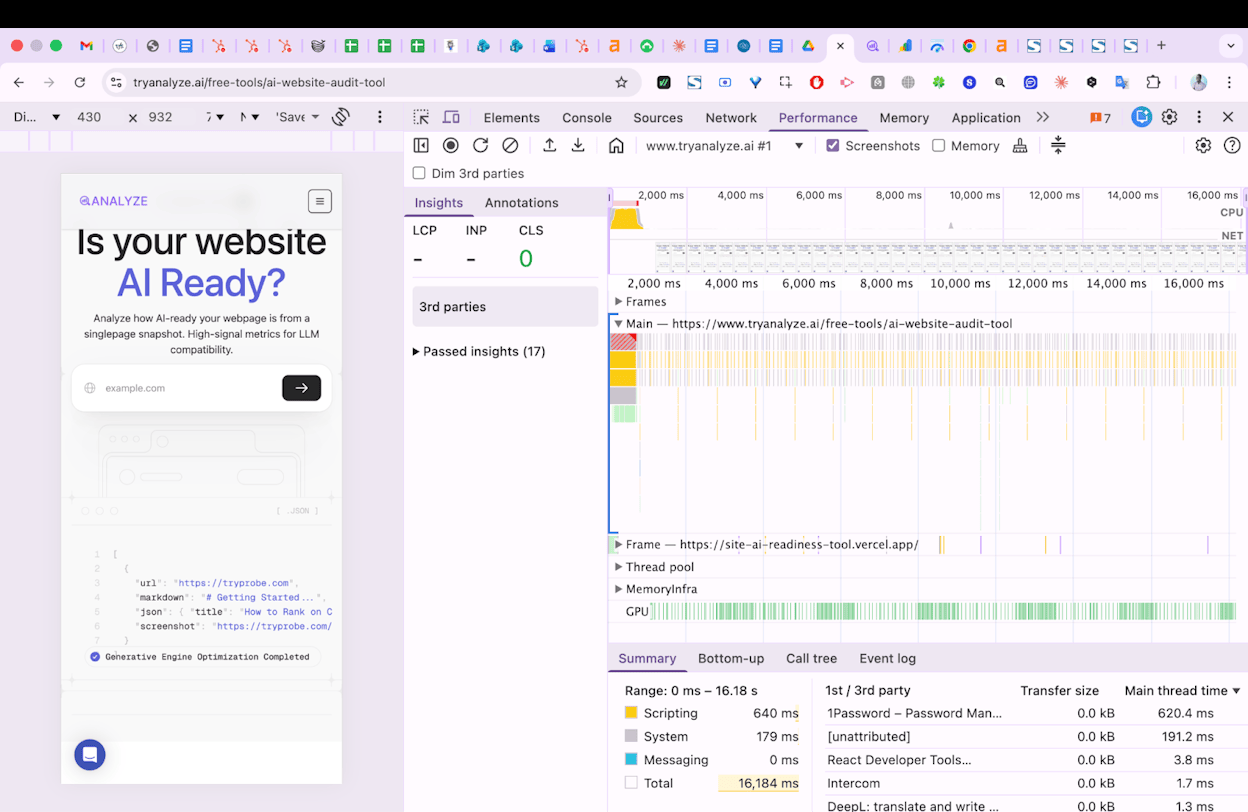
Using Chrome DevTools:
Open DevTools → Performance tab → record a page load. In the Experience section of the waterfall, look for “Layout Shift” entries. Click one to see which elements moved and by how much.
Interaction to Next Paint (INP)
Interaction to Next Paint measures how quickly your page responds to user interactions — clicks, taps, and keyboard input. It replaced First Input Delay (FID) as a Core Web Vital in March 2024.
The difference between INP and the old FID metric is significant. FID only measured the delay of the first interaction. INP tracks all interactions throughout the page’s lifetime and reports the worst one (with some outlier trimming). This means a page could pass FID easily because the first click was fast, but fail INP because a later interaction — say, opening a dropdown menu — was slow due to heavy JavaScript execution.
|
Rating |
INP Value |
|---|---|
|
Good |
≤ 200 milliseconds |
|
Needs Improvement |
> 200ms – ≤ 500ms |
|
Poor |
> 500 milliseconds |
When a user clicks a button and nothing visible happens for 300+ milliseconds, it feels broken. INP captures that exact frustration.
What causes poor INP
The root cause is almost always JavaScript competing for the browser’s main thread. The main thread handles rendering, user input processing, and JavaScript execution — all in a single queue. When a long JavaScript task is running, the browser can’t respond to user input until that task finishes.
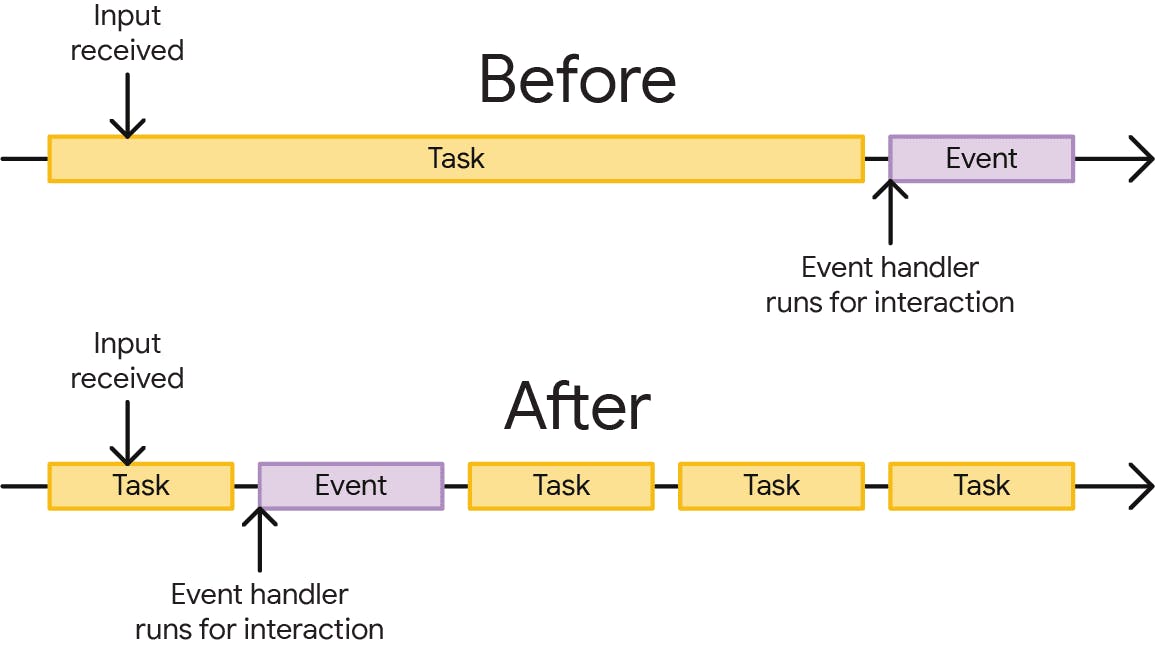
Think of it like a single-lane road. If a slow truck (a long JavaScript task) is occupying the lane, every car behind it (user interactions) has to wait. The breaks between tasks are the only opportunities for the page to process what the user wanted to do.
How to measure INP
INP is a field metric, meaning it comes from real user data. Lab tools can’t perfectly replicate it because they don’t generate real user interactions throughout a session. However, you can use Total Blocking Time (TBT) as a lab proxy — it measures the total time the main thread was blocked during page load and correlates well with INP.
In PageSpeed Insights, use the TBT tab to see related issues. Chrome DevTools’ Performance tab also shows long tasks (marked with red triangles in the waterfall) that are likely candidates for INP issues.
First Input Delay (FID) — Deprecated
First Input Delay measured the time from a user’s first interaction to when the browser could respond. FID was replaced by INP as a Core Web Vital on March 12, 2024.
FID only captured the first interaction — a click on a link, a tap on a button, text input into a field. Actions like scrolling and zooming were excluded.
You’ll still see FID data in some tools and reports, but it’s no longer used for ranking. If you’re doing CWV optimization now, focus on INP instead. It’s a stricter, more comprehensive measure of responsiveness.
How to Measure Core Web Vitals
You need both field data (from real users) and lab data (from controlled tests). They serve different purposes.
Field data vs. lab data
Field data reflects how actual visitors experience your site across real devices, network speeds, and conditions. It’s collected through CrUX and is what Google actually uses for ranking decisions. The downside: it’s a 28-day rolling average, so changes you make today won’t show up in the field data for weeks.
Lab data comes from controlled tests run under consistent conditions (same device profile, same network speed). It’s useful for diagnosing specific issues and verifying that your fixes worked before waiting for the field data to update.
|
Field Data |
Lab Data |
|
|---|---|---|
|
Source |
Real Chrome users (CrUX) |
Simulated test (Lighthouse, WebPageTest) |
|
Reflects |
Actual user experience |
Controlled benchmark |
|
Update speed |
28-day rolling average |
Instant |
|
Best for |
Measuring actual performance |
Diagnosing and testing fixes |
|
Used by Google |
Yes (for ranking) |
No |
Tools for measuring CWVs
Here are the most useful tools, organized by what they do:
Google Search Console — the best starting point. The Core Web Vitals report groups your URLs into Good, Needs Improvement, and Poor buckets. It also groups pages by template, which is useful because most fixes are template-level changes that affect many pages at once.
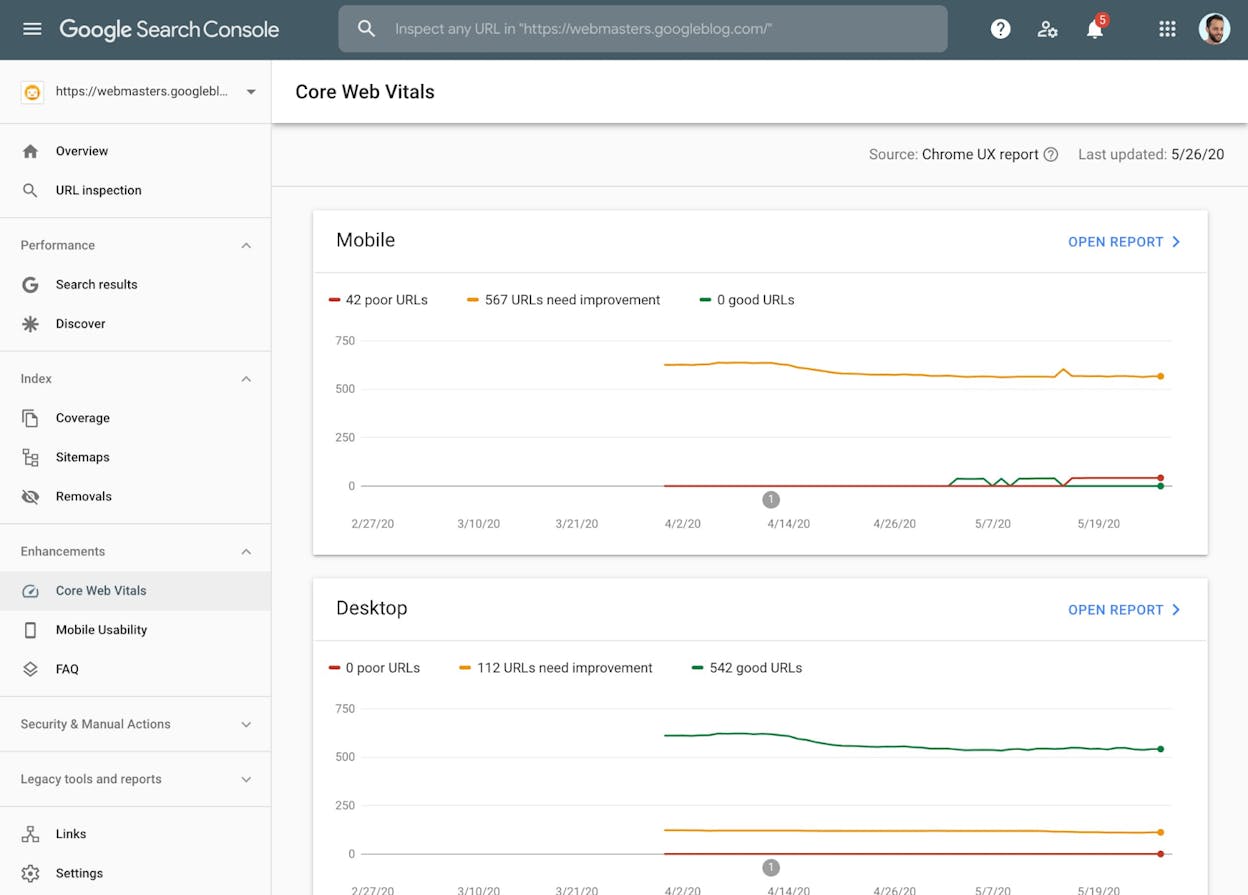
Click into a specific issue to see which URL groups are affected. This grouping is intentional — if your product pages all share the same template and that template has a CLS issue, you fix the template once and resolve the issue for all of them.
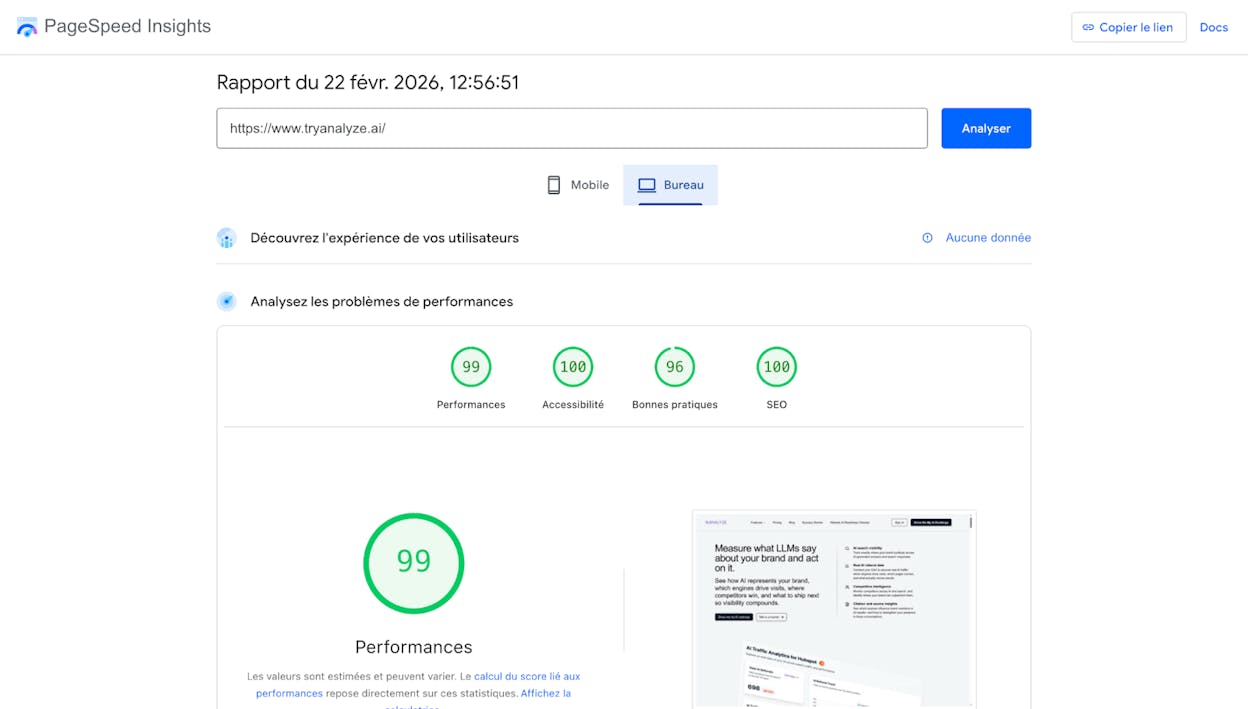
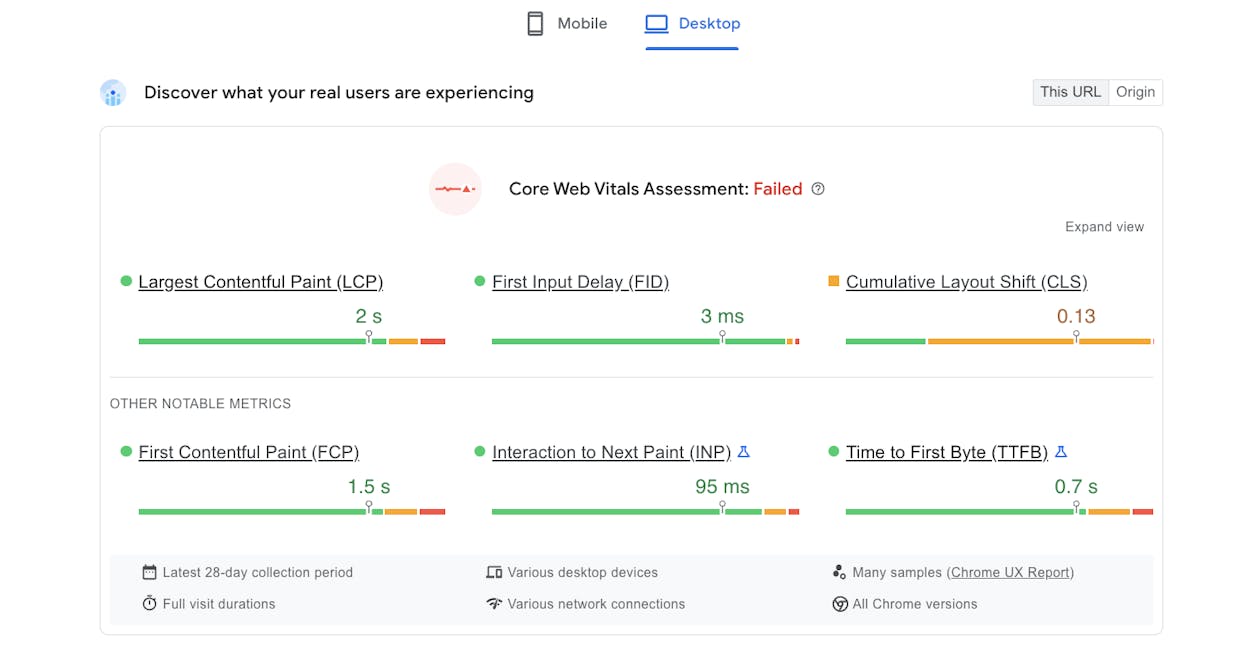
PageSpeed Insights — the most detailed single-page tool. It shows both field data (from CrUX) and lab data (from Lighthouse) on one screen. Enter a URL, and you get:
-
Real-world CWV metrics (if available for that page)
-
Origin-level CWV metrics (aggregated across your whole site)
-
Lighthouse lab scores with specific diagnostics and fix suggestions
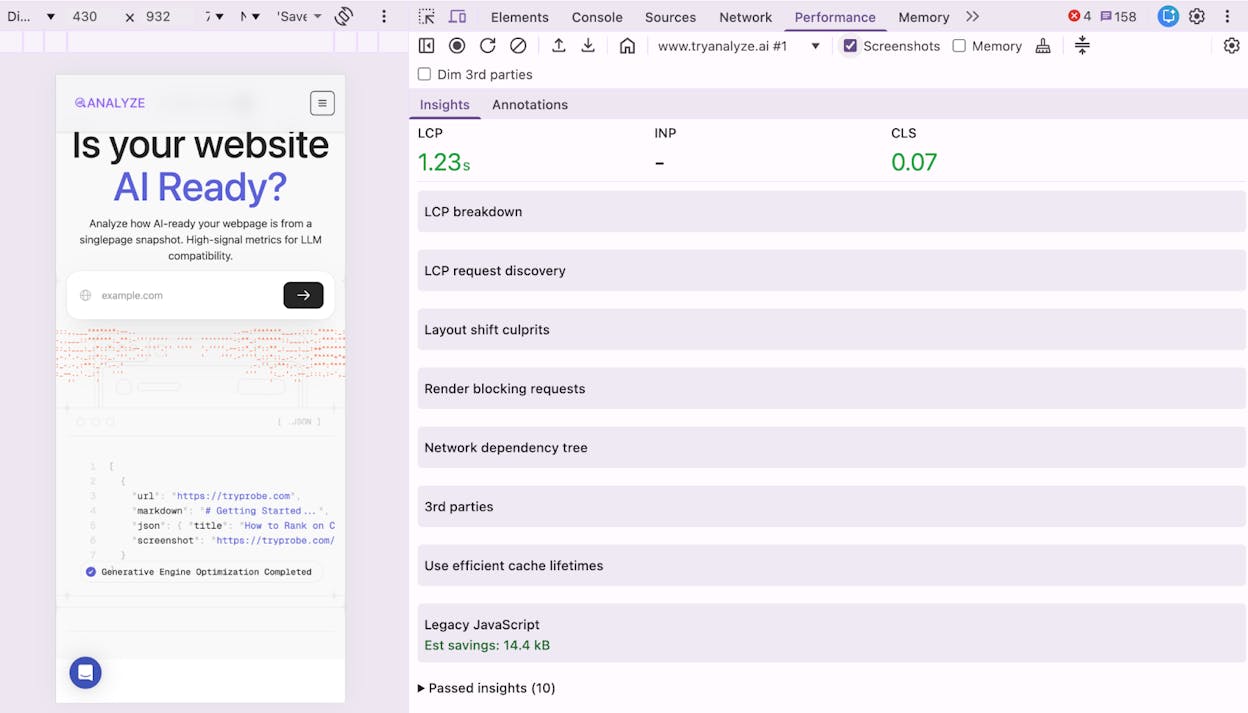
Chrome DevTools — for hands-on debugging. The Performance tab records page loads and interactions, showing you exactly which resources are loading when, which tasks are blocking the main thread, and where layout shifts occur.
WebPageTest — for detailed waterfall analysis and filmstrip comparisons. Useful for spotting layout shifts visually and comparing performance before and after changes.
Lighthouse — the engine behind PageSpeed Insights’ lab tests. You can also run it directly from Chrome DevTools (Lighthouse tab) or from the command line for automated testing.
CrUX API for data at scale
PageSpeed Insights is great for checking one page at a time. But if you manage hundreds or thousands of pages, you need the CrUX API. It returns page-level field data programmatically.
The page-level numbers are the ones Google actually uses for ranking. If a page doesn’t have enough traffic to generate its own CrUX data, Google falls back to data from a group of similar pages, or the entire origin (domain).
You can integrate the CrUX API into custom dashboards, spreadsheets, or monitoring scripts. Google provides a free API key — follow the setup instructions here.
Real User Monitoring (RUM) for immediate feedback
CrUX data lags by weeks. If you want immediate feedback on how your performance changes affect real users, set up your own Real User Monitoring. RUM tools collect performance data from your actual visitors in real time, rather than relying on CrUX’s 28-day average.
Options include the web-vitals JavaScript library (free, from Google), or commercial RUM tools like SpeedCurve, Calibre, or Datadog.
Here’s the simplest way to start collecting your own CWV data using Google’s web-vitals library:
<script type="module">
import {onLCP, onINP, onCLS} from 'https://unpkg.com/web-vitals@4?module';
function sendToAnalytics(metric) {
console.log(metric.name, metric.value);
// Replace with your analytics endpoint
}
onLCP(sendToAnalytics);
onINP(sendToAnalytics);
onCLS(sendToAnalytics);
</script>
This sends LCP, INP, and CLS values to your console (or analytics endpoint) for every visitor. You’ll see results within hours instead of weeks.
How to Improve Core Web Vitals
Each metric requires different fixes. Here’s what to do for each one, in order of impact.
How to improve LCP
LCP is the hardest metric to fix because it depends on the entire loading chain — from server response to resource download to rendering. Work through these steps in order, starting with the highest-impact fixes.
Step 1: Reduce server response time (TTFB).
Time to First Byte should be under 800ms. If it’s not, your server is the bottleneck — no amount of front-end optimization will overcome a slow backend.
-
Use a CDN to serve content from edge servers close to your users. Cloudflare, AWS CloudFront, and Fastly are solid options.
-
Enable server-side caching so your server doesn’t regenerate the same HTML for every request.
-
If you’re on shared hosting, consider upgrading. Shared hosts can be slow during peak times because you’re competing with other sites on the same server.
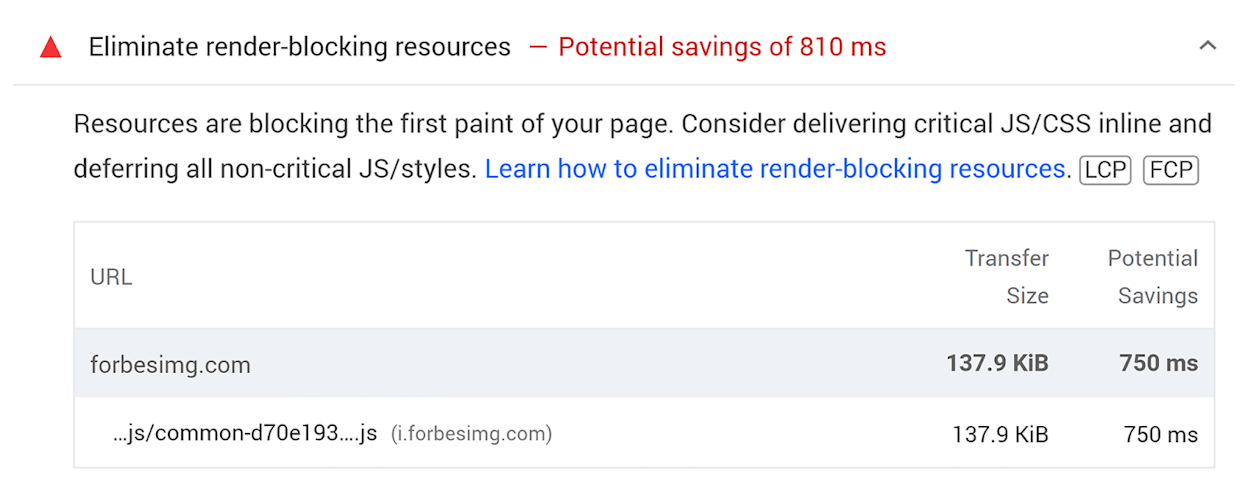
Step 2: Eliminate render-blocking resources.
Every CSS or JavaScript file in the <head> that the browser must download and parse before it can render the page adds delay.
-
Inline critical CSS (the CSS needed for above-the-fold content) directly into the <head>.
-
Load non-critical CSS asynchronously using media="print" with an onload handler to switch it to media="all".
-
Add defer or async to JavaScript files in the <head>. Use defer for scripts that depend on the DOM; async for independent scripts like analytics.
Step 3: Optimize the LCP element itself.
Once you’ve identified your LCP element (see above), make it load as fast as possible:
-
If it’s an image, compress it. Use modern formats like WebP or AVIF. A hero image that’s 2MB in PNG can often be reduced to 200KB in WebP with no visible quality loss.
-
Add fetchpriority="high" to your LCP image tag so the browser prioritizes downloading it over other images.
-
Add a <link rel="preload"> tag for the LCP image in your <head> if it’s referenced in CSS (like a background image) rather than in an <img> tag.
-
Remove lazy loading from the LCP image. Lazy loading tells the browser to delay the image download, which is the opposite of what you want for your most important visual element.
<!-- Preload the LCP image -->
<link rel="preload" as="image" href="/hero-image.webp" fetchpriority="high">
<!-- LCP image tag — no lazy loading, explicit priority -->
<img src="/hero-image.webp" alt="Description" width="1200" height="600" fetchpriority="high">
Step 4: Avoid client-side rendering for critical content.
If your page uses a JavaScript framework (React, Vue, Angular) and renders content client-side, the browser has to download JavaScript, parse it, execute it, fetch data from an API, then render the HTML. That’s a lot of steps before the user sees anything.
Use server-side rendering (SSR) or static site generation (SSG) to deliver pre-rendered HTML. The browser can paint the page immediately, and JavaScript can enhance it afterward (hydration).
How to improve CLS
CLS fixes are usually straightforward once you identify the shifting elements.
Step 1: Set explicit dimensions on all media.
Add width and height attributes to every <img>, <video>, and <iframe> element. This lets the browser reserve the correct amount of space before the resource loads, preventing layout shifts.
<!-- Good — browser reserves space -->
<img src="photo.webp" width="800" height="450" alt="Description">
<!-- Bad — browser allocates zero space, then shifts layout when image loads -->
<img src="photo.webp" alt="Description">
For responsive images, you can use CSS aspect-ratio instead of fixed dimensions:
img {
aspect-ratio: 16 / 9;
width: 100%;
height: auto;
}
Step 2: Reserve space for ads and embeds.
If you use display ads, wrap each ad slot in a container with a fixed minimum height matching the expected ad size. This prevents the “ad expansion” shift.
.ad-slot {
min-height: 250px; /* Match your ad unit size */
width: 300px;
}
Step 3: Optimize font loading.
Custom fonts can cause layout shifts when they swap with fallback fonts. Use font-display: swap to show the fallback font immediately, then swap in the custom font when it’s ready. Combine this with <link rel="preload"> to start downloading fonts early:
<link rel="preload" href="/fonts/custom-font.woff2" as="font" type="font/woff2" crossorigin>
For an even smoother experience, use the CSS size-adjust property on your @font-face declaration to make the fallback font match the custom font’s dimensions as closely as possible. This minimizes the visible reflow when the swap happens.
Step 4: Avoid inserting content above existing content.
If you’re injecting banners, cookie notices, or notification bars at the top of the page, push them above the viewport or use CSS transforms (which don’t trigger layout shifts) instead of changing element positions.
Step 5: Enable bfcache (back/forward cache).
When a user navigates back to a page, bfcache can restore it instantly from memory. Pages restored from bfcache have zero CLS because they’re already fully rendered. Make sure your pages are eligible for bfcache by avoiding Cache-Control: no-store on your main document and not using unload event listeners.
How to improve INP
INP problems are caused by JavaScript blocking the main thread. Fixing them often requires working with developers, but here’s where to start.
Step 1: Identify long tasks.
Open Chrome DevTools → Performance tab → record a page load and interact with the page. Look for tasks marked with red triangles in the Main thread track — these are “long tasks” (over 50ms) that block user interactions.
Step 2: Reduce JavaScript bundle size.
Large JavaScript bundles take longer to download and execute. Use your bundler’s analysis tools (like Webpack Bundle Analyzer) to find heavy dependencies you can replace or remove. Tree-shaking can eliminate unused code.
Step 3: Break up long tasks.
If you can’t eliminate a long-running script, break it into smaller chunks using requestIdleCallback() or setTimeout() to yield back to the browser between chunks. This gives the browser opportunities to process user input.
// Instead of one long task
function processAllItems(items) {
items.forEach(item => process(item)); // Blocks until done
}
// Break into chunks that yield to the browser
function processItemsInChunks(items, chunkSize = 50) {
let index = 0;
function processChunk() {
const end = Math.min(index + chunkSize, items.length);
for (let i = index; i < end; i++) {
process(items[i]);
}
index = end;
if (index < items.length) {
setTimeout(processChunk, 0); // Yield to browser
}
}
processChunk();
}
Step 4: Defer non-critical JavaScript.
Analytics scripts, chat widgets, A/B testing tools, and third-party tags don’t need to load immediately. Load them after the page is interactive using defer, dynamic import(), or by delaying their execution until user interaction.
Step 5: Use web workers for heavy computation.
If your page does significant data processing (filtering large lists, parsing data), offload that work to a Web Worker. Web Workers run on a separate thread and don’t block the main thread.
Why Core Web Vitals Matter for AI Search
Here’s something most CWV guides don’t cover: page performance affects your visibility in AI search engines, not just Google.
AI answer engines like ChatGPT, Perplexity, Claude, and Gemini pull information from web sources to generate responses. These models — and the systems that feed them — need to crawl, parse, and extract content from your pages. When your pages are fast and well-structured, they’re easier for AI systems to process.
There are three specific ways CWVs connect to AI search visibility:
-
Fast pages get crawled more efficiently. Crawl budgets apply to AI systems just as they do to Googlebot. If your pages are slow, AI crawlers will index fewer of them in the same time window. A slow TTFB or heavy JavaScript rendering can mean your pages simply aren’t making it into the training and retrieval datasets these models rely on.
-
Clean HTML structure helps AI extract accurate information. CLS issues often stem from JavaScript-injected content and messy DOM structures. The same structural problems that cause layout shifts can make it harder for AI parsers to identify your main content, headings, and key information. Pages with clean, semantic HTML — a natural byproduct of CWV optimization — tend to be more parseable by both search engines and AI models.
-
Well-performing pages tend to be well-structured pages. Sites that pass CWV checks typically have clean code, fast servers, optimized images, and semantic HTML. These are the same qualities that make content citable by AI search engines. It’s not that CWVs directly cause AI citations — it’s that the discipline of performance optimization overlaps heavily with what makes content accessible to AI systems.
How to track the AI search traffic connection
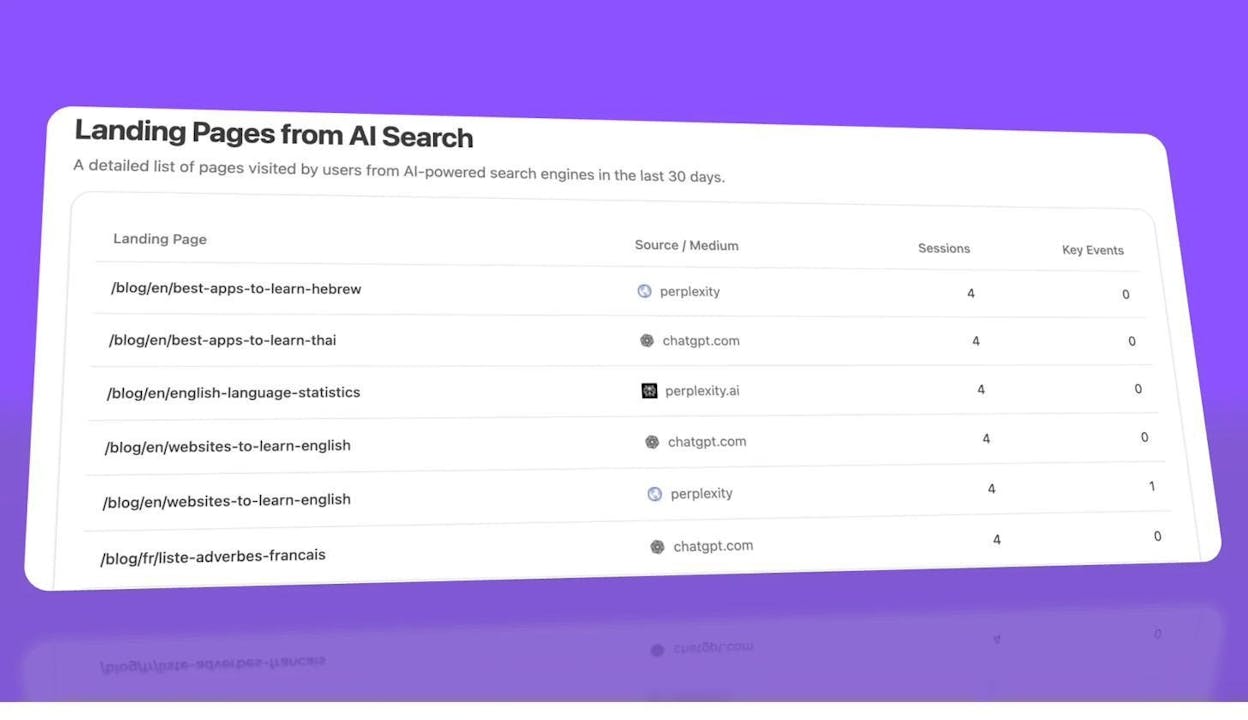
If you’re investing time in CWV improvements, you should measure whether those improvements correlate with increased AI referral traffic. Analyze AI connects to your GA4 data and shows exactly which pages receive traffic from AI search engines like ChatGPT, Perplexity, Claude, Copilot, and Gemini.
Here’s a practical approach:
-
Before starting CWV work, log into Analyze AI and note your baseline AI referral traffic and which landing pages are receiving it.
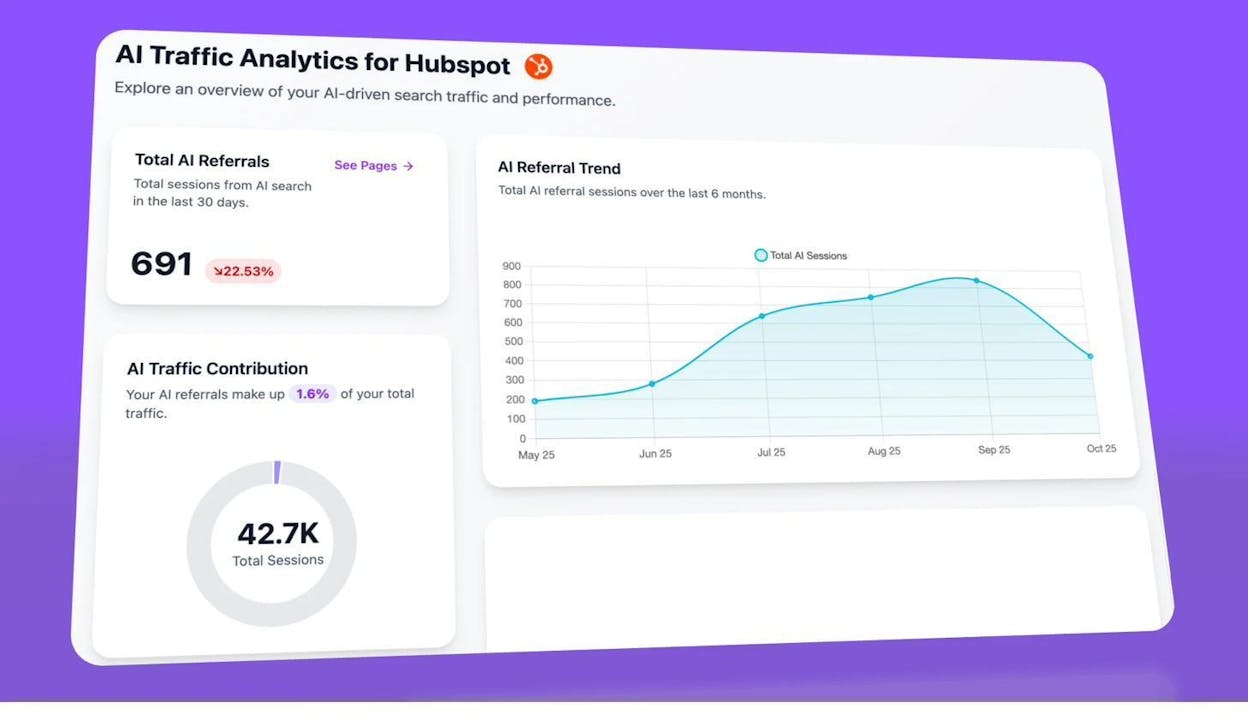
2. After implementing fixes, monitor the AI Traffic by Page report to see if the improved pages start receiving more AI referrals. Look for patterns — do pages with good CWVs consistently get more AI traffic than slower pages?
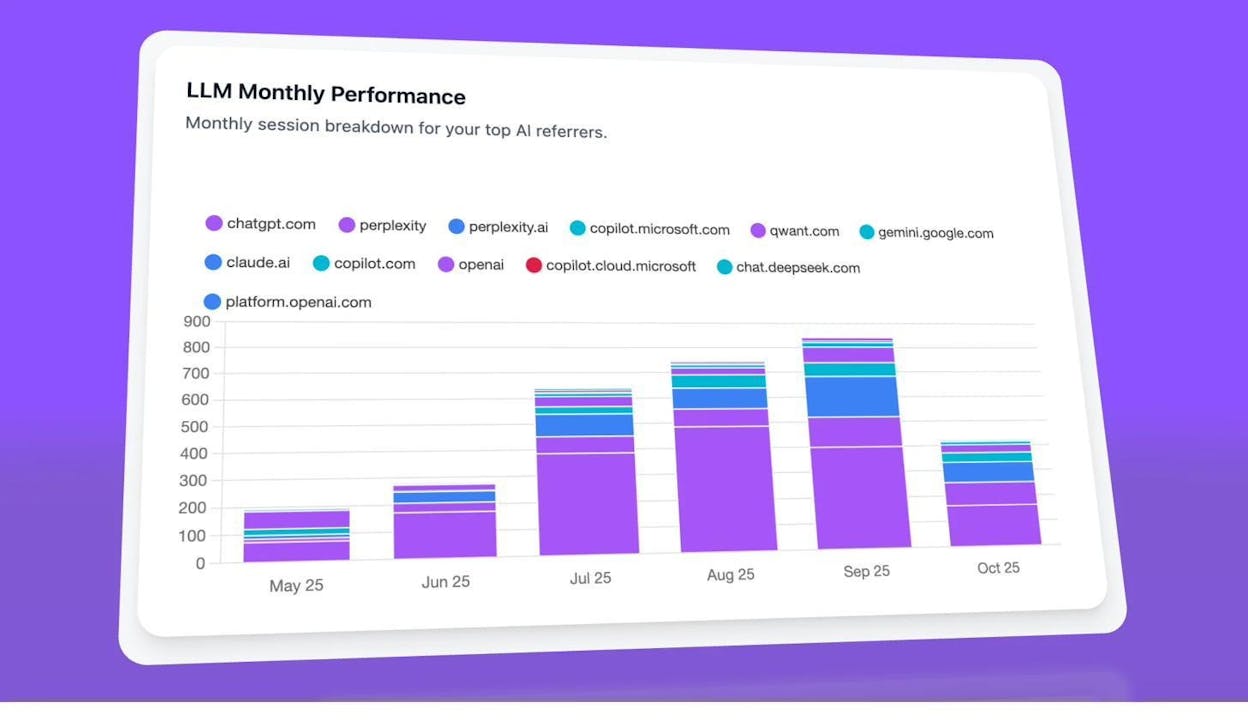
3. Use the Analytics by Engine view to see which AI engines are sending the most traffic, and whether that mix changes after performance improvements.
This doesn’t prove causation — many factors influence AI citations. But it gives you a data-driven way to see whether performance improvements coincide with AI visibility gains, rather than guessing.
You can also use Analyze AI’s citation analytics to check whether the pages you’ve optimized are being cited more often in AI responses. If a page moved from “Poor” CWVs to “Good” and also started showing up in more AI-generated answers, that’s a signal worth investigating.
Are Core Web Vitals Important for SEO?
Here’s the honest answer: Core Web Vitals are not a major ranking factor. They are a lightweight signal — closer to a tiebreaker than a game-changer.
Google has over 200 ranking signals, and Google’s own representatives have consistently described CWVs as minor. At Pubcon in September 2023, Google’s Gary Illyes stated that most sites won’t see a meaningful benefit from working on Core Web Vitals. Google’s John Mueller has described the ranking boost as something that applies within a narrow band — it might nudge you up among pages that are otherwise equal in quality and relevance, but it won’t overcome weak content or poor backlinks.
This doesn’t mean you should ignore CWVs. It means you should size the effort appropriately:
If your CWVs are in the “Poor” range, fixing them is worth the investment. Poor performance can actively hurt user experience, increase bounce rates, and cause you to lose data in analytics (slow pages often fail to fire tracking scripts). You’re leaving real money on the table.
If your CWVs are in the “Needs Improvement” range, the ROI of fixing them depends on your competitive landscape. If you’re in a highly competitive niche where you and your competitors have similar content quality and backlink profiles, the CWV tiebreaker could make a difference. Otherwise, your time is better spent on content and links.
If your CWVs are already “Good”, don’t over-invest in making them even better. There’s no evidence that a 1.5-second LCP ranks better than a 2.4-second LCP — both are in the “Good” range and are treated the same.
There’s also a correlation-versus-causation issue with CWV studies. Several studies have found that sites with good CWVs tend to rank higher, but this is likely because sites that invest in performance also invest in everything else — content quality, technical SEO, link building, user experience. It’s like observing that companies with nice office furniture tend to have higher revenue. The furniture isn’t causing the revenue; both are symptoms of a well-resourced operation.
The user experience argument
The stronger case for CWV optimization isn’t SEO — it’s user experience and conversions.
Slow pages lose visitors. Google’s own research has found that sites improving CWVs see measurable gains in engagement and conversions. A page that loads in 1.5 seconds converts better than one that loads in 4 seconds, regardless of its search ranking.
There’s also a measurement artifact worth knowing: slow pages often fail to fully load analytics tracking scripts. When you speed up your pages, your analytics may show what looks like a traffic increase, but it’s actually just your tracking working properly for the first time. You’re not getting more visitors — you’re finally counting the ones you already had.
Quick Facts About Core Web Vitals
CWVs are split by device type. Mobile metrics are used for mobile rankings, and desktop metrics are used for desktop rankings. You need to pass both if you want optimal performance across all searches. Many sites pass desktop but fail mobile because mobile devices have less processing power and often use slower network connections.
The 75th percentile rule means outliers can fail you. Your page is assessed at the 75th percentile of user experiences. If even 26% of your visitors have a slow experience, your page fails that metric. This is why performance on low-end mobile devices and slow connections matters — those visitors pull your percentile down.
Not every page has its own CrUX data. In a study by Ahrefs looking at over 42 million pages, only 11.4% had page-level CrUX metrics. If your page doesn’t have enough traffic to generate individual data, Google uses metrics from a group of similar pages or from the entire origin (domain). This means your slow pages can drag down the CWV scores of your low-traffic pages.
The metrics are evolving. Google has already replaced FID with INP, changed how CLS is measured, and adjusted thresholds over time. More changes are likely. Keep an eye on web.dev/vitals for updates.
Single Page Applications (SPAs) have measurement gaps. SPAs that use client-side navigation (like React Router) don’t trigger new page loads when users navigate between views. This means LCP and CLS may not be measured on navigation between routes. Google is aware of this limitation and is working on solutions, but for now, SPAs should pay extra attention to initial page load performance.
CWVs don’t account for total page size. You can technically pass all three CWV checks and still have a 10MB page. This is because CWVs measure perceived performance (how fast the visible content loads and responds), not total data transfer. However, large pages still hurt users on metered connections and slow devices, so page weight is worth optimizing separately.
AMP is no longer required for Top Stories. Google removed AMP as a requirement for the Top Stories carousel when it introduced Core Web Vitals. Any page that passes the CWV thresholds can appear in Top Stories, regardless of whether it uses AMP.
A Practical CWV Improvement Workflow
Here’s the process to follow if you’re tackling Core Web Vitals from scratch:
-
Audit your current state. Start in Google Search Console’s Core Web Vitals report. Look at the breakdown of Good, Needs Improvement, and Poor URLs for both mobile and desktop.
-
Prioritize by template. Don’t fix pages one at a time. Identify which page templates (product pages, blog posts, category pages) have the most failing URLs. Fix the template, and you fix all pages using it.
-
Run PageSpeed Insights on a representative URL from each failing template. Note the specific diagnostics for each metric. Focus on the highest-impact opportunities first (they’re listed in order of estimated impact).
-
Fix LCP first, then CLS, then INP. LCP affects the most URLs and has the most straightforward fixes (image optimization, server speed, render-blocking resources). CLS is usually a quick win (adding dimensions to images). INP is the most complex because it often requires JavaScript refactoring.
-
Verify with lab tests. After implementing each fix, re-run PageSpeed Insights or Lighthouse to confirm the lab scores improved.
-
Wait for field data. Give it 28 days for CrUX data to reflect your changes. Check Google Search Console for the updated status.
-
Monitor ongoing performance. Set up alerts for CWV regressions. New code deployments, ad network changes, or third-party script updates can undo your improvements. Tools like SpeedCurve or a custom RUM setup can alert you to performance drops.
Work with your developers
Page speed optimization can be extremely complex. If you’re not a developer, work closely with your engineering team — they understand the codebase and can implement fixes far more effectively than generic advice can account for.
If you don’t have developer support, WordPress users can rely on performance plugins like WP Rocket or Autoptimize to handle the most common optimizations automatically. These won’t fix everything, but they’ll cover the basics: caching, image optimization, script deferral, and CSS delivery.
Track the impact across both channels
As you improve Core Web Vitals, track the results in both traditional search and AI search:
-
In Google Search Console, monitor your CWV report and compare organic traffic before and after improvements.
-
In Analyze AI, check whether the same pages that improved in CWVs are gaining more AI referral sessions. Use the landing pages report to see which optimized pages are getting picked up by AI engines.
This dual tracking gives you a complete picture of how performance improvements affect your visibility across the full organic landscape — both traditional search and the emerging AI search channel.
Additional Resources
If you want to go deeper on specific metrics, these are the most useful references:
-
web.dev Core Web Vitals documentation — Google’s official guide with detailed technical explanations
-
Chrome User Experience Report (CrUX) documentation — how to access and use field data
-
PageSpeed Insights — test any URL for free
-
WebPageTest — advanced performance testing with filmstrip and waterfall views
-
web-vitals JavaScript library — collect your own CWV data from real users
-
Analyze AI’s free website traffic checker — check any site’s traffic estimates
-
Analyze AI’s SEO audit tools guide — tools that include CWV analysis
-
Analyze AI’s website monitoring tools guide — comprehensive list of monitoring solutions
If you’re also working on the content quality side of your SEO strategy, don’t neglect the technical foundation. The best content in the world won’t perform if the page it lives on is slow, unstable, or unresponsive. And increasingly, the same technical quality that helps you rank in Google is the same quality that makes your content citable by AI search engines.
Ernest
Ibrahim


