


Summarize this blog post with:
In this article, you’ll get a clear breakdown of 16 website monitoring tools across uptime, performance, full-stack observability, and AI search visibility. You’ll learn what each tool does best, where it falls short, and which one fits your stack. You’ll also learn why traditional monitoring tools leave a growing gap in how you track the traffic that comes from AI answer engines, and how to close it.
Here is the full lineup.
|
Tool |
Best for |
Starting price |
|---|---|---|
|
AI search visibility, traffic attribution, content ops, and competitive intelligence |
See pricing |
|
|
Simple, budget-friendly uptime checks |
Free (50 monitors) / $9/mo paid |
|
|
Performance + real-user insight + transaction flows |
From ~$15/mo |
|
|
All-in-one basic website and server checks |
Free / paid from ~$20/mo |
|
|
Full-stack web and API synthetic monitoring |
From ~$16/mo |
|
|
Full-stack web, infra, and app monitoring |
From ~$9/mo |
|
|
Uptime, transactions, APIs, and RUM |
From ~$30/mo |
|
|
Lightweight uptime and blacklist monitoring |
Free / paid from ~$10/mo |
|
|
Site health, broken links, SSL, and status pages |
From ~$12/mo |
|
|
Flexible synthetic + API checks on a budget |
From ~$2/monitor/mo |
|
|
Full-stack observability with RUM + synthetics |
Usage-based (expensive at scale) |
|
|
Full-stack digital experience with DEM + synthetics |
Free tier / usage-based paid |
|
|
AI-driven full-stack observability |
Enterprise pricing |
|
|
Enterprise-level synthetic and infra observability |
Enterprise pricing |
|
|
Incident response, on-call, and uptime workflows |
Free / from ~$24/mo |
|
|
Free or ultra-budget uptime alerts |
Free (50 monitors) |
Table of Contents
Analyze AI: best for AI search visibility, traffic attribution, and content operations
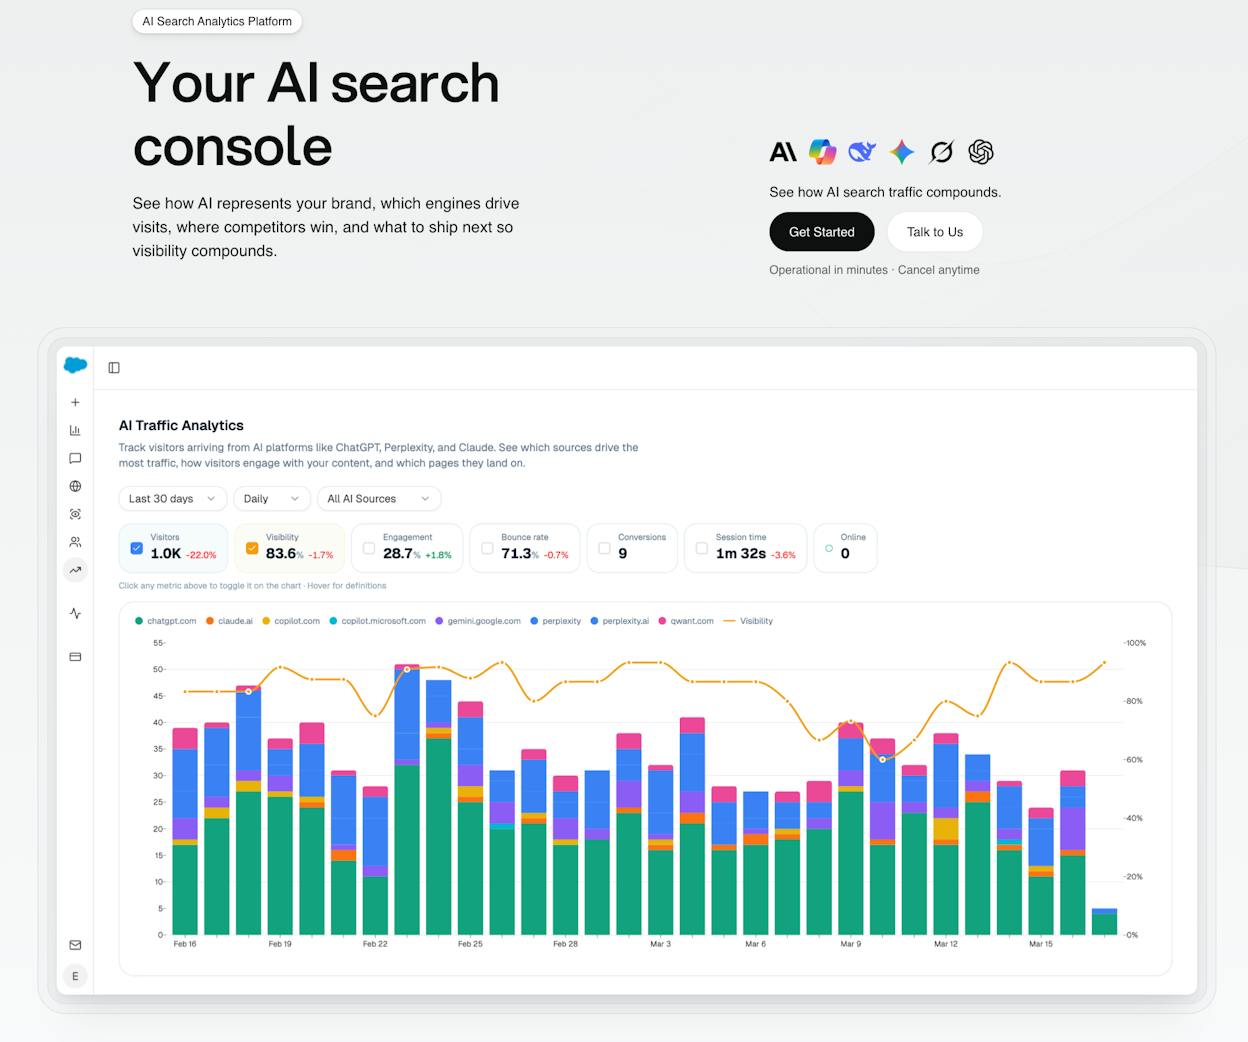
Most monitoring tools tell you whether your site is up. Analyze AI tells you whether AI answer engines are sending traffic, which pages convert that traffic, who your competitors are in AI results, and what content you need to fix.
This is not an uptime tool. It is the agentic platform for SEO, AEO, content, and GTM ops that connects AI search visibility to revenue. If you run a SaaS company, an agency, or any digital brand that depends on organic traffic, this is the layer your monitoring stack is missing.
See real AI traffic by engine
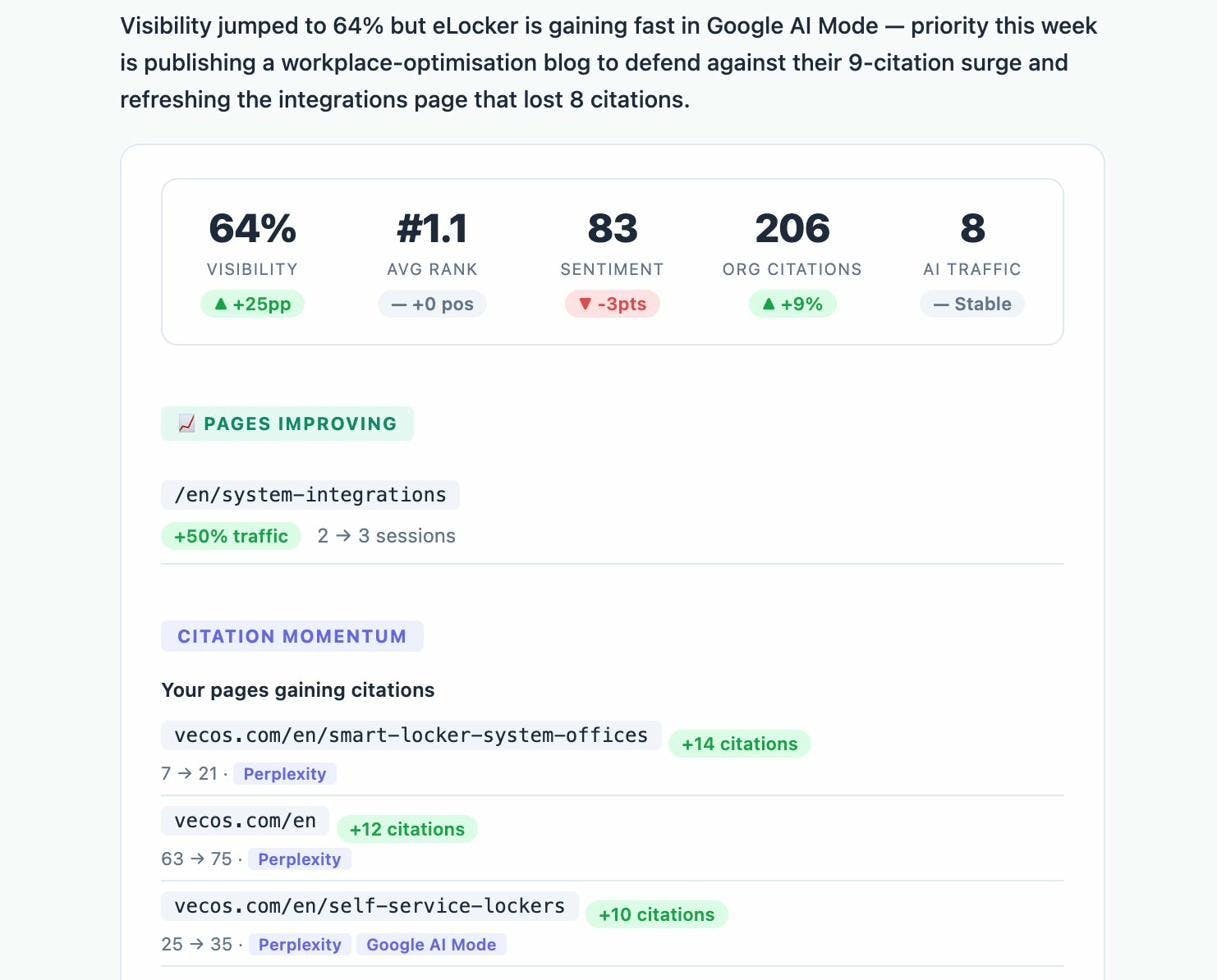
Analyze AI’s AI Traffic Analytics attributes every session from ChatGPT, Perplexity, Claude, Copilot, and Gemini to its source engine. You see session volume, engagement, bounce rate, conversions, and trends over time. No guessing. No stitching together UTM parameters manually.
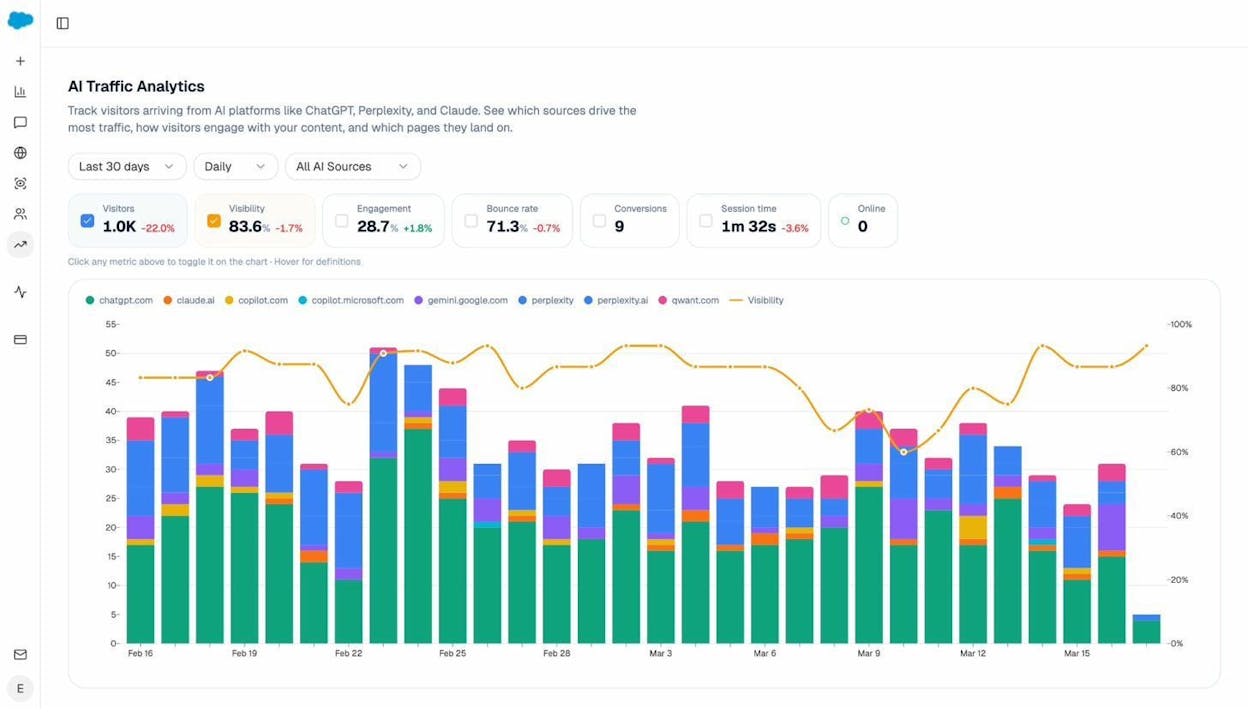
The Landing Pages report shows you exactly which pages receive AI-referred visits, which engine sent each session, and what those visitors did next. If your product comparison page gets 50 sessions from Perplexity and converts 12% to trials while an old blog post gets 40 sessions from ChatGPT with zero conversions, you know where to invest.
Track prompts and competitive positioning
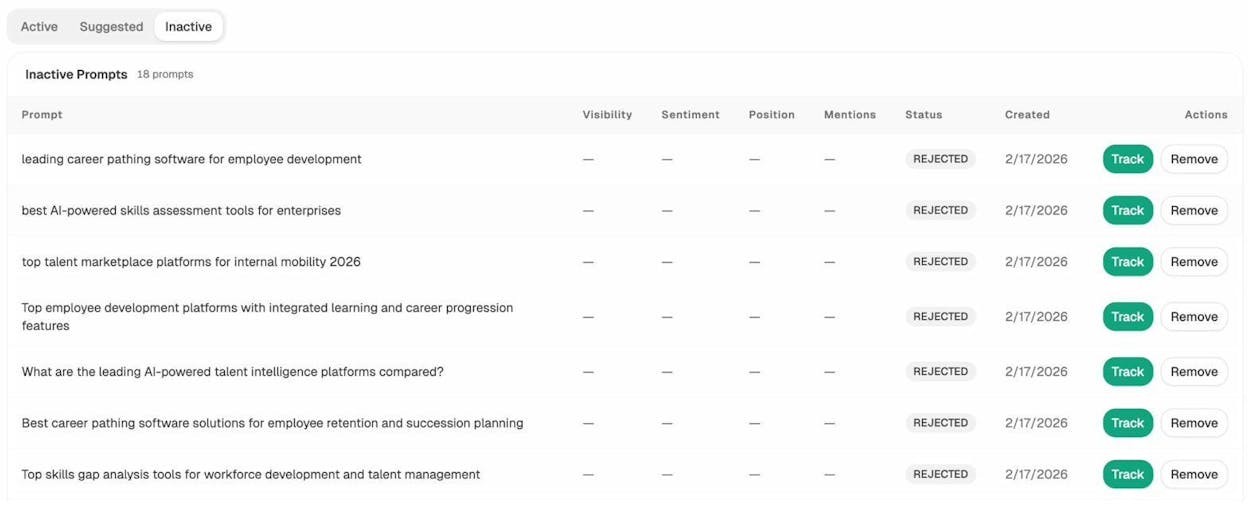
Prompt tracking monitors your brand’s visibility across specific buyer prompts. For each prompt, you see your visibility percentage, your position relative to competitors, and sentiment.
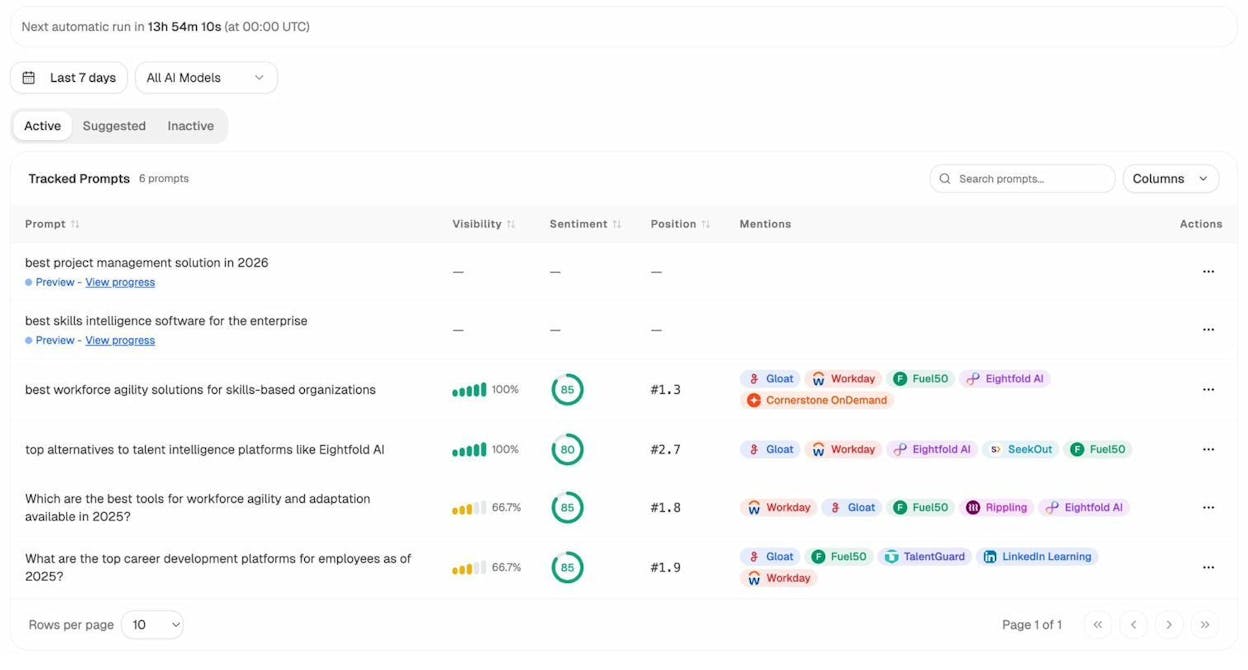
You can also see which competitors appear alongside you, how your position shifts daily, and whether sentiment is trending up or down. Don’t know which prompts to track? Analyze AI’s prompt suggestion feature surfaces the bottom-of-funnel prompts that actually drive buying decisions.
Audit citations and find competitive gaps
Citation analytics reveals which domains and URLs AI models cite when answering questions in your category. You see usage count per source, which models reference each domain, and when those citations first appeared.
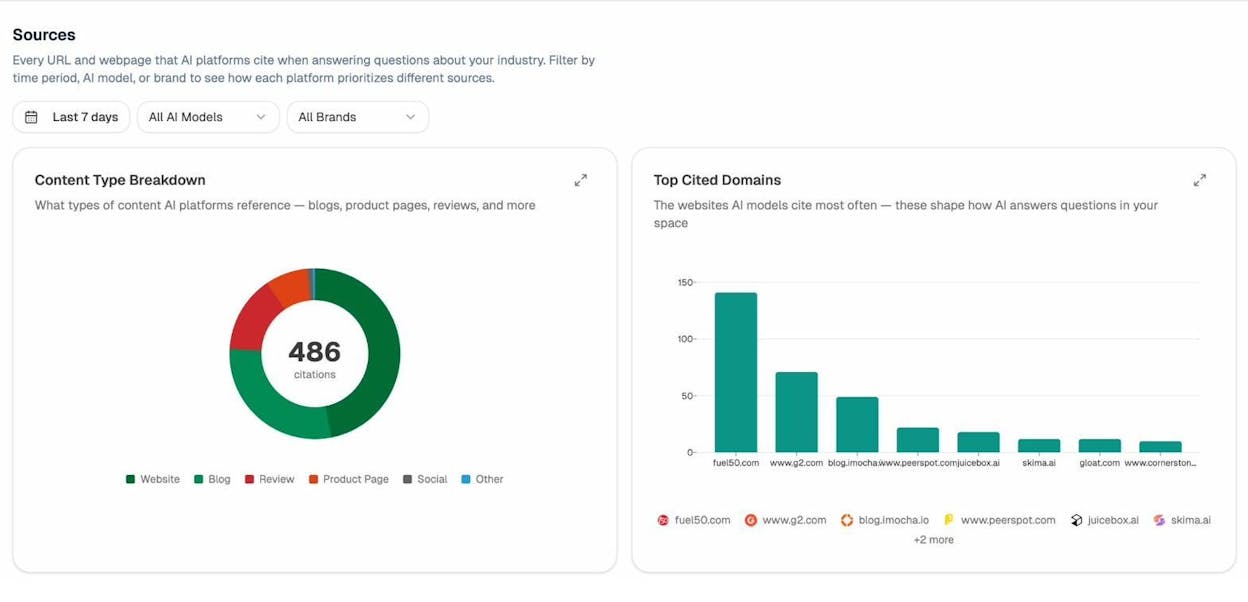
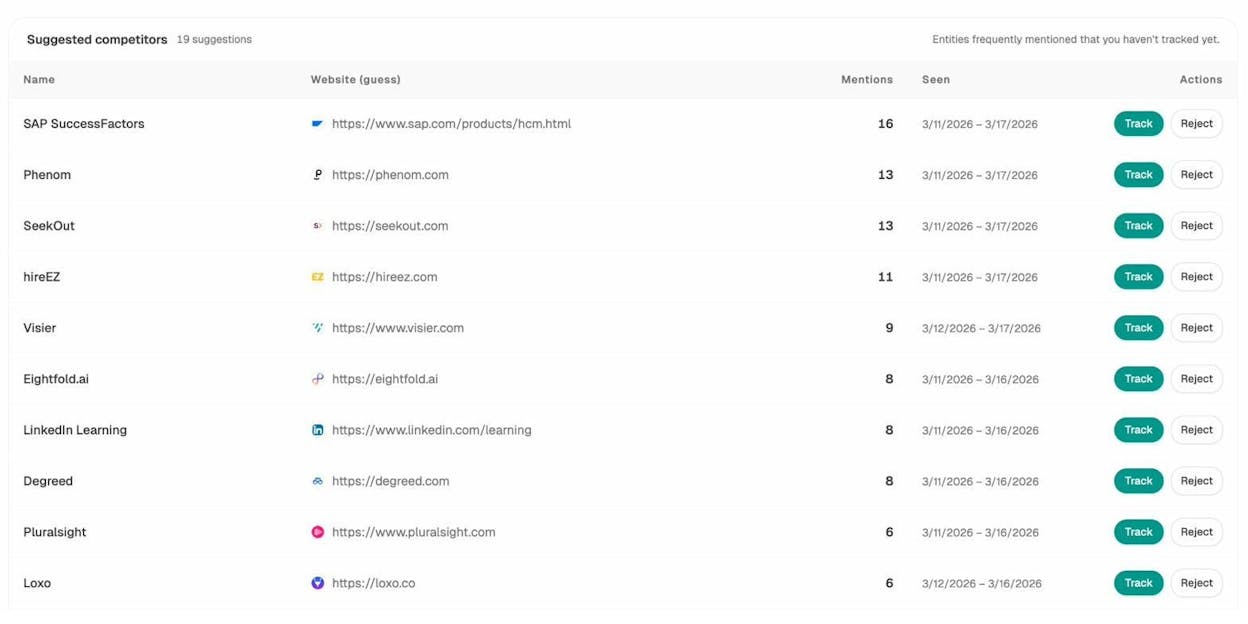
Competitor intelligence surfaces brands you did not know you were competing against in AI answers. It shows suggested competitors based on how often they appear alongside your brand, so you can track them or dismiss them.
This is the foundation for building authority where AI actually looks. Instead of generic link building, you target the specific sources that shape AI answers.
Write and optimize content that gets cited
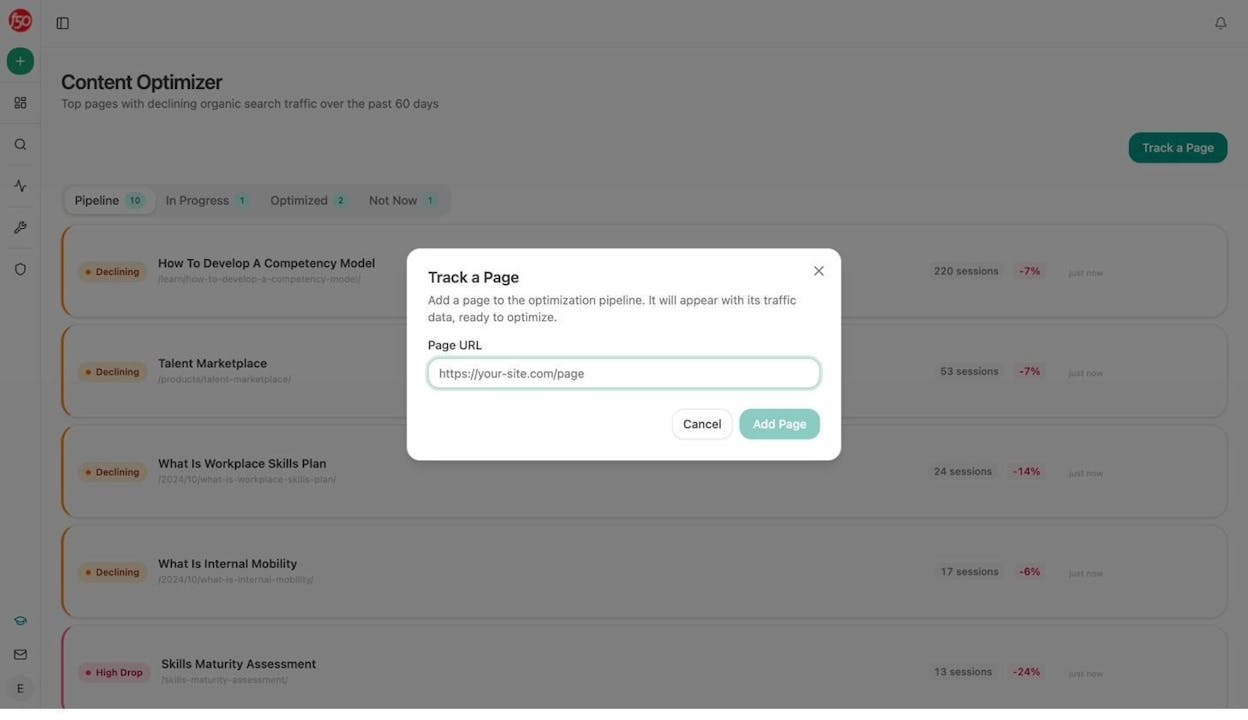
Analyze AI is not just a monitoring dashboard. Its AI Content Writer researches your topic, builds an outline grounded in what AI models cite, and produces full drafts with your brand voice injected from the Knowledge Base. The AI Content Optimizer fetches your existing content, scores it on argument flow and clarity, highlights gaps based on what competitors rank for, and outputs a rewritten draft with tracked changes.
Both tools produce better outputs than most standalone AI writers because they pull from your real visibility data, competitor content, and brand guidelines during generation. They do not just rewrite existing text. They build content from research.
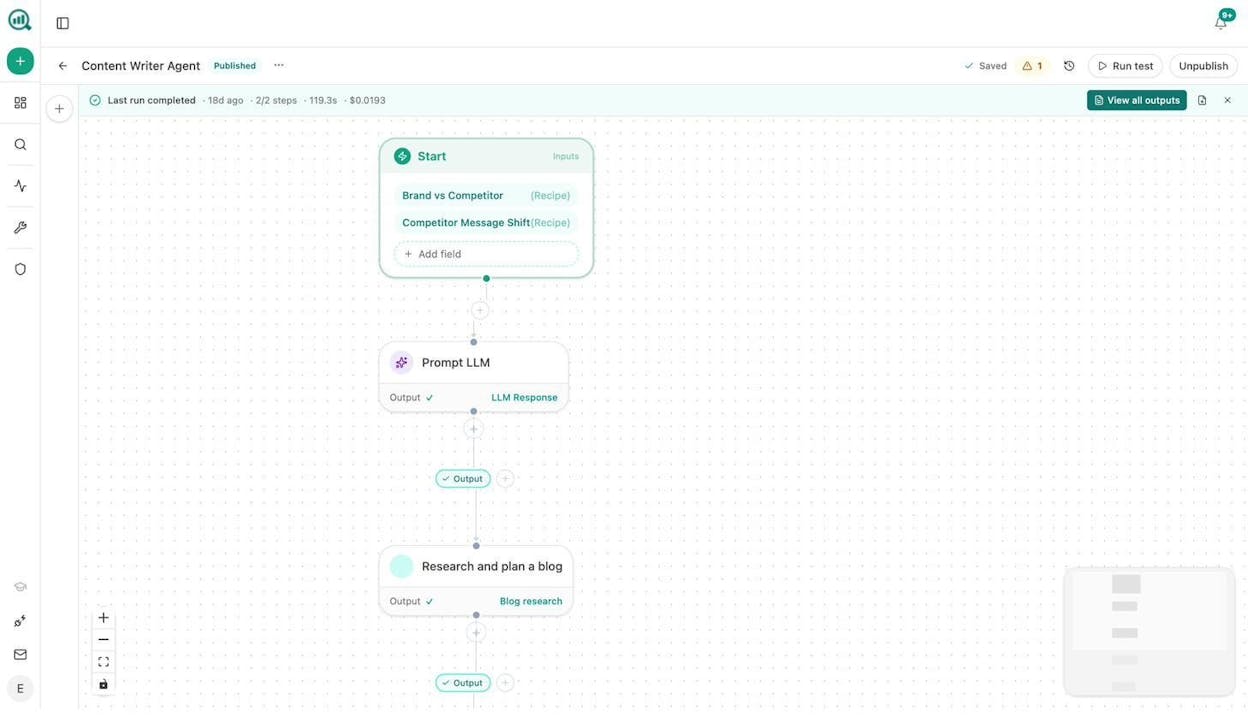
The Agent Builder: where monitoring becomes operations
This is the feature most teams underestimate. The Agent Builder gives you 180+ nodes, 34 pre-built data recipes, 13 input primitives, and three trigger modes (manual, scheduled, webhook). It connects directly to GA4, Google Search Console, DataForSEO, Semrush, HubSpot, Notion, WordPress, Slack, Mailchimp, and every major LLM.
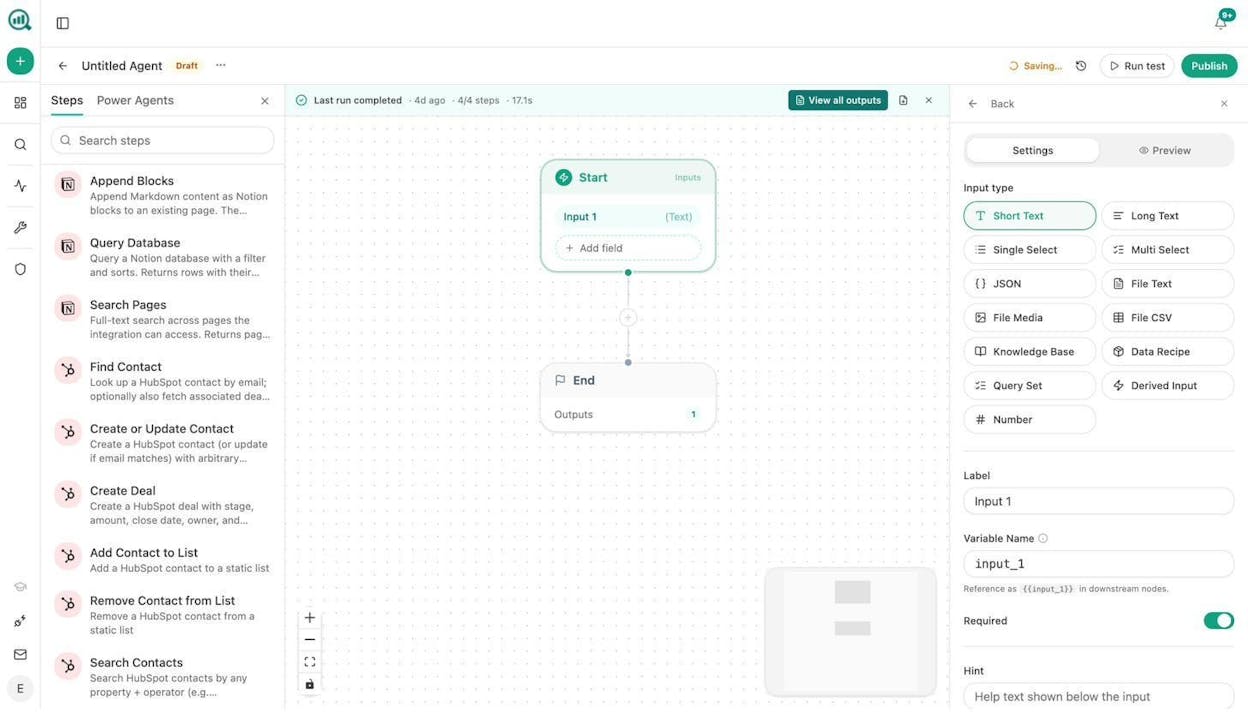
This is not a simple automation layer. This is the substrate where your entire marketing operations run.
A few examples of what teams build:
-
Monday client briefing pack: A scheduled agent pulls your executive summary, GSC top pages, AI visibility deltas, and competitor movement. It assembles a branded DOCX and emails it to the account team. Every client, every Monday, zero manual work.
-
Brief-to-publish content pipeline: A webhook fires when a brief moves to “approved” in Notion. The agent generates research, writes a full draft with brand voice, scores it, and publishes to WordPress if it passes.
-
Crisis early-warning: A scheduled agent runs every 15 minutes, checking brand mentions. When sentiment drops below threshold, it fires a Slack alert and drafts response options before your CEO sees the headline.
-
Lead enrichment on autopilot: A webhook triggers on form fill. The agent verifies the email, researches the prospect’s domain, creates an enriched HubSpot contact, and notifies the AE.
The difference between Analyze AI and every other tool on this list is that Analyze AI does not just show you data. It acts on the data continuously, on a schedule, or in response to real-time events.
Governance and weekly intelligence
Perception Map, AI Sentiment Monitoring, and AI Battlecards let you track how AI models position your brand, catch negative narratives early, and get counter-strategies grounded in real model outputs. Weekly Email Digests deliver prioritized actions every Monday without logging in.
Who should use Analyze AI: SaaS brands, agencies, content teams, and any marketing org that treats AI search as a real channel. Analyze AI also offers free SEO tools including a Broken Link Checker, Website Traffic Checker, Keyword Generator, and Website Authority Checker.
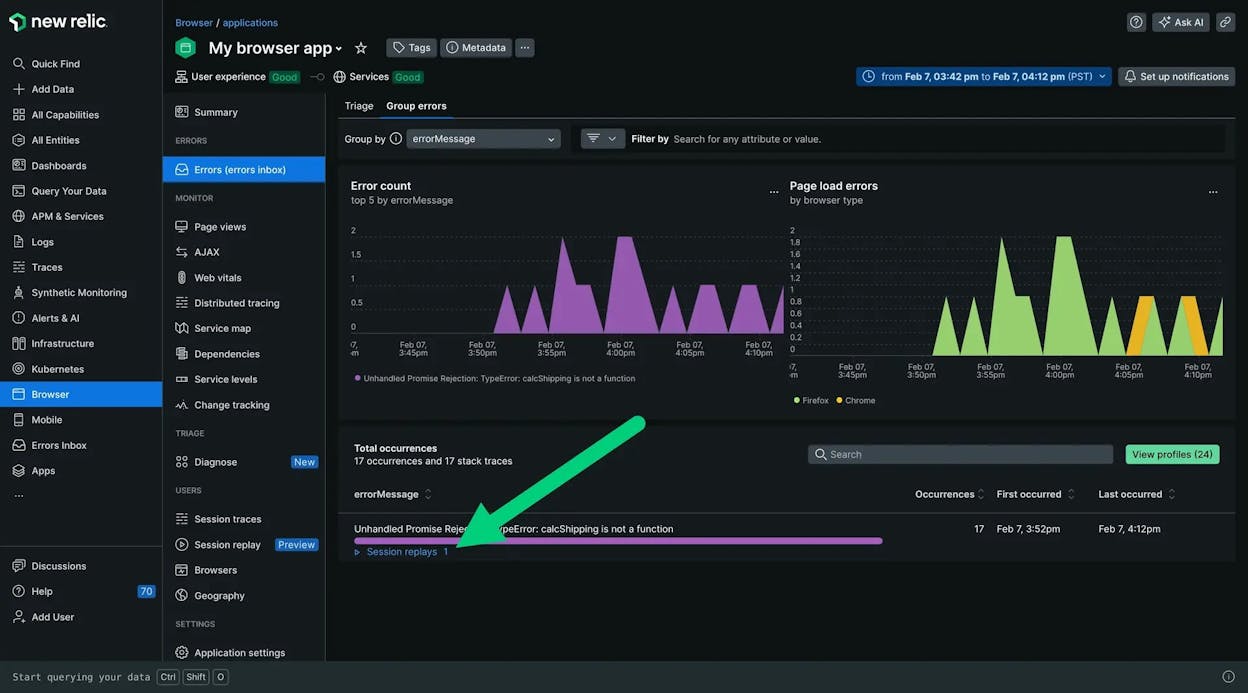
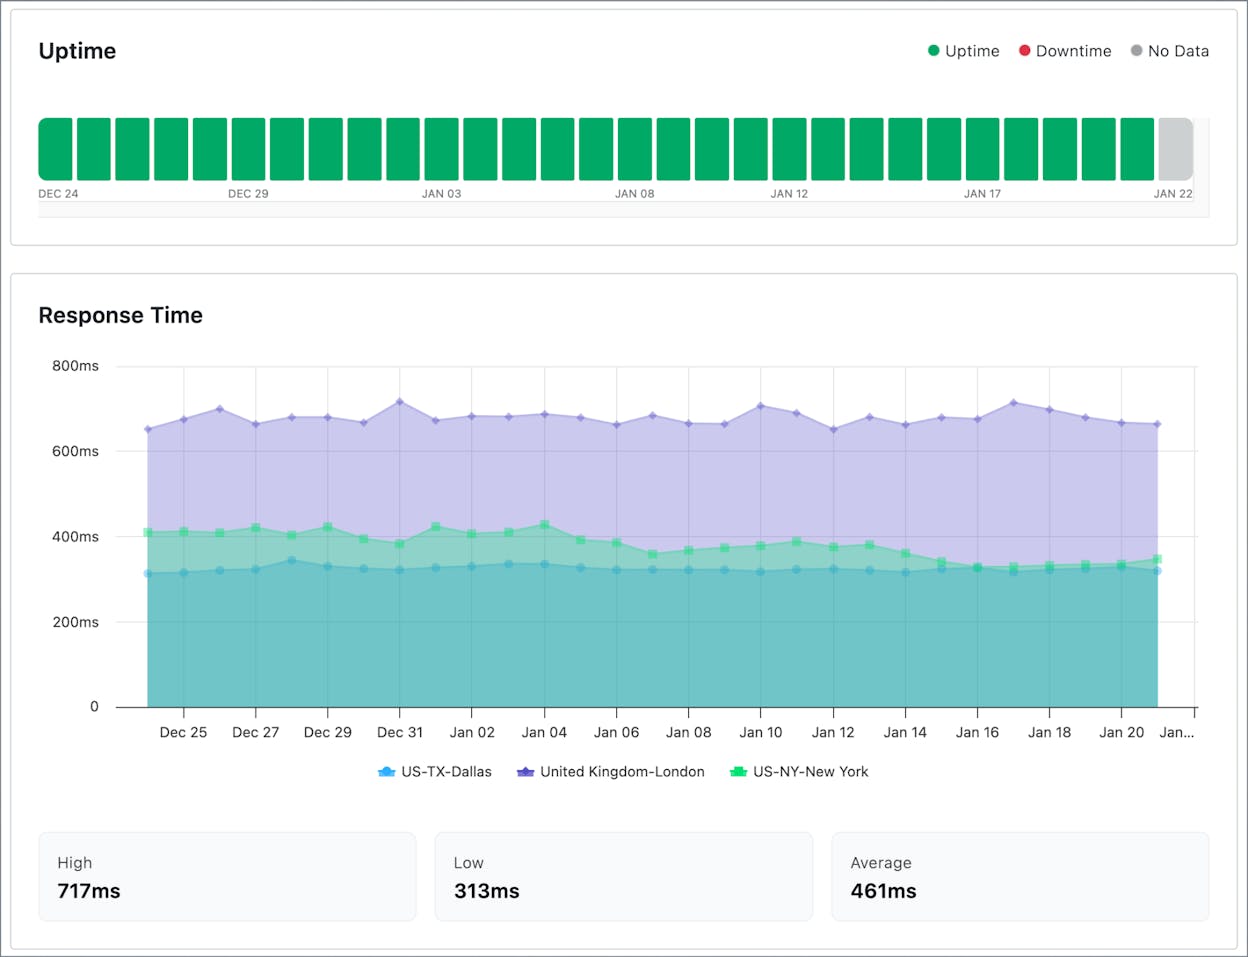
UptimeRobot: best for simple, budget-friendly uptime checks
UptimeRobot gives you 50 monitors on a free plan with five-minute check intervals. Paid plans start at $9/month for one-minute checks. It supports HTTP, ping, port, keyword, DNS, SSL, and heartbeat checks with alerts through email, SMS, Slack, Teams, and webhooks.
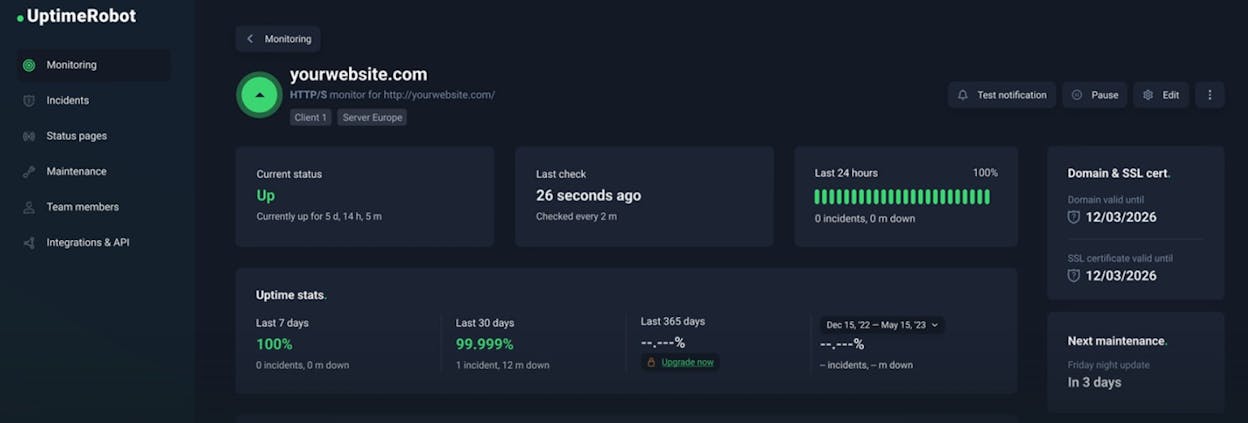
The main limits are the five-minute interval on free (which can miss short outages), no RUM, no transaction monitoring, and no deep performance data. The free plan is also restricted to personal, non-commercial use.
Who should use it: Small businesses, early-stage startups, and agencies that need basic “is it up?” alerts across many URLs at low cost.
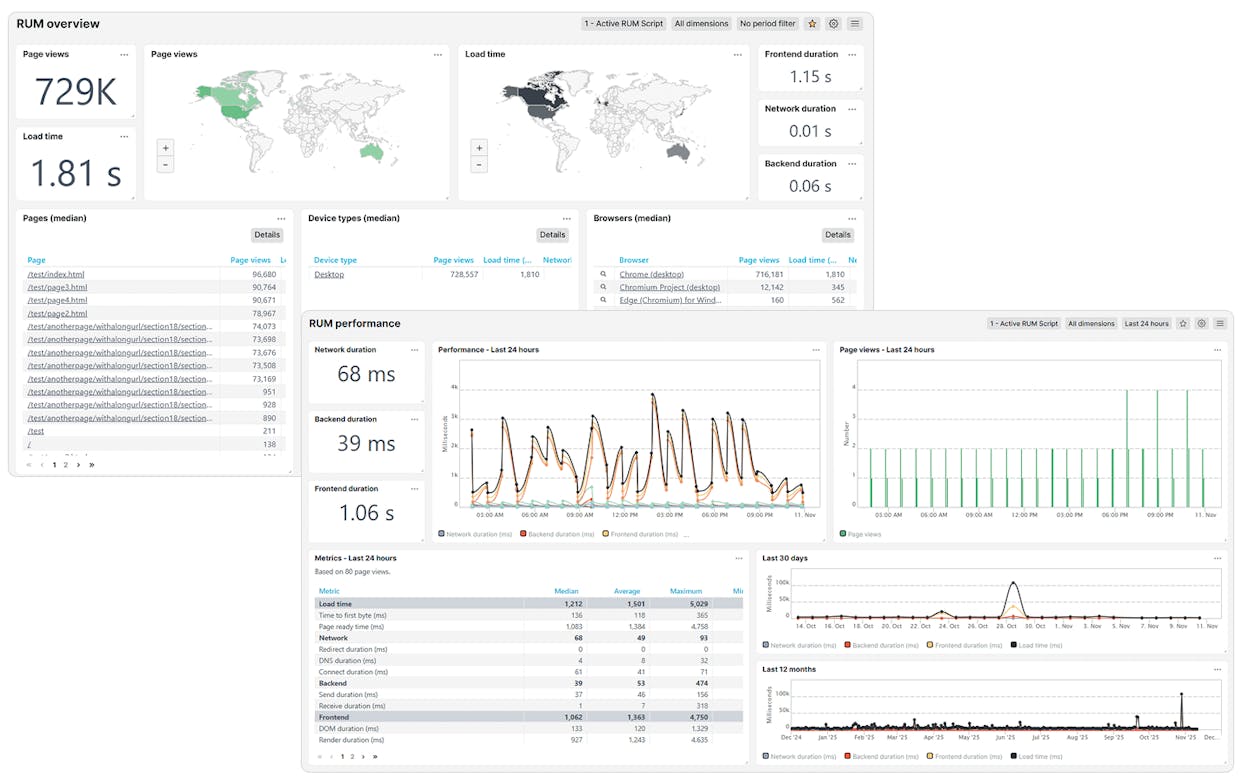
Pingdom: best for performance and real-user insight
Pingdom combines uptime checks, page-speed tests, RUM, and transaction monitoring. It tests critical flows like checkout, login, and signup from 100+ global locations.
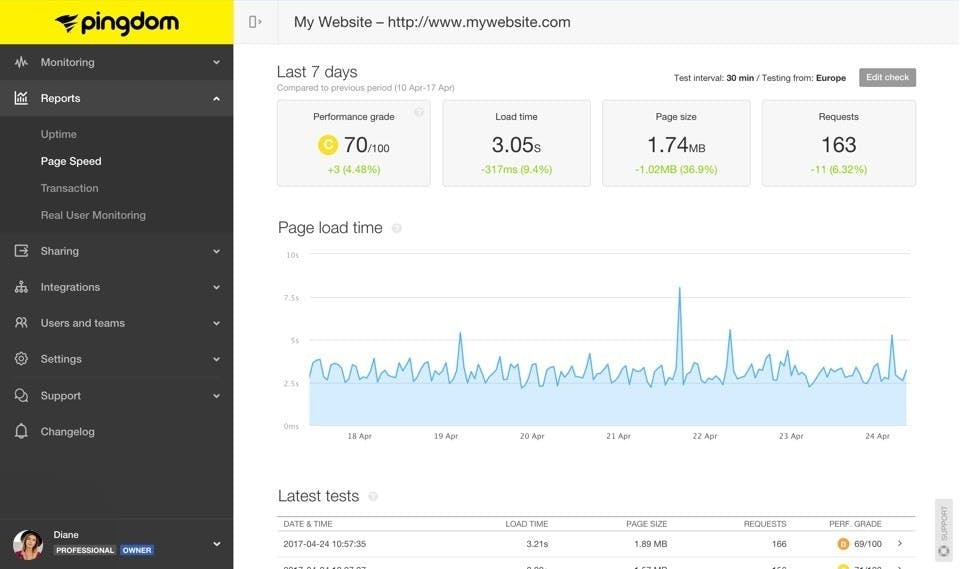
The combination of synthetic signals and real-world user data in one dashboard is the value. The downside is usage-based pricing that grows with traffic and pageviews. No server-level or infrastructure monitoring.
Who should use it: E-commerce sites that depend on smooth checkouts, SaaS products with global traffic, and agencies where speed directly affects revenue.
StatusCake: best for all-in-one basic checks
StatusCake monitors uptime, page speed, SSL status, domain expiry, DNS, and server health from one dashboard. The free plan includes 10 monitors with five-minute checks. Paid plans go down to 30-second intervals.
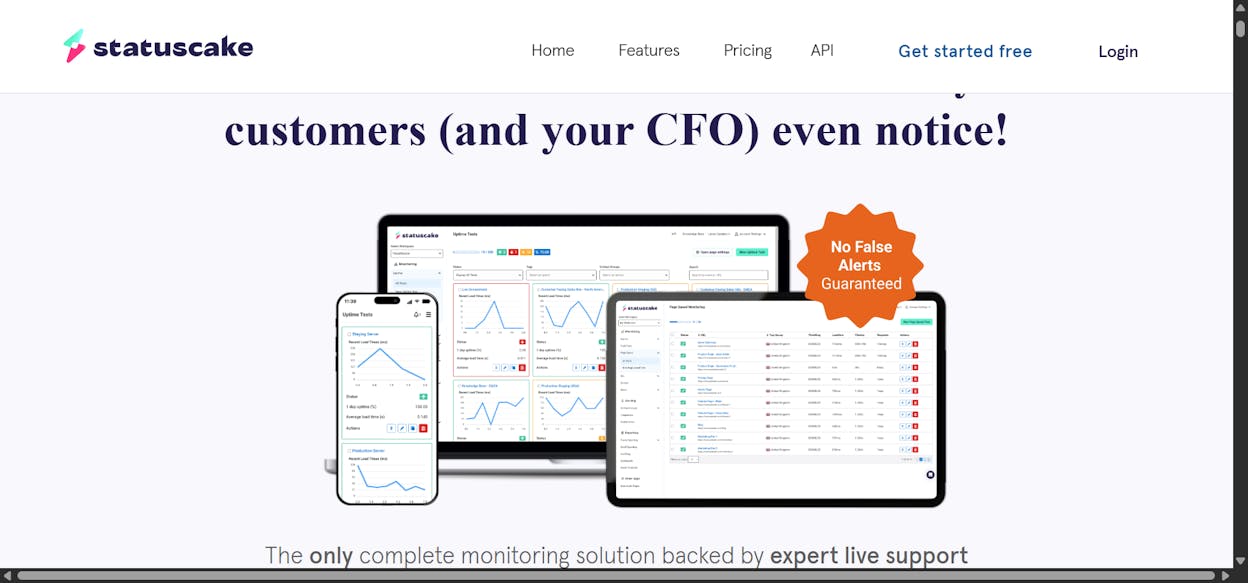
It covers the basics well for small businesses and agencies managing many small sites. Server monitoring tracks CPU, RAM, and disk. The limitation is that there is no RUM and no transaction testing, so it does not show user-side experience. Ten monitors on the free plan can feel tight once you manage more than a few domains.
Who should use it: Small businesses, blogs, freelancers, and agencies that want uptime, SSL, domain, and basic server health in one lightweight tool without APM complexity.
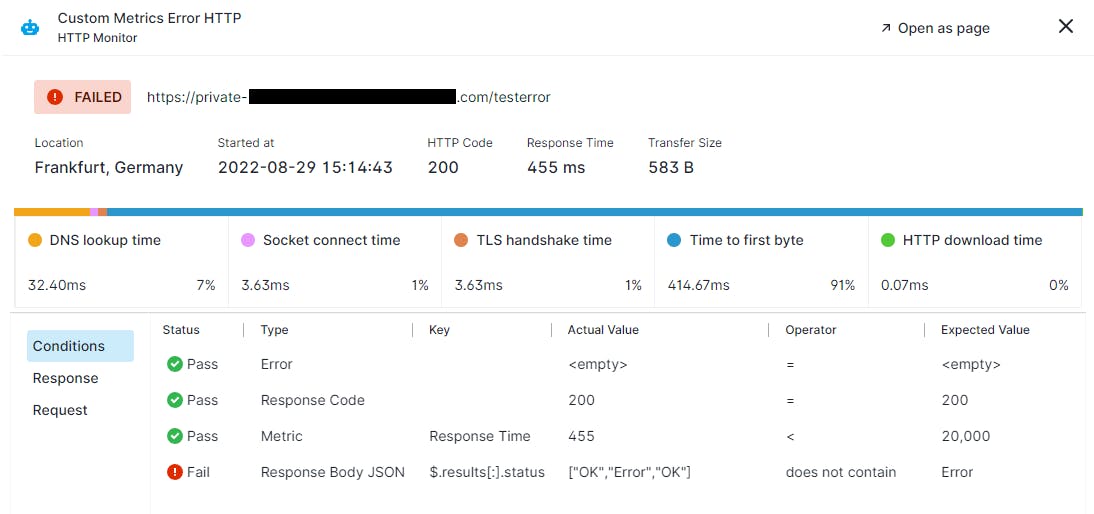
Uptrends: best for full-stack web and API monitoring
Uptrends runs synthetic checks from 200+ global checkpoints. It simulates multi-step user flows (login, checkout, form fills) and monitors API response times and correctness. Optional RUM adds real-user data.
Modular pricing lets you pay only for what you need. The platform is deep, which means the UI can feel complex for non-technical teams. Costs also rise when you stack synthetics, API checks, RUM, and browser tests.
Who should use it: SaaS platforms with critical APIs, e-commerce sites protecting revenue paths, and global services that need availability and speed checks from many regions.
Site24x7: best for full-stack web, infra, and app monitoring
Site24x7 covers websites, servers, networks, cloud, containers, databases, and APM in one tool. It checks uptime from 130+ locations and mixes synthetic tests with RUM.
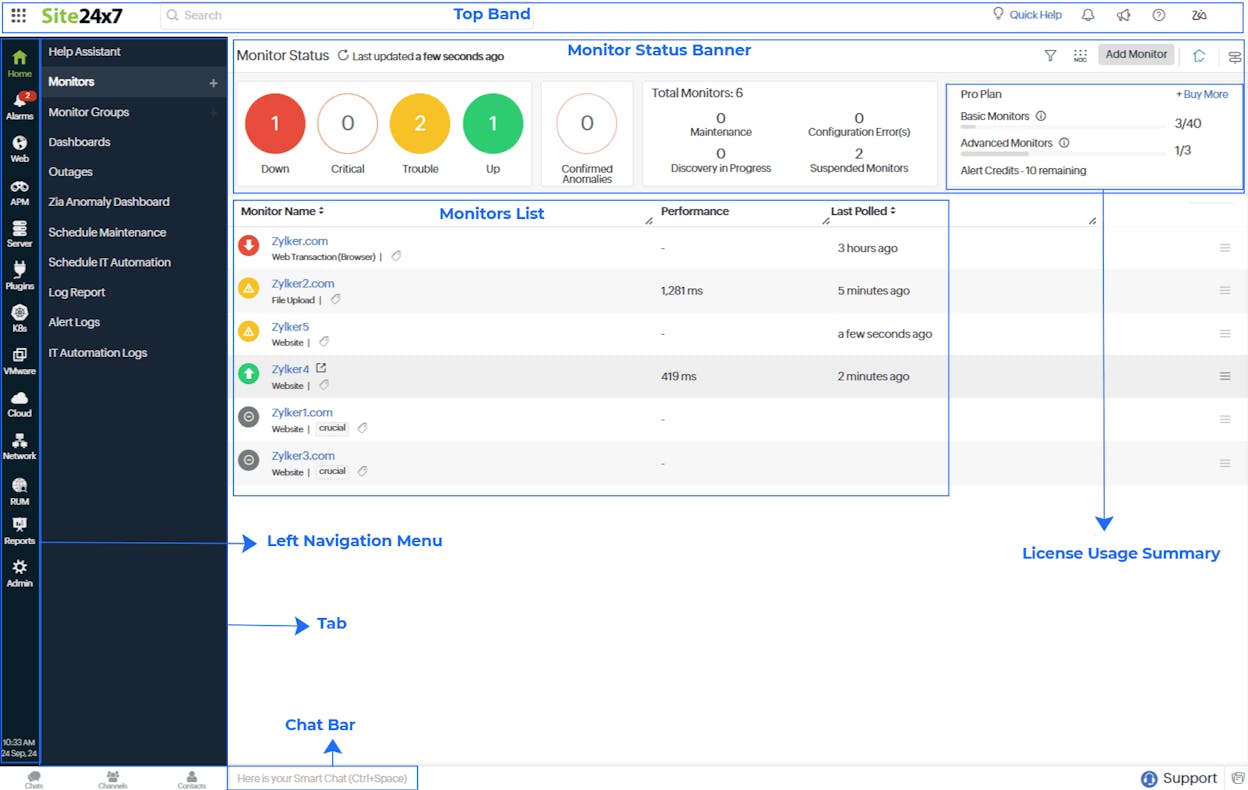
You avoid managing five separate tools, but the interface is dense and costs increase as you enable more modules.
Who should use it: Small to mid-size teams that want one platform for web, server, cloud, and app monitoring without tool sprawl.
Uptime.com: best for uptime, transactions, APIs, and RUM
Uptime.com offers 30+ monitoring types including HTTP, API checks, page-speed tests, browser-based transaction monitoring, and RUM. It supports both public monitoring and private internal checks.
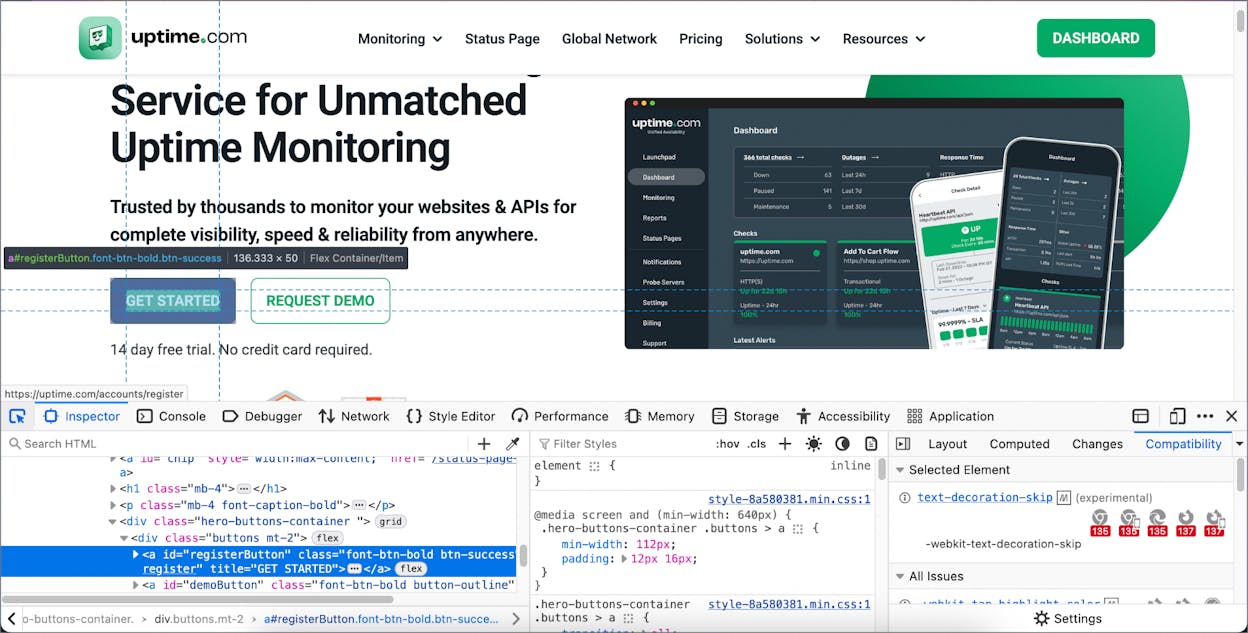
The browser-driven transactions are particularly strong for testing login, checkout, and form flows. Private probes help you monitor internal tools behind firewalls. The downside is that advanced setups need technical skill, and costs climb with many monitors and modules.
Who should use it: SaaS products relying on stable APIs, e-commerce sites, and teams that need one dashboard for public-facing and internal system monitoring.
HetrixTools: best for lightweight uptime and blacklist monitoring
HetrixTools gives you 15 free uptime monitors at one-minute intervals plus 32 blacklist monitors. The built-in IP and domain blacklist monitoring is the differentiator. Most uptime tools do not include this.
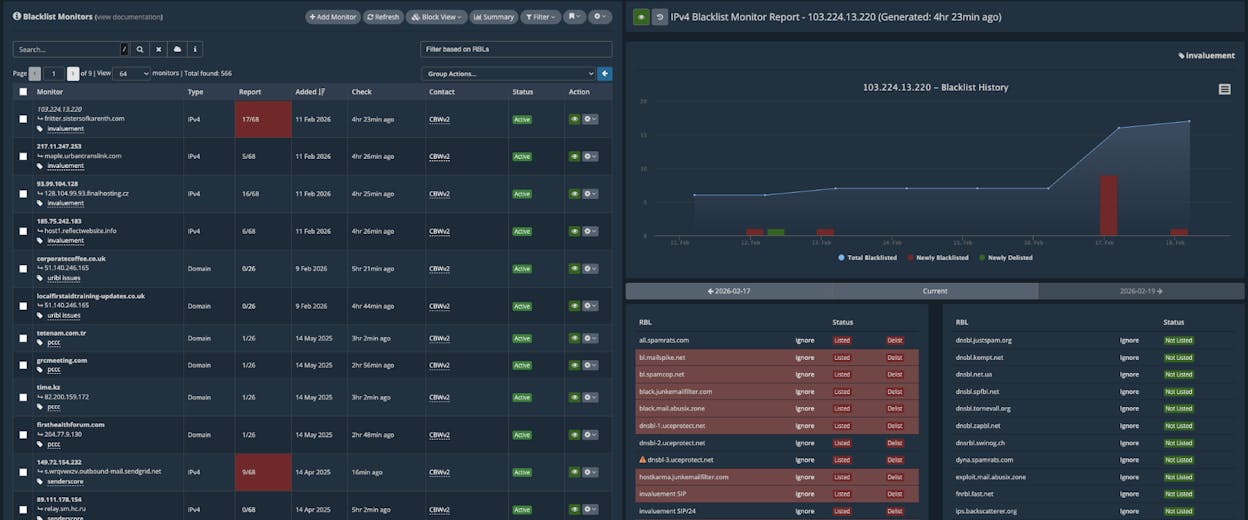
Server monitoring is optional and covers CPU, RAM, disk, and service status. The interface is sysadmin-oriented, not marketer-friendly. There is no RUM, APM, or transaction monitoring.
Who should use it: Hosting companies, email services, and small ops teams that need fast uptime checks and blacklist protection across many domains at low cost.
Oh Dear!: best for site health, security, and status pages
Oh Dear! monitors uptime, SSL certificate expiry, broken links, mixed content, and cron jobs. It also provides clean, built-in status pages.
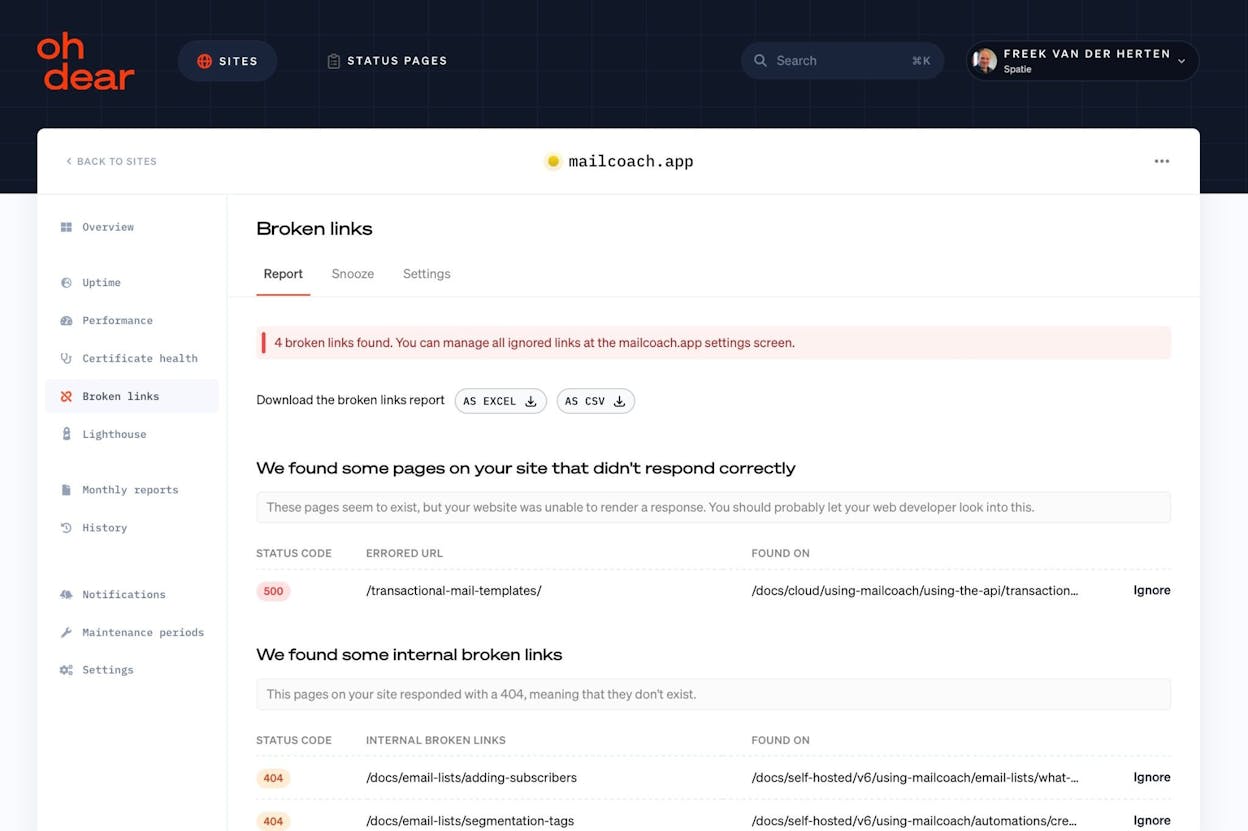
The broken-link detection and mixed-content scanning set it apart from basic uptime tools. These checks protect SEO and user trust. The limitation is that there is no APM, no infrastructure monitoring, and no synthetic multi-step transactions. It is a website-layer tool, not a full-stack platform.
Who should use it: Content-heavy sites, agencies, and product teams that care about uptime, SEO health, SSL, and cron reliability more than deep infrastructure metrics.
Sematext Synthetics: best for flexible synthetic + API checks on a budget
Sematext Synthetics runs HTTP and browser-based monitors for about $2 per monitor per month. It integrates with Sematext Cloud’s logs, infrastructure, and APM modules.
The strength is the connection to a broader observability stack at a fraction of the cost of Datadog or New Relic. Costs do add up with many monitors, and the ecosystem has fewer integrations and community resources than larger platforms.
Who should use it: Startups, APIs, and microservices that need targeted synthetic monitoring with the option to grow into full-stack observability without enterprise pricing.
Datadog: best for full-stack visibility with RUM + synthetics
Datadog combines RUM, synthetic tests, APM, logs, infrastructure, and security monitoring. When a synthetic test flags a slowdown, you trace it through API calls, database queries, and server logs without switching tools.
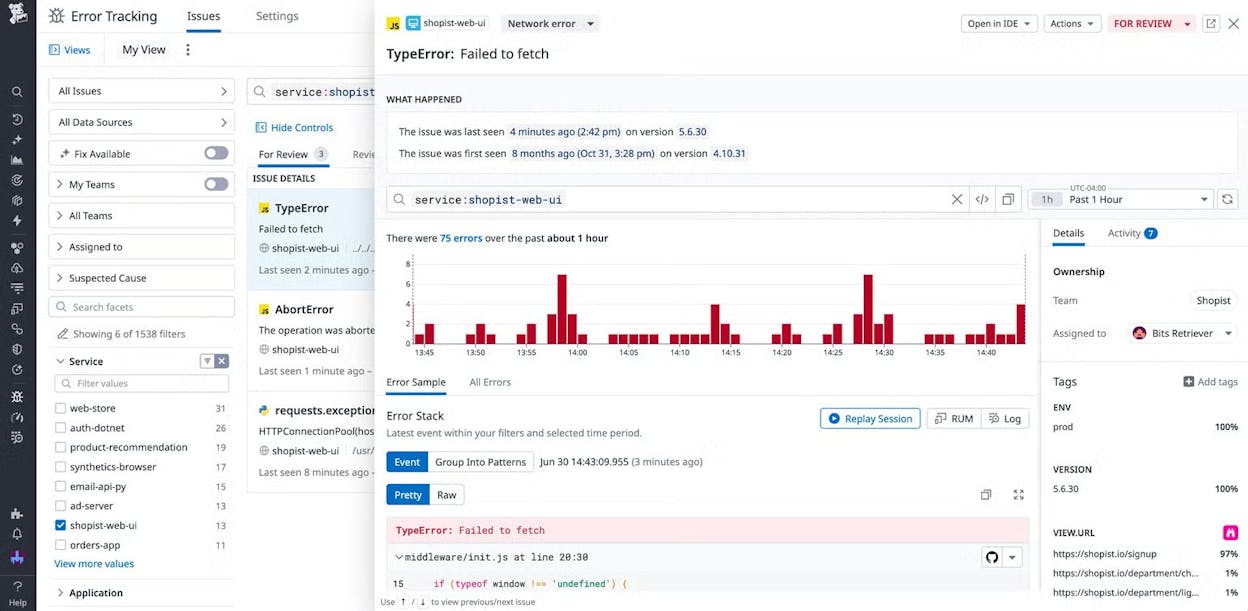
The depth is unmatched for complex, cloud-native applications. The tradeoff is cost. RUM charges per session, synthetics per test run, logs per gigabyte, APM per host. The learning curve is steep.
Who should use it: Cloud-native SaaS with microservice architectures and large engineering teams that need deep root-cause analysis across every layer.
New Relic: best for full-stack digital experience
New Relic provides RUM, synthetic monitoring, APM, logs, infrastructure, and session replay in one platform. Its frontend-to-backend correlation links slow pages to specific API calls and database queries.
The free tier is generous for getting started. Costs rise with data volume and user seats. Teams without SRE roles may find the platform overwhelming.
Who should use it: High-traffic apps where UX and backend performance both drive revenue, and teams that want one observability platform with session replay.
Dynatrace: best for AI-driven full-stack observability
Dynatrace uses its Davis AI engine for automated anomaly detection and root-cause analysis. It provides RUM, synthetic monitoring, full-stack APM, logs, and session replay.
When something breaks, Davis correlates frontend behavior with backend and infrastructure signals to pinpoint the cause. Enterprise pricing and a steep learning curve.
Who should use it: Enterprises with complex distributed systems and strict SLAs that need automated root-cause analysis.
LogicMonitor: best for enterprise-level synthetic and infra observability
LogicMonitor combines website checks with deep infrastructure, network, and cloud monitoring. Its 3,000+ integrations cover on-premises, cloud, hybrid, and multi-cloud environments. The Edwin AI AIOps engine reduces alert noise and correlates events.
The platform is built for large environments with many moving parts. Pricing is enterprise-oriented. Configuration is heavy. It is far more power than small or mid-size sites need.
Who should use it: Large enterprises, MSPs, and hybrid or multi-cloud environments that want to consolidate infrastructure, network, and website monitoring in one platform.
Better Uptime: best for incident response, on-call, and uptime workflows
Better Uptime pairs uptime monitoring with on-call scheduling, escalation policies, incident timelines, and status pages. Checks run as fast as every 30 seconds on paid plans.
The differentiator is that it treats uptime as a workflow, not just an alert. Screenshots on failure, escalation chains, and status pages all live in one place. Per-responder pricing can add up for larger teams. There is no APM, RUM, or infrastructure monitoring.
Who should use it: SLA-driven SaaS teams, agencies, and any group that wants uptime monitoring and incident management in one product instead of stitching together separate tools.
Freshping: best for free or ultra-budget uptime alerts
Freshping offers 50 monitors with one-minute checks on a free plan. It provides basic uptime and response-time checks with alerts through email, Slack, SMS, and webhooks.
Public status pages and Freshdesk integration are included. The limit is that there is no RUM, no transaction testing, no API monitoring, and no infrastructure visibility. The product is also currently undergoing a revamp with new signups paused.
Who should use it: Small sites, blogs, portfolios, and agencies that need simple uptime monitoring across many URLs at zero cost.
How to pick the right monitoring tool
If your main concern is “is my site up?”, start with UptimeRobot, Freshping, or StatusCake. They handle the basics at low or no cost.
If you need to protect revenue-critical flows like checkout or API uptime, look at Pingdom, Uptrends, or Uptime.com for transaction testing and RUM.
If you run complex infrastructure with microservices and cloud services, Datadog, New Relic, Dynatrace, or LogicMonitor give you the depth to trace problems across layers.
If your question is “are AI answer engines recommending my brand and driving real pipeline?”, none of the traditional tools answer that. Analyze AI does. It connects prompt-level visibility to sessions, landing pages, and pipeline. And with the Agent Builder, it turns that data into automated operations across your entire marketing org.
The best monitoring stack in 2026 covers both infrastructure health and the AI search channel. Your site being “up” is table stakes. Knowing whether AI engines recommend you and whether that translates to revenue is the next layer your team needs.
Ernest
Ibrahim


