

![50 GEO Statistics From Tracking 83,670 AI Citations [2026 Data]](/_next/image?url=https%3A%2F%2Fwww.datocms-assets.com%2F164164%2F1779314907-blobid0.png&w=3840&q=75)

Summarize this blog post with:


In this article, you’ll get 50 generative engine optimization statistics grounded in real citation data, not recycled SEO guesses. We pulled most of these from our own analysis of 83,670 AI citations across ChatGPT, Claude, and Perplexity. The rest come from peer-reviewed research, industry benchmarks, and first-party platform data from Conductor, Semrush, BrightEdge, and Seer Interactive.
Table of Contents
AI Search Adoption Statistics
The shift from blue links to AI-generated answers is no longer a prediction. It’s measurable.
1. ChatGPT reached 900 million weekly active users as of February 2026, up from 400 million in February 2025. That’s a 125% increase in 12 months. (Source: OpenAI)
2. Google AI Overviews now reach 1.5 billion monthly users. That makes it the largest AI search surface by audience size. (Source: Conductor 2026 Benchmarks)
3. AI Overviews trigger on 48% of all tracked queries, up 58% year-over-year. If your content isn’t structured for AI extraction, you’re invisible on nearly half of Google searches. (Source: BrightEdge)
4. 50% of consumers now use AI-powered search. And 44% of those users say it’s their primary source for product discovery, ahead of traditional search at 31%. (Source: HubSpot 2026 State of Marketing)
5. Zero-click searches on Google grew from 56% to 69% in one year. That’s a 13-percentage-point increase in the 12 months following AI Overviews’ launch in May 2024. Users get answers without clicking. (Source: Similarweb, July 2025)
6. In Google’s AI Mode, 93% of searches end without a click. Compare that to 34% in standard Google Search without an AI Overview. (Source: Conductor 2026 Benchmarks)
7. Only 16% of brands systematically track AI search performance. That means 84% of the competitive field isn’t measuring the channel a growing share of their buyers actively use. (Source: McKinsey 2025 CMO Survey)
If you’re part of that 84%, you can start tracking your AI visibility across every major engine today with Analyze AI.
AI Traffic and Conversion Statistics
AI search doesn’t just send traffic. It sends better traffic.
8. AI-referred sessions grew 527% year-over-year in the first five months of 2025. That growth rate is not slowing down. (Source: Previsible 2025 AI Traffic Report)
9. AI referral traffic converts at 4.4x the rate of traditional organic search. Visitors arriving from AI platforms are pre-qualified. The AI already recommended your brand. (Source: Conductor 2026 Benchmarks)
10. ChatGPT referral traffic converts at 15.9%. Perplexity at 10.5%. Claude at 5%. Google Organic at 1.76%. The gap between AI referral conversion and traditional organic is significant across every engine. (Source: Seer Interactive, June 2025)
11. AI-referred visitors spend 68% more time on websites than organic visitors. Session duration averages 9+ minutes from Perplexity referrals compared to standard organic sessions. (Source: SE Ranking, 2025)
12. AI-driven traffic to U.S. retail websites grew 693% year-over-year during the 2025 holiday season. Adobe tracked this across more than 1 trillion visits. (Source: Adobe Analytics)
13. ChatGPT ecommerce traffic converts 31% higher than non-branded organic search. A 12-month GA4 analysis of 94 ecommerce brands confirmed this consistently. (Source: Visibility Labs / Search Engine Land, 2026)
14. AI search generated 12.1% of signups for one major platform despite accounting for only 0.5% of total visitors. That’s a 24:1 conversion ratio relative to organic search. (Source: Ahrefs, June 2025)
15. AI referral traffic currently accounts for approximately 1.08% of all website traffic. Small in volume, but growing roughly 1% month-over-month. (Source: Conductor 2026 Benchmarks)
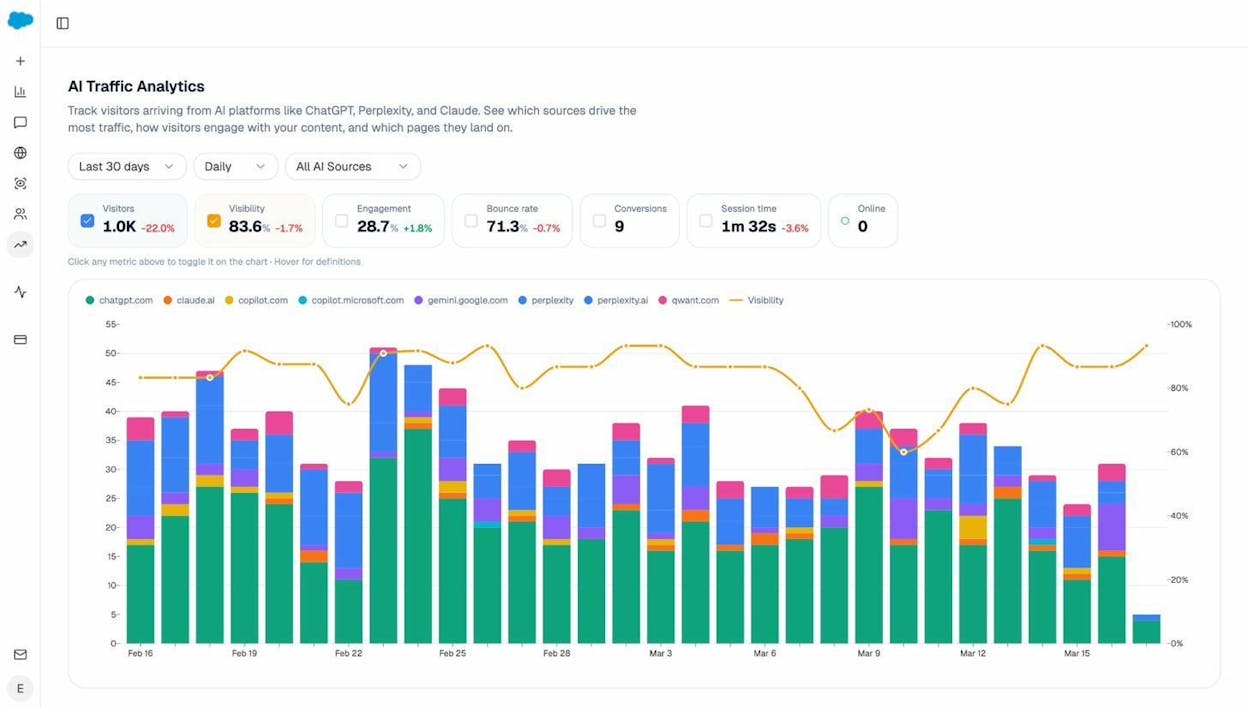
You can track exactly how much AI traffic your site receives, which landing pages capture it, and which prompts drive it using AI Traffic Analytics in Analyze AI.
AI Citation and Visibility Statistics
Getting cited by AI engines is the new ranking. Here’s what the data says about how citations actually work.
16. 83% of AI citations come from third-party sources. Only 17% come from brand websites. Every time a brand is mentioned in AI search, the vast majority of supporting links point to review sites, news articles, analyst reports, and industry blogs. (Source: Analyze AI Citation Study, 83,670 citations)
17. The top 10 brands capture 30% of all AI mentions. Out of 4,980 unique brands tracked, most visibility goes to a small group at the top. Salesforce alone appeared in 6.3% of responses. (Source: Analyze AI)
18. Only 6.82% of ChatGPT results overlap with Google’s top 10. AI platforms use fundamentally different citation logic than traditional search rankings. (Source: ConvertMate GEO Benchmark, 2026)
19. 83% of AI Overview citations come from outside the organic top 10. You don’t need to rank #1 on Google to get cited by AI. You need content that AI systems find useful. (Source: ConvertMate GEO Benchmark, 2026)
20. Brands cited in AI Overviews see a 35% higher click rate on adjacent organic results. Being cited in an AI answer increases the probability that a user clicks on your organic listing too. This resolves the common objection that GEO cannibalizes SEO. (Source: BrightEdge, 2025)
21. Distributing content to third-party publications can increase AI citations by up to 325%. Compared to only publishing content on your own site. (Source: Stacker, December 2025)
22. Earned media distribution increases AI citations by a median lift of 239%. Journalistic and earned media sources account for nearly 25% of all LLM-generated citations. (Source: Stacker, March 2026)
23. 44.2% of all LLM citations come from the first 30% of text (the intro). The opening of your content carries disproportionate weight in AI citation selection. (Source: Growth Memo, February 2026)
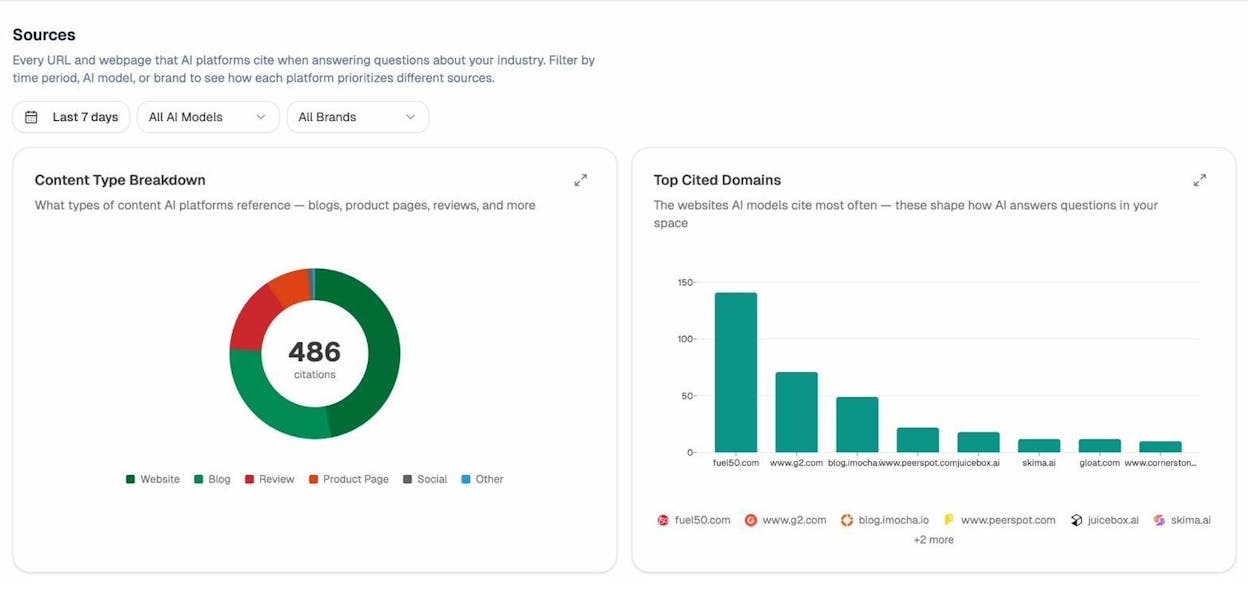
You can monitor which sources are citing your competitors but not you, and find the exact citation gaps to close, inside Analyze AI.
Engine-Specific Statistics
Not all AI engines behave the same way. Our analysis of 83,670 citations revealed clear differences in how each engine selects and distributes citations.
24. Google AI Overview is responsible for 51.4% of all citations. More than double the share of the next most active model. If your content isn’t optimized for Google’s preferred citation formats, your visibility is structurally limited. (Source: Analyze AI, 67,111 citations)
25. ChatGPT uses Wikipedia for 12.1% of citations. Claude uses it for 0.1%. Perplexity doesn’t cite it at all. That’s a 121x gap between ChatGPT and Claude. Wikipedia visibility translates very differently depending on which engine your audience uses. (Source: Analyze AI)
26. ChatGPT cited LinkedIn 900 times in our B2B dataset. Claude and Perplexity cited it zero times. LinkedIn as a citation source is specific to ChatGPT. (Source: Analyze AI)
27. Claude favors blog content at 43.8% of citations. ChatGPT favors product pages at 60.1%. Each engine has distinct content format preferences that directly affect what gets cited. (Source: Analyze AI)
28. Perplexity provides 29% more citations per brand mention than ChatGPT. Perplexity leads at 1.26 citations per mention. ChatGPT is lowest at 0.98. (Source: Analyze AI)
29. The same brand can receive sentiment scores up to 79 points apart depending on which engine you ask. This happens because each engine pulls from different sources and weighs them differently. (Source: Analyze AI)
30. ChatGPT drives 87.4% of all AI referral traffic to websites. Perplexity, Gemini, Claude, and others split the remaining 12.6%. (Source: Conductor 2026 Benchmarks)
31. ChatGPT cites product pages at 20.1%, fifty times the rate of Perplexity at 0.4%. If you’ve invested heavily in blog content, you’re optimized for Perplexity and Claude but not for ChatGPT, the engine driving 87% of AI referral traffic. (Source: Lantern, February 2026)
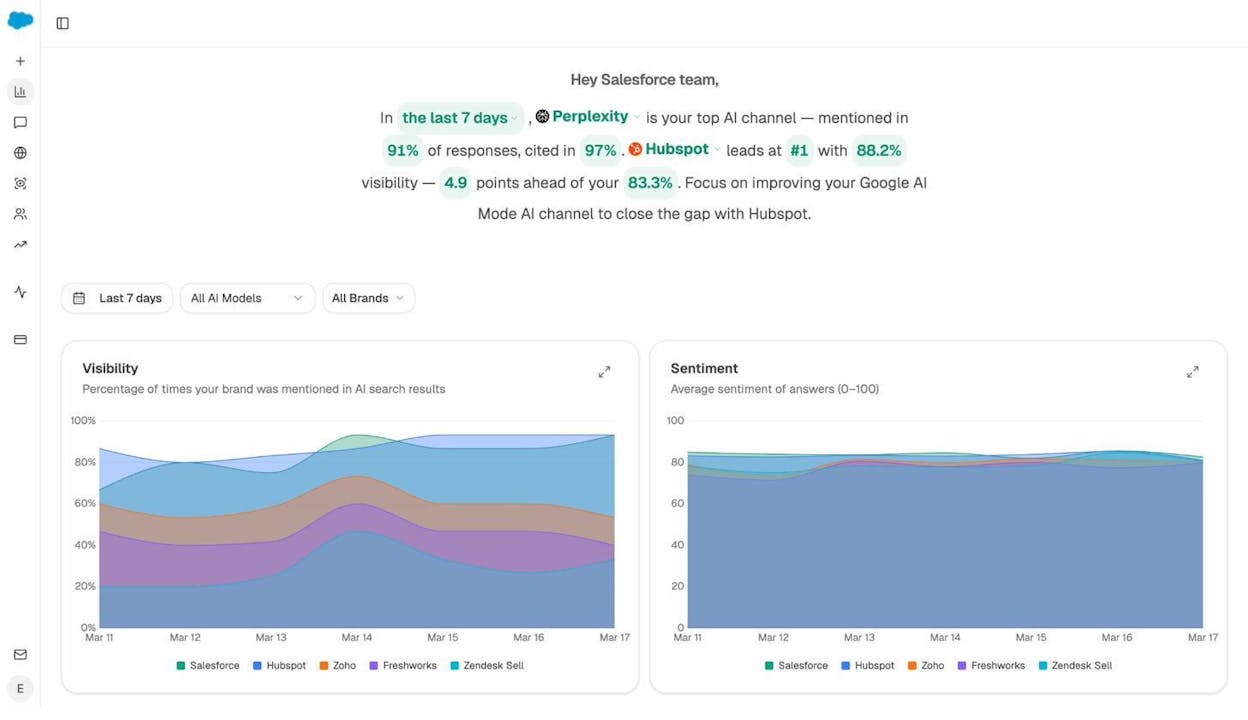
This is exactly why you need an engine breakdown of your visibility. Analyze AI tracks your brand’s performance across ChatGPT, Claude, Perplexity, Gemini, Copilot, and Google AI Overviews individually, so you can optimize for each engine’s preferences.
Content Optimization Statistics
What you write matters. How you structure it matters more.
32. Adding specific statistics to content increases the probability of being cited by AIs by 37%. Vague claims have no value for an LLM. Precise, sourced data performs better. (Source: Princeton GEO Study, KDD 2024)
33. Applying multiple GEO techniques in combination can improve AI visibility by 30-40%. These techniques include statistics addition, source citation, quotation inclusion, and structured formatting. (Source: Princeton GEO Study, KDD 2024)
34. Content with clear formatting (headings, bullet points, numbered lists, tables) is 28-40% more likely to be cited by LLMs. Structure makes your content machine-readable. (Source: ConvertMate GEO Benchmark, 2026)
35. Pages with 20,000+ characters receive 4.3x more AI citations than shorter pages. Comprehensive content outperforms thin pages in AI citation selection. (Source: ConvertMate GEO Benchmark, 2026)
36. AI crawlers strongly prefer fresh content. 65% of AI bot hits target content less than 1 year old. And 89% target content less than 3 years old. AI-cited content is 25.7% fresher than traditional organic results. (Source: Semrush, 2026)
37. Comparison articles lead all content types with 32.5% of AI citations. Followed by opinion pieces at 10%. “Best of” content, product pages, and guides drive the most AI referral traffic. (Source: Previsible, 2025)
38. Listicles have a 25% citation rate compared to blogs and opinion pieces at 11%. The format of your content plays a pivotal role in whether AI models choose to cite it. (Source: Exposure Ninja, 2026)
39. 91.4% of content cited in AI Overviews is at least partially AI-assisted. The question isn’t whether to use AI in content creation. It’s whether you’re using it well enough for AI systems to cite the result. (Source: Previsible, 2025)
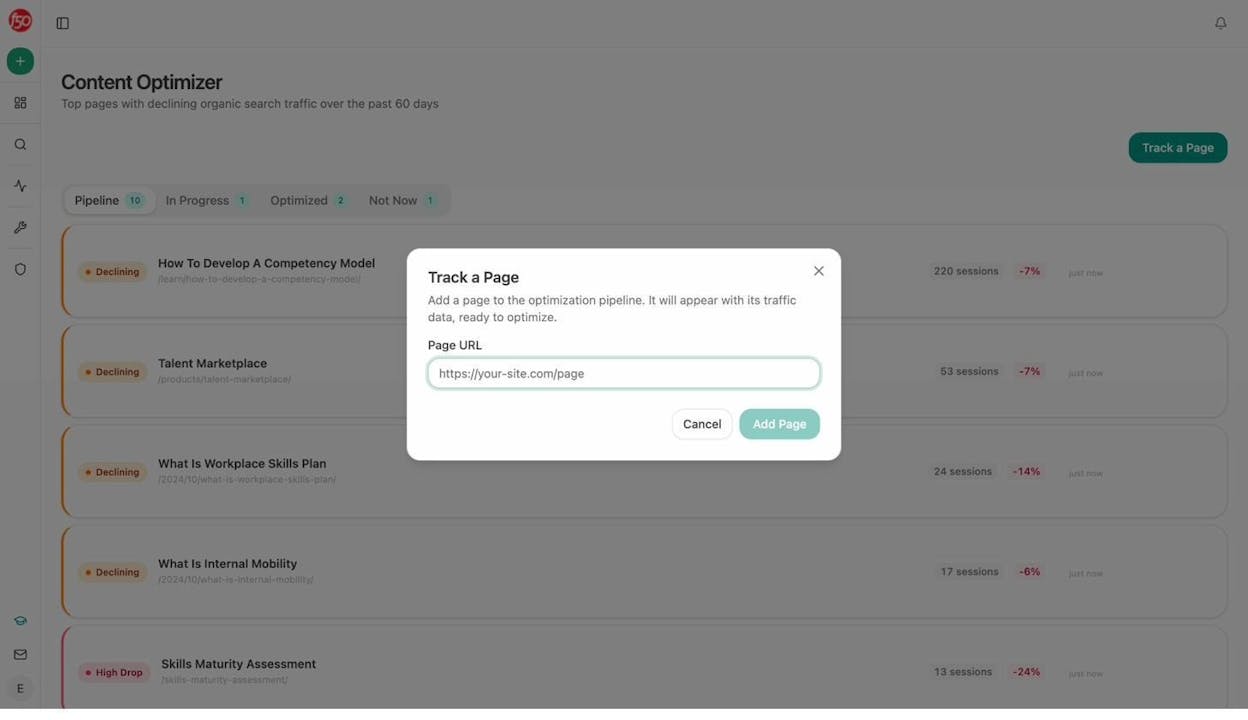
You can audit any page for AI search readiness using Analyze AI’s Content Optimizer, which scores structure, freshness, claim density, and citation-friendliness, then gives you specific fixes.
Market and Competitive Statistics
GEO is not a side project. It’s a category with measurable economics.
40. The GEO market is projected to grow from $848 million in 2025 to $33.7 billion by 2034 at a 50.5% CAGR. That trajectory is consistent with early-stage channel breakout. (Source: GEO Benchmark Study 2026)
41. 92% of marketers plan to optimize for AI search, but only 40.6% are currently doing so. The execution gap is the defining GEO maturity challenge in 2026. (Source: GEO Benchmark Study 2026)
42. Brands with only one source type achieve 18% average AI coverage. With five or more source types, that jumps to 78%. Source diversity compounds. Digital PR, review platforms, YouTube, and Reddit participation are now GEO tactics. (Source: Erlin, 2026)
43. The gap between AI visibility winners and losers is 9x and widening at 3.2% every month. Early movers build durable advantages. Late movers face increasing recovery costs. (Source: Erlin, 2026)
44. AI recommendations are highly inconsistent. There’s less than a 1-in-100 chance that ChatGPT will give the same list of brands in any two responses to the same prompt. This volatility makes continuous monitoring essential. (Source: SparkToro, January 2026)
45. Competitors displacing your citations are the cause of visibility loss 80% of the time. Without monitoring, you have no way to know when citations are being lost or who’s taking them. (Source: Erlin, 2026)
This is where Competitor Intelligence in Analyze AI comes in. You can see exactly which prompts your competitors win and your brand doesn’t, then build content to close those gaps.
GEO vs. SEO Statistics
GEO does not replace SEO. The data makes that clear.
46. SEO isn’t dying. Organic search traffic declined only 2.5% between February 2024 and November 2025. Not 25% or 50% like the panic headlines suggest. (Source: Graphite, January 2026)
47. Strong traditional SEO accounts for 77% of AI visibility. The same fundamentals that drive organic rankings also influence which content AI systems find and cite. (Source: Position Digital, 2026)
48. AI Overview citations increase adjacent organic CTR by 35%. GEO and SEO are not competing channels. They compound each other. (Source: BrightEdge, 2025)
49. Only 14% of URLs cited by Google AI Mode rank in Google’s top 10. AI search surfaces content that traditional rankings miss. You need both channels working. (Source: Conductor, 2026)
50. AI traffic converts 3x better than traditional organic search across multiple client datasets. The volume is smaller. The value per visitor is higher. Smart teams invest in both. (Source: Erlin client data, 2026)
This is the core philosophy behind Analyze AI. We built the platform for teams who understand that SEO is evolving, not dying. AI search is an additional organic channel alongside traditional SEO, not a replacement.
How to Track These Statistics for Your Brand
Reading industry benchmarks is useful. Tracking your own numbers is what changes outcomes.
Here’s how to start.
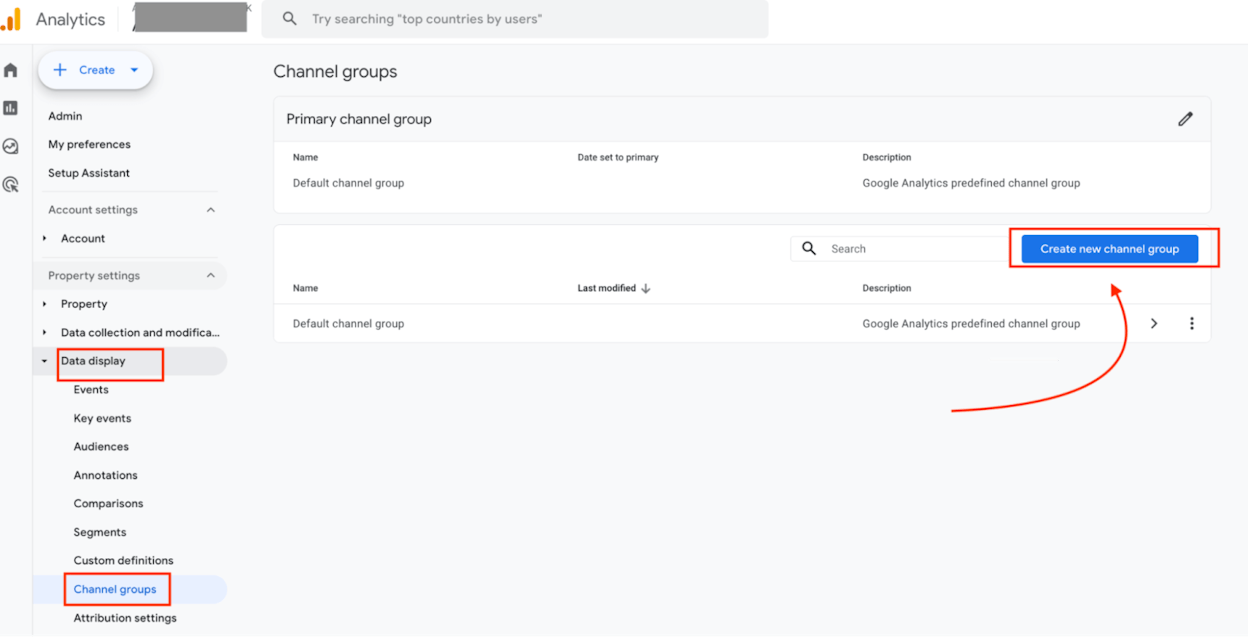
Set Up AI Traffic Tracking in GA4
Most analytics platforms don’t create a default channel grouping for AI traffic. You need to create a custom channel definition that classifies sessions from ChatGPT, Perplexity, Claude, and Gemini as a distinct AI Referral channel. Without this, your AI-driven visits get logged as direct traffic, invisible and unactionable.
Track Your AI Visibility Across Engines
You need to know which prompts trigger your brand, how often, and where competitors outrank you. This isn’t something you can do manually at scale.
Analyze AI tracks your prompt visibility across ChatGPT, Claude, Perplexity, Gemini, Copilot, and Google AI Overviews. You see which prompts mention your brand, which mention your competitors instead, and how sentiment and citation patterns change over time.
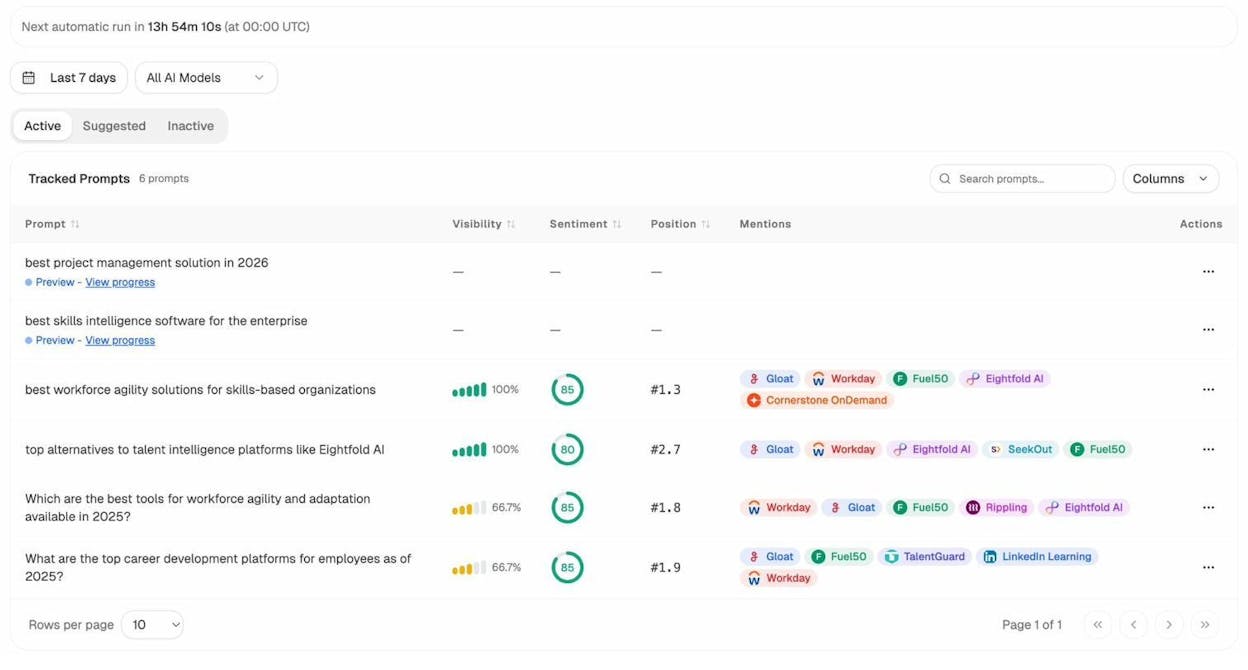
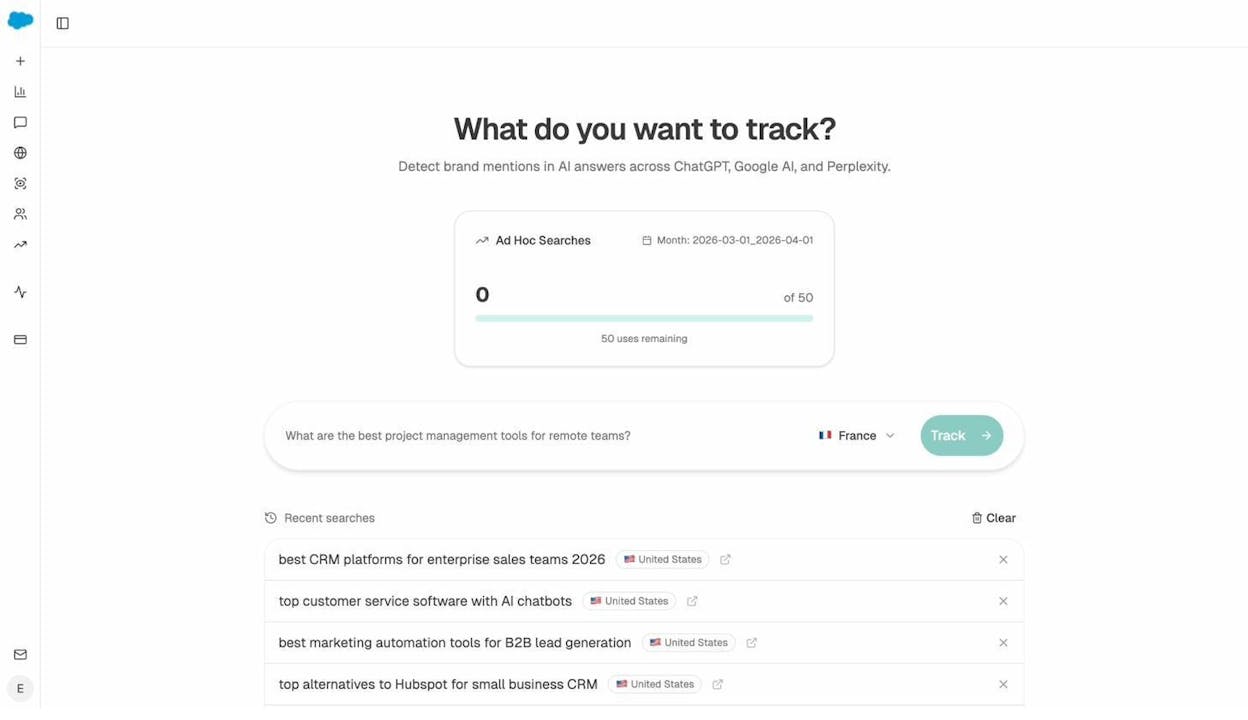
You can also run ad hoc prompt searches to check any query across all engines instantly, without waiting for a scheduled tracking cycle.
Monitor Brand Perception Across AI Engines
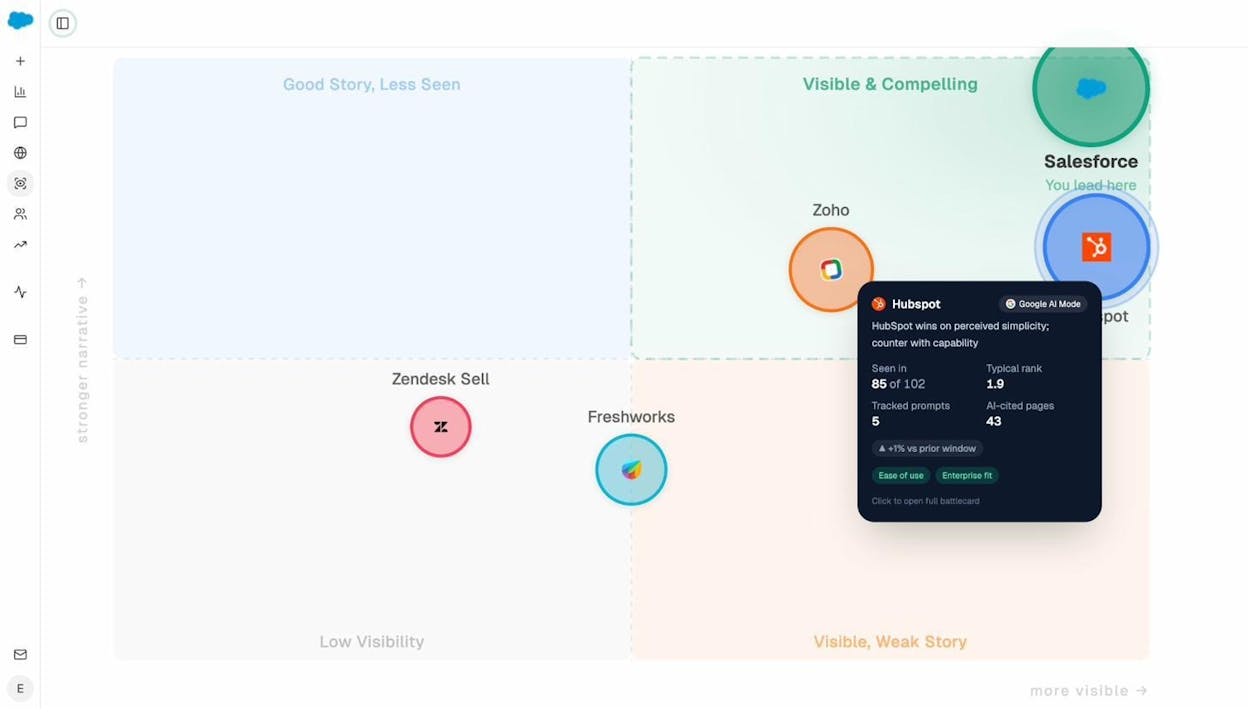
Stat #29 showed that the same brand can be scored 79 points apart across engines. You need to know how each engine perceives you.
Analyze AI’s Perception Map positions all tracked brands on a quadrant based on visibility, rank, sentiment, and proof signals. It tells you where you’re strong, where you’re weak, and what to fix first.
Automate Ongoing Monitoring
This is where most teams stall. They set up tracking once, then never check it consistently.
Analyze AI’s Agent Builder solves this. With 180+ nodes, 34 pre-built data recipes, and direct integrations with GA4, Google Search Console, Semrush, DataForSEO, HubSpot, Notion, WordPress, and Slack, you can build agents that run on a schedule and surface insights before you have to look for them.
A few examples of what teams build:
Daily visibility regression alert. A scheduled agent runs every morning, pulls prompts where your visibility dropped, and sends a Slack notification with the affected prompts and a draft counter-content brief.
Weekly competitive narrative report. Every Monday at 7am, an agent compiles your share of voice, competitor movements, AI traffic changes, and new HubSpot deals into an executive summary. It exports a DOCX and emails it to leadership. No analyst chase required.
Citation decay alert. A daily agent flags pages that are losing AI citations faster than traffic, so your content team can intervene before the damage compounds.
Brief-to-publish pipeline. When a content brief moves to “approved” in Notion, an agent generates research, builds an outline, produces a full draft with brand voice injected, scores it for AI search readiness, and publishes to WordPress if it passes. If it doesn’t pass, it messages the writer with specific gaps to fix.
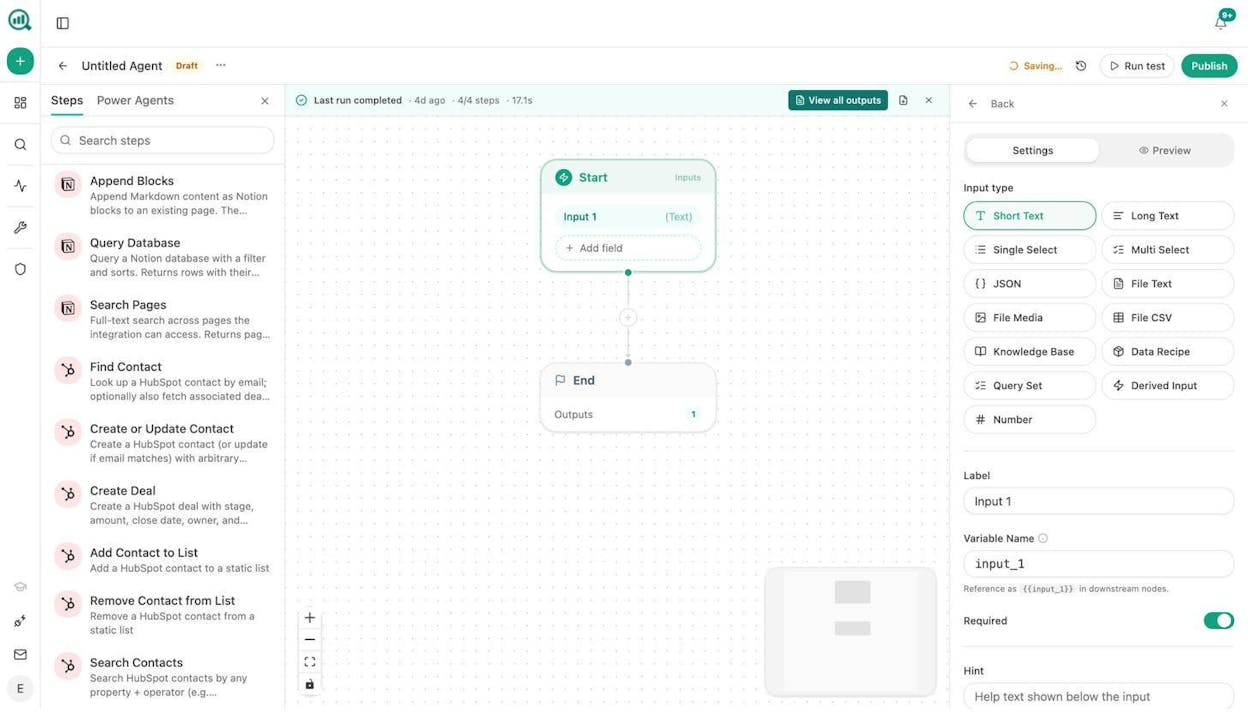
These aren’t templates you pick from a menu. You compose agents from primitives. The Agent Builder gives you the same surface area as Zapier, Make, and n8n combined, but pre-wired to the SEO, content, and AI search data your team already pays for.
Stay Informed Without Logging In
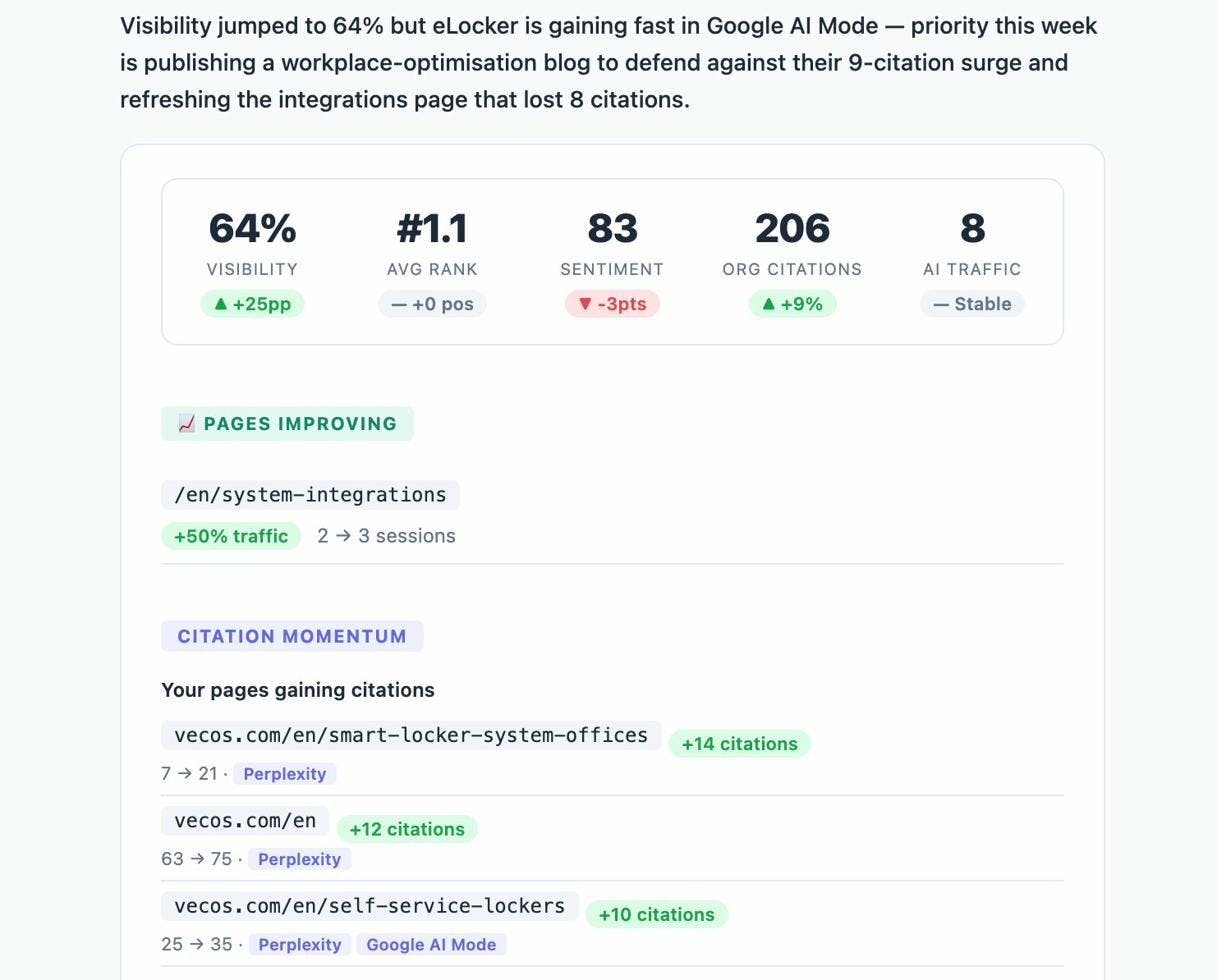
Not everyone on your team will log into a dashboard. Analyze AI sends weekly email digests that summarize your AI visibility, top-performing prompts, competitor movements, and citation changes. Your CMO reads an email on Monday morning and knows exactly where things stand.
What These Statistics Mean for Your Strategy
These 50 statistics point to three conclusions.
First, AI search is growing fast enough to matter, but traditional SEO is not dying. The brands winning in 2026 are the ones investing in both channels. They’re not abandoning keyword research and backlinks. They’re adding AI visibility tracking, citation optimization, and content structured for AI extraction on top of their existing SEO foundation.
Second, each AI engine behaves differently. Optimizing for “AI search” as a monolith will fail. You need engine-specific data on which content formats, source types, and topics each engine prefers for your category.
Third, the execution gap is massive. 92% of marketers plan to optimize for AI search, but only 16% systematically track performance. Teams building measurement and automation frameworks now will have compounding data advantages over teams that start later.
If you’re ready to close that gap, start tracking your AI visibility with Analyze AI.

Ernest

Ibrahim


