


Summarize this blog post with:
Page speed is one of the few SEO levers where the work pays off twice. A faster page ranks better in Google. The same faster page also keeps the visitor on screen long enough to convert, whether that visitor came from a traditional search result or from an AI answer with your link in the citations.
The problem is that the standard PageSpeed Insights interface only lets you check one URL at a time. If you have a sitemap with 500 pages, that’s a full afternoon of copy-pasting. Bulk testing fixes that.
In this article, you’ll learn how to run a bulk PageSpeed Insights website speed test on dozens or hundreds of URLs at once, what each metric in the report actually means, and how to decide which pages deserve speed work first. You’ll also learn a step the standard speed-testing guides never mention, which is pulling the URLs that already get traffic from ChatGPT, Perplexity, and Gemini, then prioritizing those pages for optimization so you don’t lose hard-won AI visibility to a slow load.
Table of Contents
What is a bulk PageSpeed Insights website speed test?
A bulk PageSpeed Insights website speed test runs Google’s PageSpeed Insights (PSI) check against multiple URLs at once and returns the same data you’d see in the standard tool, just in a single table you can sort and filter.
Under the hood, every method we cover below sends each URL to the PSI API, which then runs Lighthouse and pulls Chrome User Experience Report (CrUX) data for that page. You get back two categories of metrics for each URL.
The first category is lab data from Lighthouse. These are simulated scores Google generates by loading your page in a controlled environment. The Lighthouse report grades Performance, Accessibility, Best Practices, and SEO from 0 to 100.
The second category is field data from CrUX, which represents what real Chrome users actually experienced when they visited your page over the last 28 days. This is where Core Web Vitals (CWV) live: Largest Contentful Paint (LCP), Interaction to Next Paint (INP), and Cumulative Layout Shift (CLS). Google has confirmed that CWV is part of page experience signals used in ranking.
PSI also splits results two more ways. Page-level data is for the specific URL you tested. Origin-level data is the aggregate experience across the whole domain. And every result is reported separately for mobile and desktop, because the same page can score very differently on each.
When you bulk test, you get all of this for every URL in one pass.
The metrics you’ll see in the report
Before you run a test, you need to know what the columns mean. Most teams skip this step and end up reacting to red cells without knowing what they actually point to.
Core Web Vitals (field data)
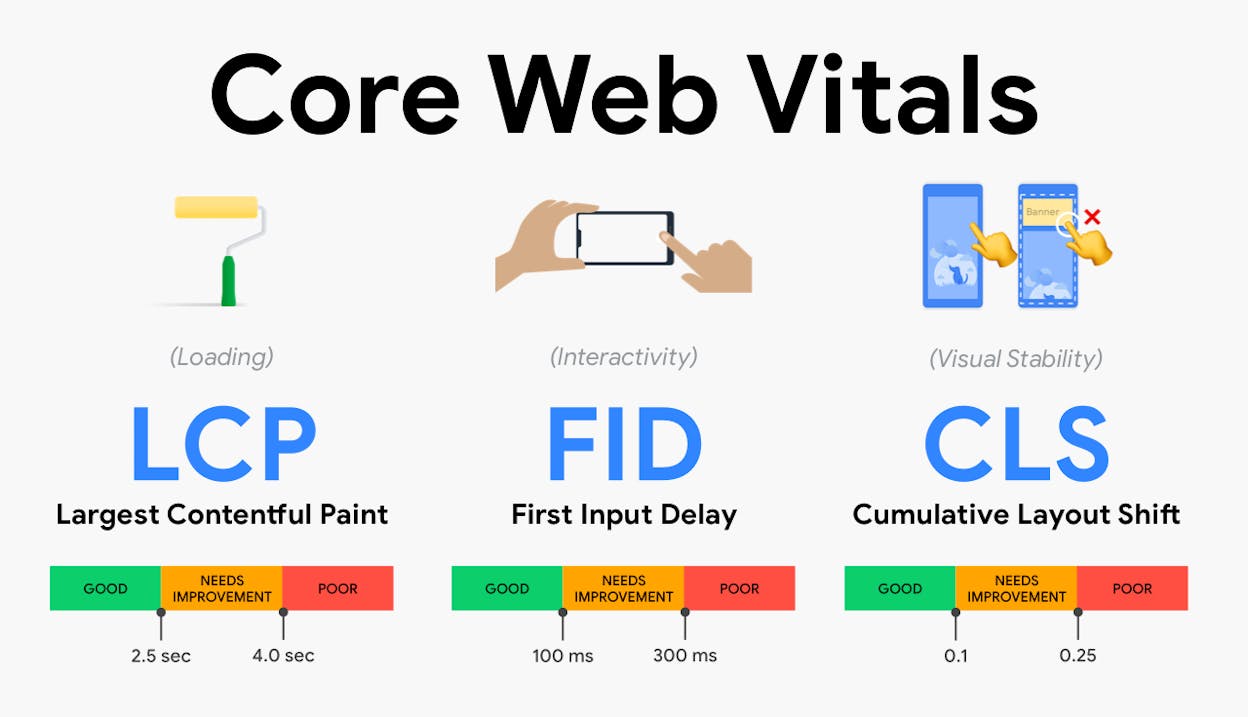
These are the three metrics Google currently uses for page experience.
|
Metric |
What it measures |
Good |
Needs improvement |
Poor |
|---|---|---|---|---|
|
LCP (Largest Contentful Paint) |
How long until the biggest visible element loads |
≤ 2.5s |
2.5–4.0s |
> 4.0s |
|
INP (Interaction to Next Paint) |
How responsive the page feels to clicks and taps |
≤ 200ms |
200–500ms |
> 500ms |
|
CLS (Cumulative Layout Shift) |
How much the layout jumps around as the page loads |
≤ 0.1 |
0.1–0.25 |
> 0.25 |
INP replaced FID (First Input Delay) in March 2024, so older guides still mentioning FID are out of date.
Lighthouse scores (lab data)
Lighthouse runs a synthetic test and gives a 0–100 score for four categories. Performance is the one most directly tied to speed, but Accessibility and Best Practices catch issues that often hurt page experience too.
A Lighthouse Performance score below 50 is poor. 50–89 is needs improvement. 90 or above is good. Bulk testing makes it easy to spot the cluster of pages stuck below 50, which is usually where to start.
Why mobile and desktop diverge
A page that scores 95 on desktop can score 40 on mobile. This is normal. Mobile networks are slower, mobile CPUs are weaker, and PSI uses a deliberately throttled mobile profile to simulate a mid-range Android device on 4G. Since Google indexes the mobile version of your site, the mobile score is the one that matters for ranking.
How to run a bulk PageSpeed Insights website speed test
There are four practical ways to do this. The right one depends on how many URLs you’re testing, how often you need to repeat the test, and how comfortable you are with a script.
Method 1: Bulk speed test using the PSI API and Google Sheets
This is the simplest no-code option for testing 5–100 URLs. You’ll need a free Google PageSpeed Insights API key.
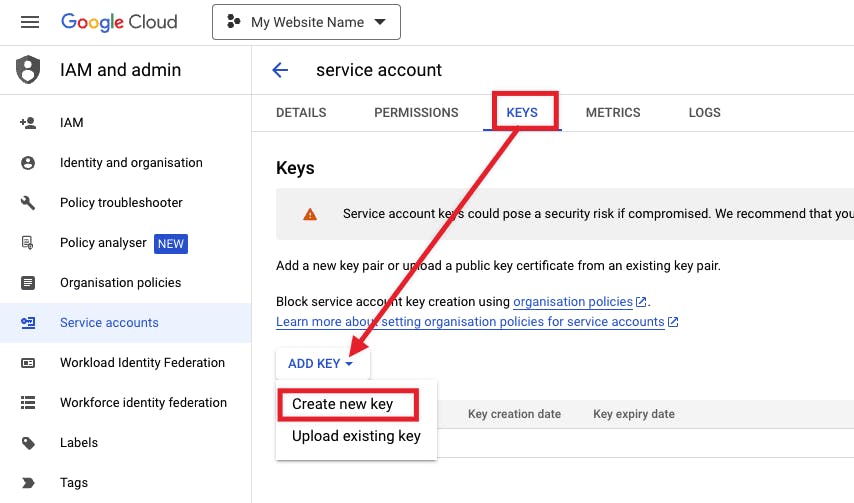
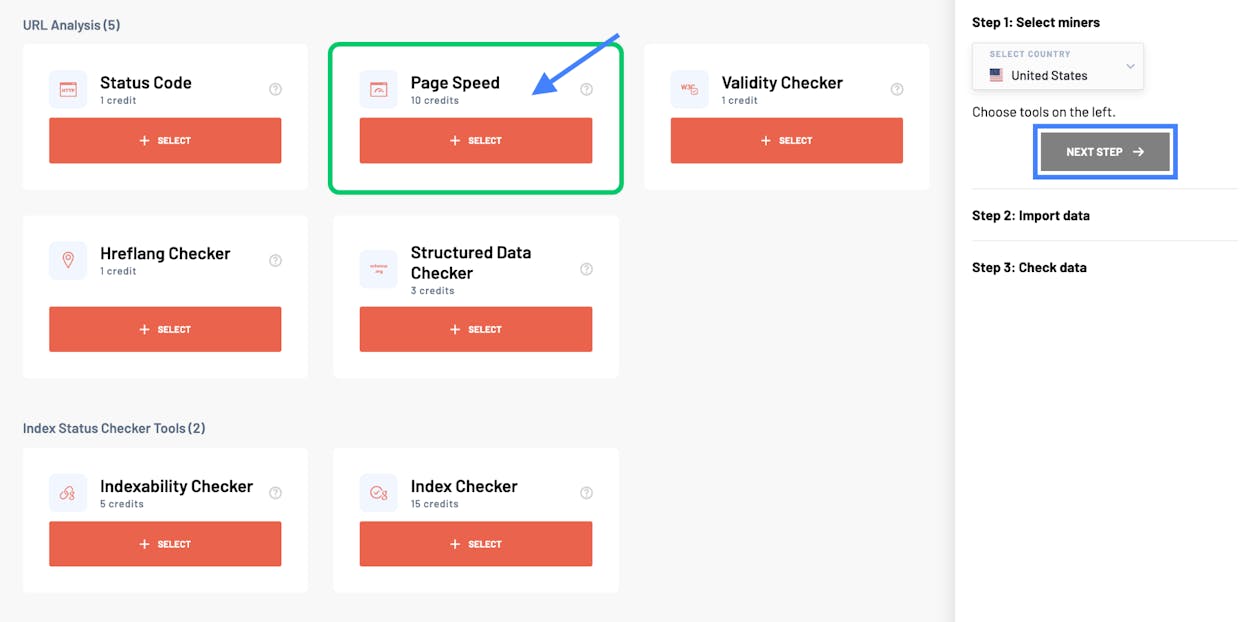
Step 1: Generate a PSI API key. Go to the PageSpeed Insights API Get Started page and click “Get a Key.” Pick a Google Cloud project (or create one), and copy the key.
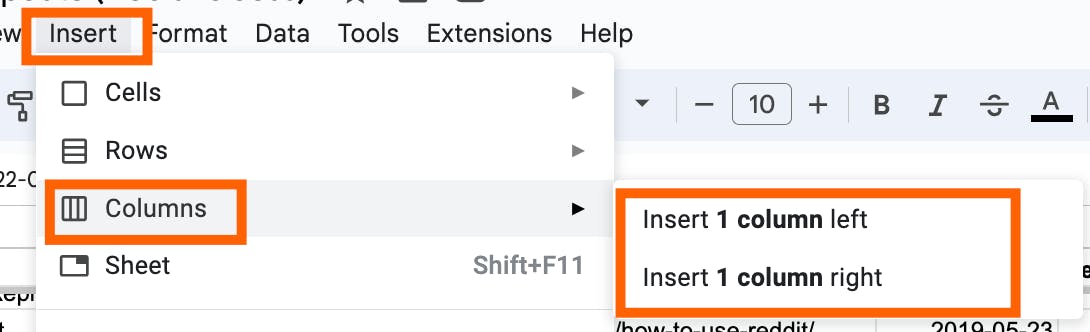
Step 2: Open a fresh Google Sheet. In column A, paste the URLs you want to test, one per row. Add headers in row 1 for Performance, LCP, INP, CLS, and Mobile-LCP if you want both desktop and mobile.
Step 3: Add an Apps Script to call the PSI API. Click Extensions > Apps Script. Paste in a function that takes a URL, hits https://www.googleapis.com/pagespeedonline/v5/runPagespeed?url=...&key=...&strategy=mobile, parses the JSON response, and returns the metrics you want. There are several public scripts on GitHub that do exactly this and you can adapt one in 10 minutes.

Step 4: Run the script. Save, authorize, and run. The script loops through every URL in column A and fills in the metric columns. For 50 URLs, expect 3–5 minutes.
Why this method works: It’s free, you own the data, and you can re-run it as often as you want by adding a date column. The downside is the PSI API has a quota of 25,000 queries per day, which is plenty for a single domain but can hit limits if you’re testing competitor sites at scale.
Method 2: Free bulk page speed testing tools
If you don’t want to set up a script, several free web tools accept a list of URLs and return a table. Most of them are wrappers around the same PSI API you’d call yourself, so the data is identical. The convenience is that they handle the loop, the rate limiting, and the rendering for you.
When picking a tool, check three things. First, does it return both mobile and desktop scores? Second, does it return field data (CWV) and not just Lighthouse lab scores? Third, can you export the table to CSV? If any of those is missing, find another tool.
For broader audits beyond just speed, take a look at our roundup of the best SEO audit tools, which covers tools that combine speed testing with crawl data, indexing checks, and on-page issues.
Method 3: Custom script with Python or Node
For testing more than 100 URLs, or for setting up a recurring weekly speed audit, a script is the right move. The PSI API is straightforward and a 30-line Python script using requests can pull mobile and desktop CWV plus Lighthouse for any URL list and write the output to CSV.
The added benefit is that you can chain it into the rest of your stack. Pipe the CSV into BigQuery, drop a Looker Studio dashboard on top, and you have a live speed monitor that emails you when LCP for a critical page slips into the red.
Method 4: Crawler-based audit tools
Site-wide crawlers like Screaming Frog, Sitebulb, and the auditors built into SEO software can call the PSI API as part of a full crawl. The advantage is that you don’t need to maintain a URL list because the crawler discovers your URLs by following links from the homepage. The disadvantage is that these tools are slower and you’re paying for crawl features you may not need if all you want is a speed report.
Pick this method when speed testing is part of a larger technical audit you’re already running.
How to read the results
A bulk speed report is only useful if you know which numbers to act on. Here’s the read order I use.
Start with mobile, not desktop. Google’s index is mobile-first, so a page that’s slow on mobile is slow in the eyes of search.
Sort the table by mobile LCP, descending. Pages with LCP above 4 seconds are dragging your domain’s CWV. These get fixed first.
Cross-check with INP next. A page can have a fine LCP but feel laggy because of heavy JavaScript. Sort by INP and flag anything above 500ms.
Check CLS last. CLS is usually fixable with CSS (reserving space for images, ads, and embeds) and rarely requires backend changes, so it’s a low-effort high-impact column.
Compare page-level vs origin-level. If a specific landing page has good CWV but the origin score is poor, that means most of your other pages are dragging the average down. The opposite tells you the page itself has a problem the rest of the site doesn’t.
A common mistake is to obsess over the Lighthouse Performance score. The 0–100 number is a synthetic estimate. Field data (real CWV from CrUX) is what Google actually uses for ranking. If the two disagree, trust the field data.
Which pages should you test first?

If you have 5,000 URLs in your sitemap, you don’t need to test all of them on the first pass. You need to test the URLs where speed actually moves revenue. There are three buckets.
Top organic traffic pages. Pull your top 50 pages from Google Search Console by clicks. These are the pages where a one-second LCP improvement compounds across thousands of sessions.
Money pages. Anything with a form, a checkout, or a high-intent CTA. Even if traffic is modest, a slow load on a pricing page costs you sign-ups directly. INP matters most here because users are interacting, not just reading.
Pages getting AI-referred traffic. This is the bucket most teams miss entirely. ChatGPT, Perplexity, Claude, Gemini, and Copilot now send measurable traffic to specific URLs on your site. Those URLs deserve the same speed attention as your top organic pages, and probably more, because each AI-referred visitor has already passed through a recommendation filter and is high-intent.
You can identify AI-referred URLs by looking at the referrer in GA4 (filter for chatgpt.com, perplexity.ai, gemini.google.com, copilot.microsoft.com), or you can use Analyze AI’s AI Traffic Analytics which handles the filtering and gives you a clean landing pages report with bounce rate and engagement per page.
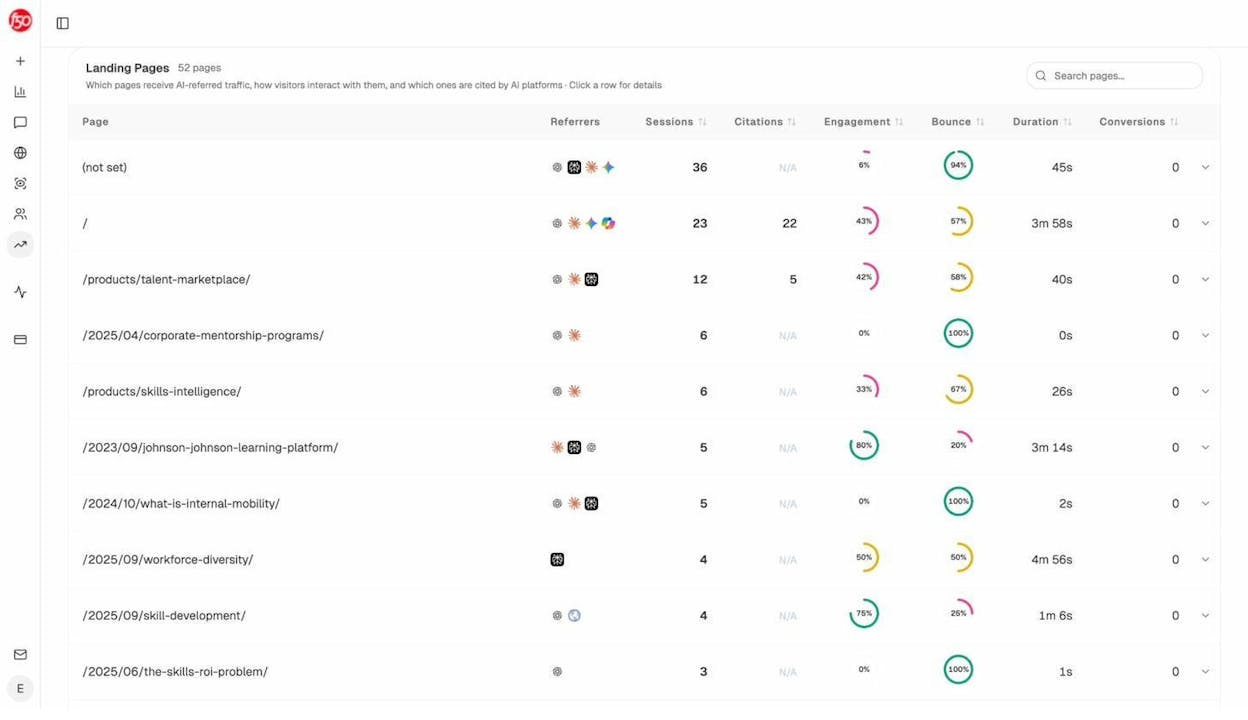
The page list above is exactly the input you want for your bulk PSI test. Take the URLs in that table, paste them into your bulk speed checker, and you’ve identified the pages where speed is most likely to be costing you AI-driven conversions.
Why page speed matters for AI search (not just Google)

A common pushback we hear is “AI engines pull from training data, so why does page speed matter for AI visibility?” The honest answer is that page speed matters for AI search, but for different reasons than it matters for Google.
For traditional SEO, speed is a direct ranking signal. For AI search, speed is mostly a downstream conversion signal. Here’s the chain.
AI engines cite pages they can crawl and parse. If your page takes 8 seconds to render and the AI crawler times out, you’re not in the citation pool. This is rare but real, especially on JavaScript-heavy pages where the content only appears after hydration.
More common is what happens after the citation. An AI engine cites your page. A user clicks through. If the page takes 6 seconds to load, that user is gone before the content appears. The citation worked but the conversion didn’t. Look at the bounce column in the screenshot above and you can see this happening on real pages. A 100% bounce rate on an AI-referred page often means the user landed, waited, and left.
This is also why we don’t believe SEO is dead and AI search is replacing it. The two are converging. Pages that load fast, present content cleanly, and answer the query directly do well in both Google and ChatGPT. The technical SEO foundation you’re building when you fix LCP for Google is the same foundation that keeps AI-referred visitors on the page long enough to convert. Our broader take on this is in the 4 pillars of SEO for AI search and in our GEO vs SEO breakdown.
The practical takeaway is straightforward. When you’ve finished your bulk speed test, sort the results by AI-referred traffic, not just Google clicks. The top 10 pages on that list are where speed work pays off twice.
Comparing your speed against competitors
Bulk speed testing is also useful for competitive benchmarking. The PSI API will run on any public URL, including your competitors’ pages.
Pick a target keyword, take the top 10 URLs ranking for it, and run the same bulk test on those URLs. You’ll get a side-by-side view of where you sit on mobile LCP, INP, and CLS versus the pages you’re trying to outrank. If every page in the top 10 has a mobile LCP under 2.5 seconds and yours is at 4.1, that’s a concrete gap you can close.
The same logic applies to AI search. If a competitor is being cited by ChatGPT for a query you also want to be cited for, run their cited URL through PSI alongside your own. If theirs is faster, that’s one more reason the AI engine and its users prefer their page. Analyze AI’s competitor intelligence shows you which competitor URLs are getting cited, so you know which pages to benchmark against.
What to do after the test
A bulk speed report is a list, not a fix. Once you have the table, the work is to translate red cells into specific changes.
For LCP problems, the usual culprits are unoptimized hero images (compress to WebP, serve via a CDN, add fetchpriority="high"), render-blocking JavaScript (defer or async non-critical scripts), and slow server response times (cache aggressively, upgrade hosting if your TTFB is consistently above 600ms).
For INP problems, the culprit is almost always heavy JavaScript on the main thread. Audit third-party scripts, defer analytics that don’t need to fire on first paint, and break up long tasks.
For CLS problems, reserve space with width and height attributes on images, video, and iframes. Avoid injecting content above existing content as the page loads.
After your fixes ship, re-run the same bulk test 28 days later. CrUX field data is a 28-day rolling window, so improvements take that long to fully reflect.
Closing thought
A bulk PageSpeed Insights website speed test is the fastest way to spot where your site is leaking conversions. The standard advice stops there. The better workflow is to combine it with the list of pages already getting traffic from AI engines, fix those first, and re-test on a 28-day cadence.
If you’re tracking AI visibility separately, you’ll already have that page list ready. If not, you can pull it from GA4 referrers or from a tool that does the filtering for you. Either way, the rule stays the same. Speed work compounds when you direct it at pages that are already winning, in both Google and AI answers.
Ernest
Ibrahim


