


Summarize this blog post with:
In this article, you’ll learn how to build the SEO reports that actually get noticed at an enterprise. You’ll see the metrics to track for each audience in your company, the dashboards that get budget approved, the cadence to ship them on, and how to fold AI search performance into a reporting system that already covers Google. By the end, you should be able to walk into any meeting at your company and tell a clear story about the value SEO is creating, with the numbers to back it up.
Table of Contents
The five audiences and the reports they need
The first decision in enterprise SEO reporting is not which tool to use. It is which audience you are reporting to. Each audience makes a different decision, cares about different metrics, and tolerates a different cadence.
|
Audience |
What they decide |
KPI focus |
Cadence |
|---|---|---|---|
|
Executives (CEO, CMO, CFO) |
Whether SEO gets more budget |
Revenue, pipeline, ROI, AI-attributed revenue |
Quarterly |
|
Marketing leadership |
Channel mix and content investment |
Share of voice, traffic value, AI visibility |
Monthly |
|
Product or business unit owners |
Which pages to ship or refresh |
Page-level traffic, conversions, AI citations |
Bi-weekly |
|
Content and SEO team |
Day-to-day priorities |
Rankings, indexing, winners and losers, AI prompt position |
Weekly |
|
Cross-functional partners (PR, demand gen) |
Where to co-invest |
Brand mentions, branded vs non-branded, AI sentiment |
Monthly |
Build one report per row, not one giant dashboard for everyone. The rest of this guide walks through the metrics inside each of those reports and how to assemble them.
Tie SEO metrics to money for executives
Executives speak one language fluently, and that language is money. If your report can map SEO activity to revenue, every other conversation gets easier. The pieces of that map are:
-
Revenue. Closed-won revenue attributed to organic search. Pull from your CRM, with multi-touch attribution for assisted conversions.
-
Marketing-qualified leads (MQLs) and sales-qualified leads (SQLs). Organic-sourced leads that marketing and sales accept as legitimate. Reporting raw form fills tells executives nothing about quality.
-
Customer lifetime value (LTV) and customer acquisition cost (CAC). The unit economics that show whether SEO is profitable per customer. Most CFOs care more about CAC payback than about traffic.
-
Return on investment. Yearly returns over fully loaded program costs, including people, tools, and content production.
-
Cost efficiency. Money saved by not running paid ads on terms you already own organically. This metric gets cleaner during a downturn budget cycle.
-
Opportunity value. The projected return of a project, often phrased as “if we reclaim 100 broken links worth $X each, that is $Y in recovered traffic value.” Use our broken link checker to size the link reclamation pitch.
-
AI-attributed pipeline. Leads and revenue from sessions that originated in ChatGPT, Perplexity, Gemini, Claude, and Copilot.
That last metric is the one most enterprise reports still miss. AI engines now drive a meaningful share of high-intent traffic for many B2B companies, and if your report leaves it out, your CFO is comparing your number to a competitor whose CFO is not.
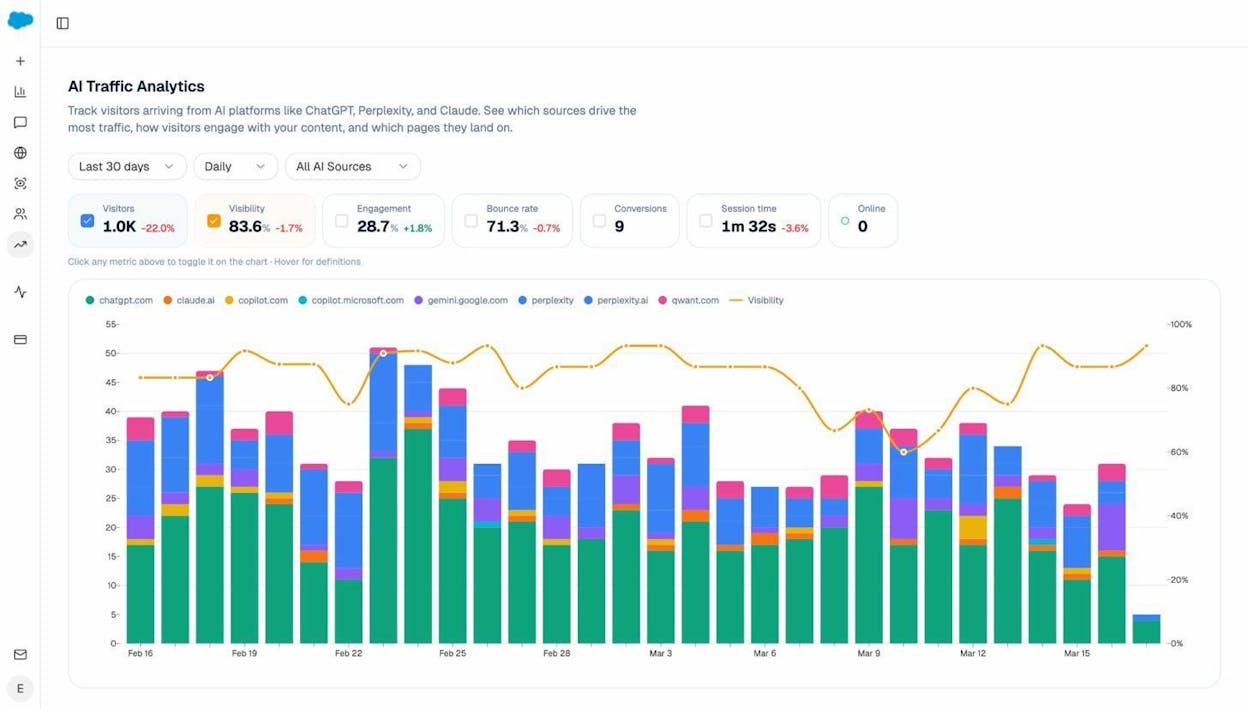
This is the AI Traffic Analytics view inside Analyze AI. It breaks down visitors arriving from each AI engine alongside engagement, bounce, and conversions, so you can give executives a defensible number, “AI search drove $X in attributable pipeline this quarter,” in a format that fits next to your Google numbers.
Reports for comparing your performance to competitors
At an enterprise, no one wants to lose to a competitor. That makes competitive comparison the second most useful framing for getting buy-in. There are four reports worth building.
Market landscape view
A market landscape report gives you a one-screen comparison of your domain against the three to ten companies you actually fight for SERP space. The metrics that matter on this view are organic traffic value, organic traffic, number of indexed pages, and domain authority.
You can build this in any SEO platform that supports a competitor overview report. Add a year-over-year date comparison so the chart shows direction of travel, not just position.
![[Screenshot of an SEO platform’s competitor overview chart with three competitor domains plotted on traffic value vs traffic, with YoY comparison enabled]](https://www.datocms-assets.com/164164/1778091005-blobid2.png?auto=format,compress&w=1248&fit=max)
For a quick sanity check on any domain you do not have in your platform yet, the free website traffic checker and website authority checker cover the basics.
The competitor SEO scorecard
A scorecard digs deeper. For each competitor, you pull a row of comparable metrics and show period-over-period change. The minimum useful scorecard includes:
-
Share of voice across a tracked keyword set
-
Share of traffic value across the same set, calculated as your traffic value divided by the sum of all tracked competitors’ traffic value
-
Total organic traffic value
-
Total organic traffic
-
Referring domains
-
Domain rating
-
Average content score on overlapping keywords
Share of traffic value is more honest than share of voice because it weights for commercial intent. Two companies can have the same share of voice but very different share of traffic value if one ranks for keywords that monetize and the other ranks for top-of-funnel volume. Show executives share of traffic value.
To build the scorecard, pull each metric from your SEO platform’s API and assemble the rows in Looker Studio or Google Sheets. The keyword rank checker and SERP checker can fill gaps if you need to spot-check a particular competitor’s position before paying for a platform seat. Our walkthrough on SEO competitor analysis covers the scorecard build end to end.
AI search competitor visibility
The scorecard above only tells you who wins on Google. To tell the full story, you need the equivalent for ChatGPT, Perplexity, Gemini, and Claude. The metrics translate, but the views look different.
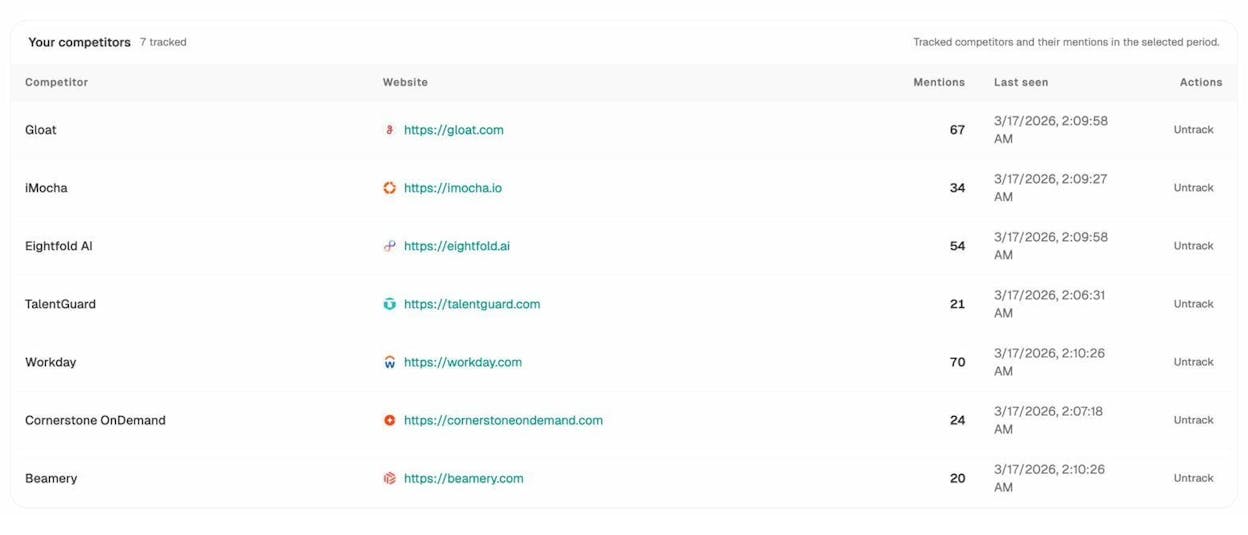
Three views matter for the AI side of the scorecard. First, a tracked competitor list with mention counts per AI engine over your selected period. The view above is from Competitor Intelligence and shows how often each rival is mentioned across your tracked prompt set.
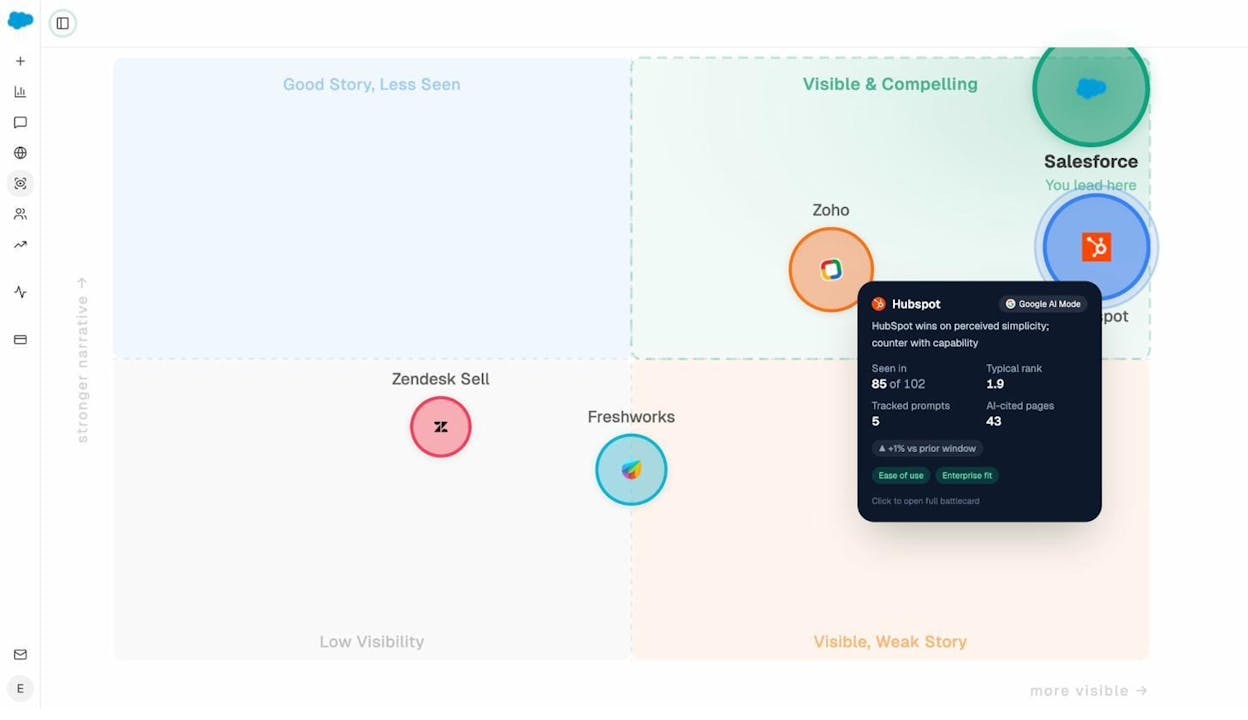
Second, a perception map that plots competitors on visibility versus narrative strength. The Perception Map answers a question executives actually ask in board meetings, “do AI engines paint us as the leader or the budget option?” That single chart is worth more than ten dashboards of mention counts.
Third, a citation source view that shows which third-party domains AI engines cite when they answer questions in your category.
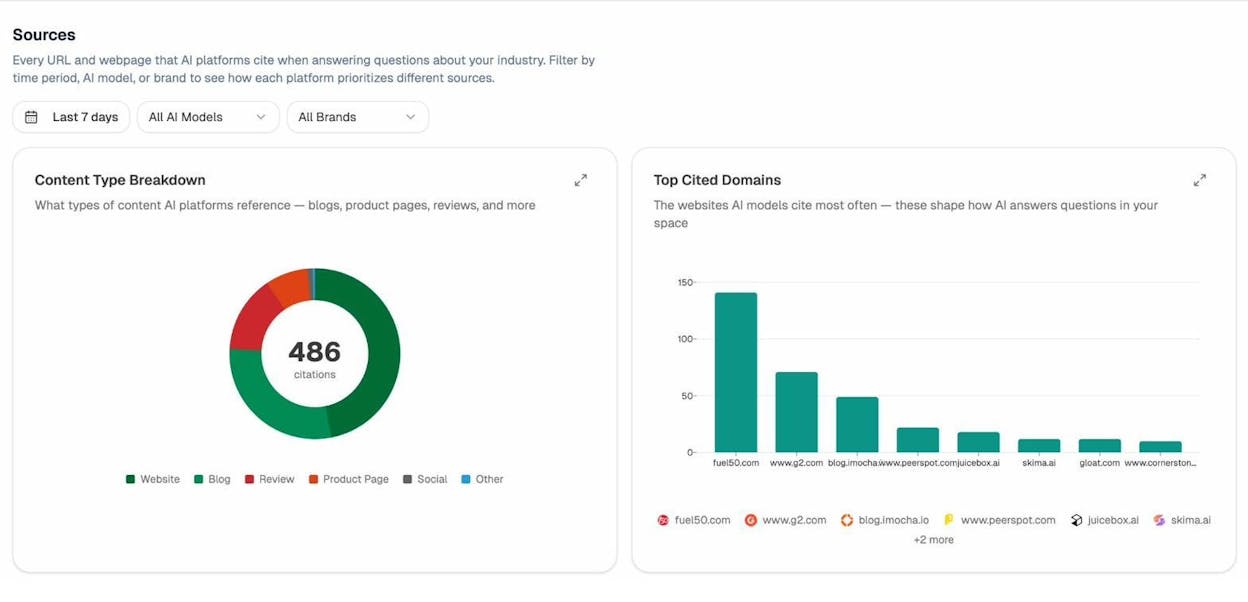
The Sources view, powered by Citation Analytics, exposes the publishers and review sites that AI engines lean on. If you see G2, PeerSpot, or a specific industry blog cited heavily and you have weak presence there, that is a digital PR brief, not an SEO brief.
Content opportunity reports
Both Google and AI engines reward unique coverage. A content opportunity report shows which topics your competitors rank for and you do not.
In a traditional SEO platform, you would run a content gap analysis with three competitor domains as the input, then export the keyword list. Most exports are noisy because they include dozens of variants of the same query. Cluster them by parent topic before you brief any writers.
![[Screenshot of a content gap report showing keyword variants for three competitor domains side by side with traffic estimates]](https://www.datocms-assets.com/164164/1778091020-blobid6.png?auto=format,compress&w=1248&fit=max)
![[Screenshot of the same export pasted into a keyword research tool with a “cluster by parent topic” filter applied]](https://www.datocms-assets.com/164164/1778091026-blobid7.jpg?auto=format,compress&w=1248&fit=max)
The same logic applies to AI search. Instead of keyword gaps, look for prompt gaps, the questions in your category where competitors are mentioned and you are not. The Discover feature surfaces these prompts automatically, and Prompt Discovery helps you build the watch list. Pair each prompt gap with a content brief the same way you would pair a keyword gap with a blog post. That keeps your editorial calendar serving both channels with a single piece of work.
Competitor monitoring
Once you know your gaps, set up a passive monitor for new and updated competitor pages. Most SEO content explorers can filter for “first seen in last 30 days” on a competitor domain. That gives you an early warning when a competitor invests in a new theme.
Add the AI search version on top, alerting when competitors gain or lose citations across AI engines. The weekly digest handles this automatically so the team sees momentum shifts without logging in.
For the full AI competitive intelligence workflow, our deep dive on outranking competitors in AI search covers each step. To compare the broader category of tools, see LLM monitoring tools.
Reports for your own site
Now flip the lens inward. The reports below cover the metrics your own team and adjacent teams will ask about every week.
Year-over-year and month-over-month snapshot
Pull one row of your seven core metrics with their YoY and MoM change. Keep it simple. Domain rating, referring domains, organic traffic, organic traffic value, indexed pages, branded clicks, and non-branded clicks is plenty.
![[Screenshot of a YoY/MoM snapshot table from your SEO platform showing each core metric with absolute number and percentage change]](https://www.datocms-assets.com/164164/1778091036-blobid9.png?auto=format,compress&w=1248&fit=max)
If you have connected Google Search Console to your platform, use the platform’s stored history rather than GSC’s 16-month limit. That gets you multi-year YoY views that GSC alone cannot give you.
Brand vs non-brand split
This is the trap that catches most enterprise SEO reports. Branded traffic is largely a function of paid spend, PR, product launches, and sales activity. Reporting it under “SEO performance” inflates your numbers and hides whether your actual SEO program is working.
Build a regex of branded terms (your brand name, common misspellings, product names) and apply it as a filter in Looker Studio against your GSC dataset. Show three lines on the chart, total clicks, branded clicks, and non-branded clicks. Your team’s contribution lives in the non-branded line.
![[Screenshot of a Looker Studio custom field showing the regex filter for branded terms and a comparison chart with three lines for total, branded, and non-branded clicks]](https://www.datocms-assets.com/164164/1778091037-blobid10.png?auto=format,compress&w=1248&fit=max)
Top pages and top keywords scorecard
Every enterprise has a list of “the pages that matter.” Pricing, the homepage, the top three product pages, the top revenue-generating blog posts. Track those in their own report with a four-week trend on impressions, clicks, position, and conversions.
![[Screenshot of a top-pages comparison view showing five critical URLs with sparklines for impressions, clicks, average position, and conversions over the last four weeks]](https://www.datocms-assets.com/164164/1778091042-blobid11.jpg?auto=format,compress&w=1248&fit=max)
When something on this list moves, you discuss it. When everything moves at once, you investigate an algorithm update before someone else flags it.
Winners and losers for pages and keywords
A “winners and losers” view sorts your URLs by traffic delta over the last 28 days. The wins tell you what to double down on. The losses tell you where to refresh, redirect, or de-index.
Run this report every Monday. It catches problems before they show up in monthly reviews, and it gives you a constant supply of refresh candidates without needing a dedicated audit project.
Ranking reports for Google and AI engines
Standard rank tracking is well covered by every major platform. The piece most enterprise reports still miss is the AI equivalent, your average position across the prompts that matter. For an overview of options on the traditional side, see our breakdown of keyword tracking tools.
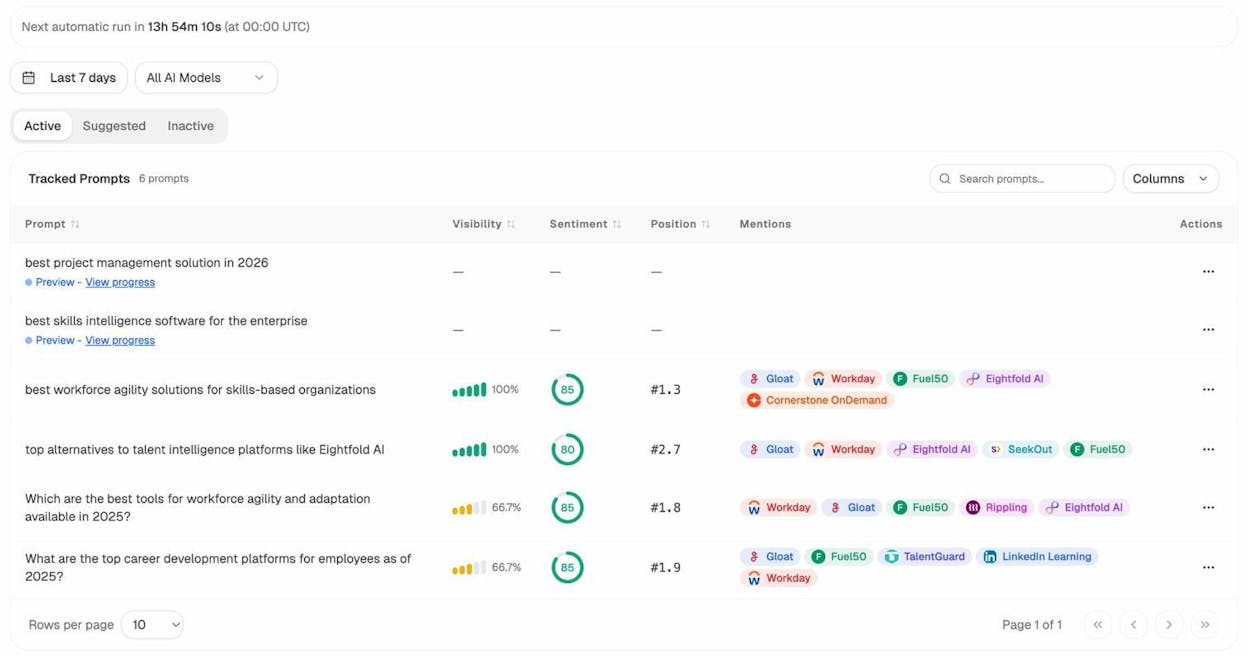
Inside Analyze AI, Prompt Tracking gives each prompt a visibility score, an average position, a sentiment score, and a list of which competitors get mentioned alongside you. If a product owner runs a specific business unit, give them a tag of prompts to track. That mirrors how product owners use rank tracker tags on the Google side, and it lets each owner see their own slice of AI visibility without needing the full platform view.
Index coverage
Use Google Search Console’s Page Indexing report to see how many of your pages are indexed and which ones are not, with reasons. For enterprise sites with thousands of URLs, sort by reason and assign each cluster (soft 404, crawled but not indexed, redirected) to the right team.
![[Screenshot of GSC Page Indexing report showing indexed and not-indexed page counts with reason buckets like “Crawled - currently not indexed” and “Discovered - currently not indexed”]](https://www.datocms-assets.com/164164/1778091048-blobid13.png?auto=format,compress&w=1248&fit=max)
A common pattern at enterprise scale is that “discovered, not indexed” pages are usually thin programmatic content. “Crawled, not indexed” usually means quality. Different problem, different team, different fix.
AI traffic and landing pages
If you cannot see which of your pages AI engines are sending traffic to, you cannot double down on what works. This is where Google Analytics and most legacy platforms break down. They do not reliably tag AI referrals.
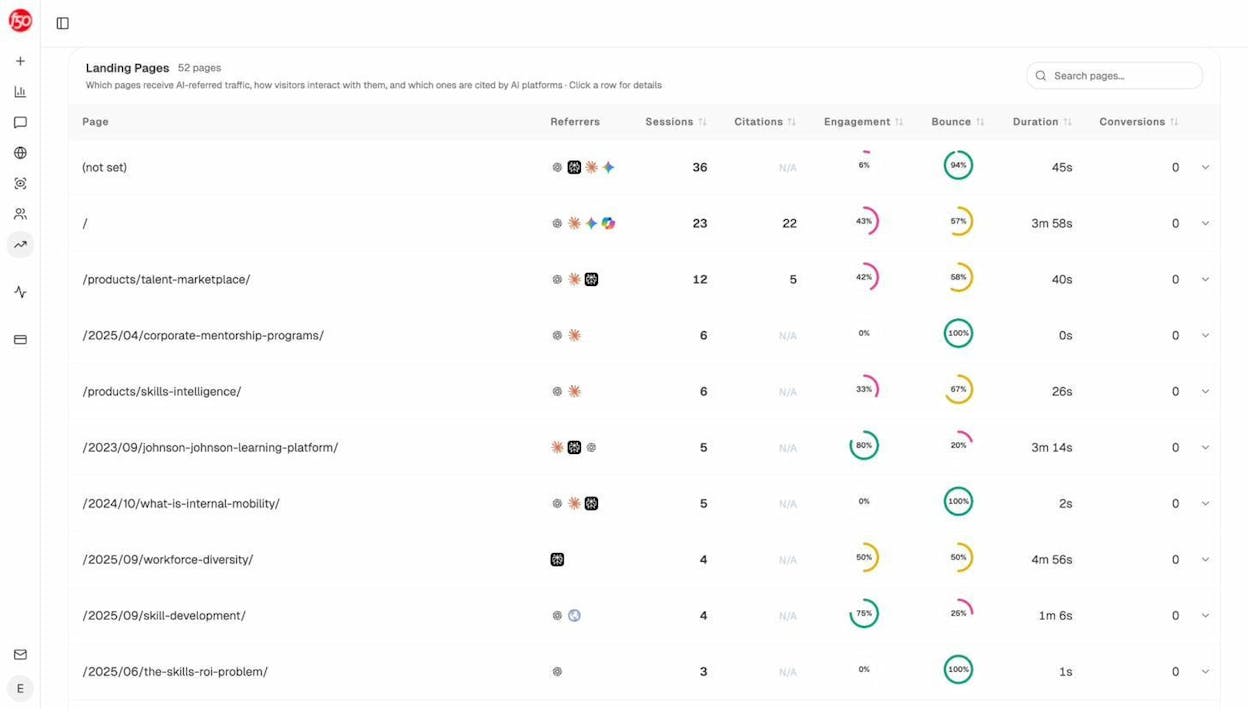
The Landing Pages view shows every page receiving AI-referred traffic, alongside which AI engines sent the visitors and how those visitors behaved on site. Pages that combine high citations with high engagement are your model. Reverse-engineer what makes them work, then replicate the structure on adjacent pages. Pages with high citations but low engagement are refresh candidates. Pages with high engagement but no citations need a structured data and Q&A update so AI engines can quote them.
Status, projects, and opportunity reports
Your boss wants to know what is shipping. The cleanest version of this report has three columns. Project name, status (in progress, blocked, complete), and impact (a metric tied to revenue or traffic value where possible). Ship it weekly to your manager and monthly to leadership.
For prioritizing the next round of projects, an impact-versus-effort matrix is hard to beat. Plot each candidate project on a 2x2 with effort on the x-axis and impact on the y-axis. Anything top-left (high impact, low effort) ships next sprint. Anything bottom-right (low impact, high effort) gets killed.
![[Screenshot of an impact/effort matrix in a slide or whiteboard tool with five SEO projects plotted as bubbles sized by traffic potential]](https://www.datocms-assets.com/164164/1778091054-blobid15.jpg?auto=format,compress&w=1248&fit=max)
The same matrix works for AI search. Plot prompt gaps, content refreshes, and structured data improvements on it. The high-impact, low-effort wins tend to be quick refreshes of pages that already get cited but rank poorly on Google, and pages that already rank on Google but never get cited. Those two patterns will keep your team busy for a quarter.
Build your enterprise SEO dashboard
Most enterprise teams report through a single source of truth, usually Looker Studio, Power BI, or Tableau. Pick one and stick with it. The choice matters less than the discipline of having every team look at the same numbers.
Pull data from four sources at minimum:
-
Google Search Console for organic clicks, impressions, and queries
-
Your SEO platform’s API for backlinks, traffic value, and competitor metrics
-
Your CRM for revenue and pipeline attribution
-
Your AI search platform for AI visibility, citations, and AI-referred traffic
Build one dashboard per audience, not one dashboard for everyone. The exec dashboard surfaces revenue, pipeline, share of traffic value, and AI visibility against three competitors. The marketing leadership dashboard adds traffic value, content scores, and a winners and losers section. The team dashboard adds rankings, indexing, and a daily winners and losers feed.
The cadence matters too. Executives get a quarterly slide deck with three KPIs. Marketing leadership gets a monthly written narrative. The team gets a weekly digest with action items. The point of separating cadences is that the story you tell at each level is different.
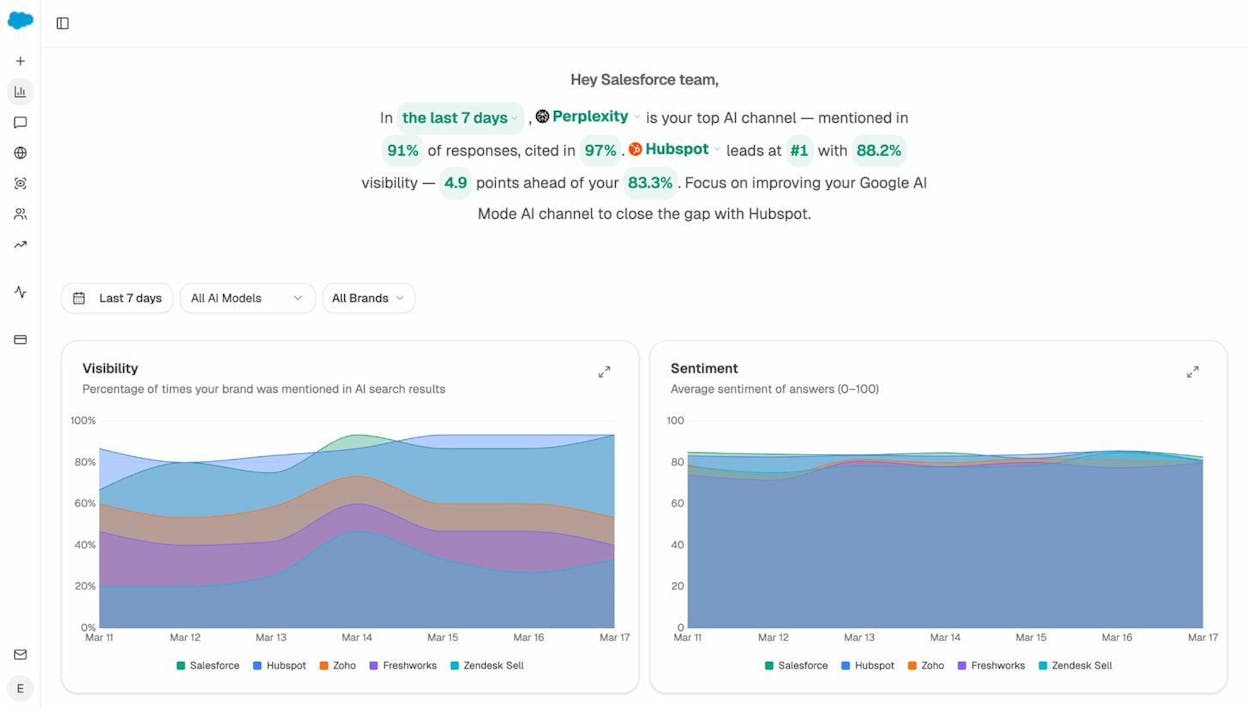
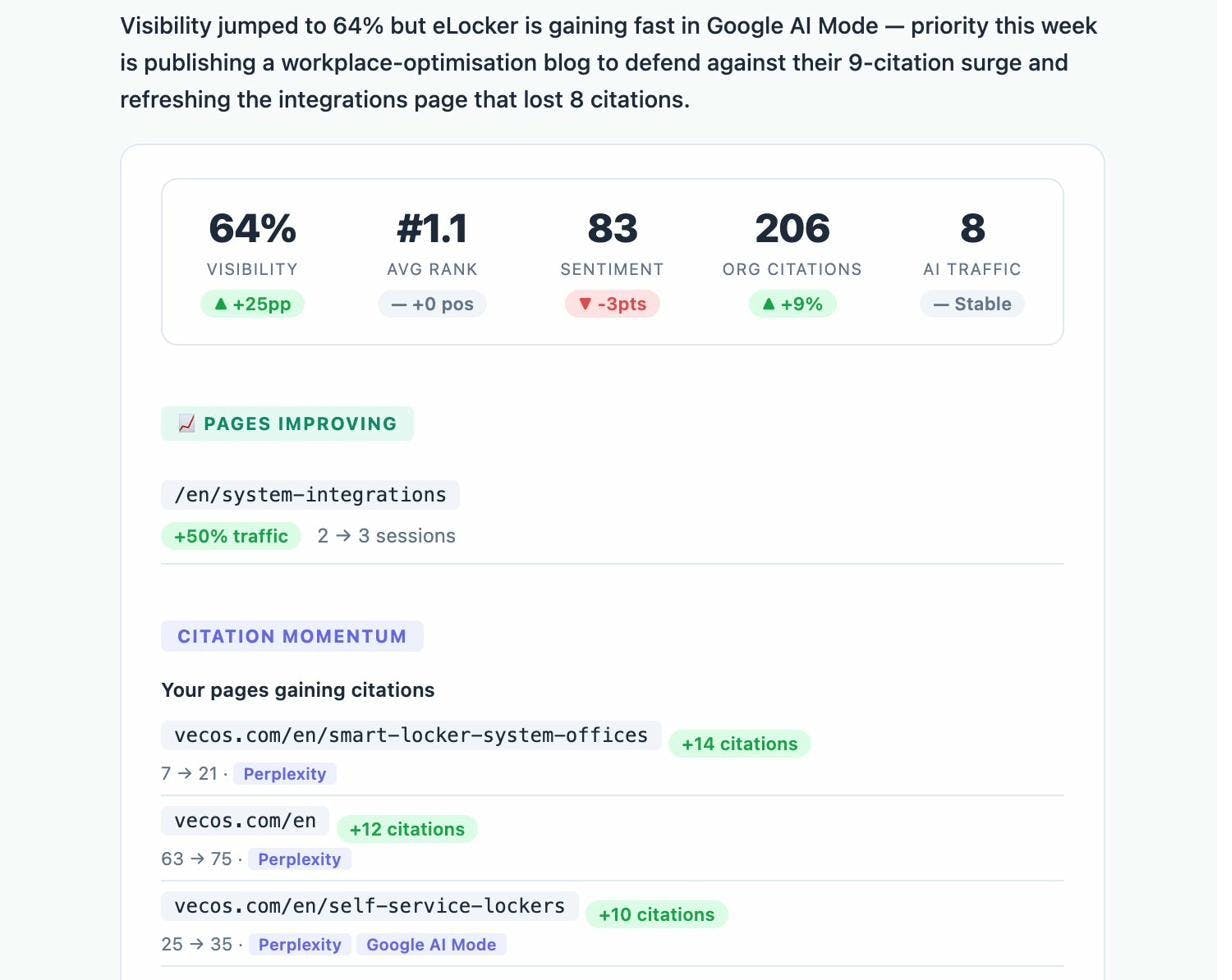
The header on the Overview above is worth highlighting. Instead of dumping ten charts on the page, the dashboard leads with a single sentence that names the winning AI engine, your visibility number, and the next action. That structure is the one to copy across every audience-specific dashboard you build.
For a deeper review of which platforms can power this, our breakdown of enterprise SEO tools and SEO reporting tools covers what works at which budget.
The story is the report
Most enterprise SEO reports fail because they show every metric to every audience. The reports that get budget approved do the opposite. They lead with one sentence such as, “non-brand organic drove $2.4M in pipeline last quarter, AI search added $310K, and our biggest competitor is now 18 points ahead on AI visibility for our top three commercial prompts.”
The metrics back that sentence up. Every chart should answer a question, every question should map to a decision, and every decision should map to revenue or pipeline.
If you cannot write the headline sentence first, the report is not ready. Build one report per audience, ship it on a cadence they can use, and treat AI search as a parallel organic channel measured with the same rigor as Google.
That is the whole game.
Ernest
Ibrahim


