


Summarize this blog post with:
In this article, you’ll learn how to calculate customer churn and revenue churn, what counts as a healthy churn rate for your business, and 10 specific ways to lower the number, including how your visibility in AI search engines now shapes the kind of customers who sign up in the first place.
Churn rate is the percentage of customers who stop paying for your product over a set period. Most teams treat it as a post-signup problem and respond with onboarding emails and discounts. That works at the margins. The bigger lever is upstream. Who finds you, what they expect when they arrive, and how the channels they came from describe your product to them.
We’ll start with the formulas, the variations most articles skip, and the benchmarks that matter. Then we’ll get into the playbook.
Table of Contents
Why churn rate matters
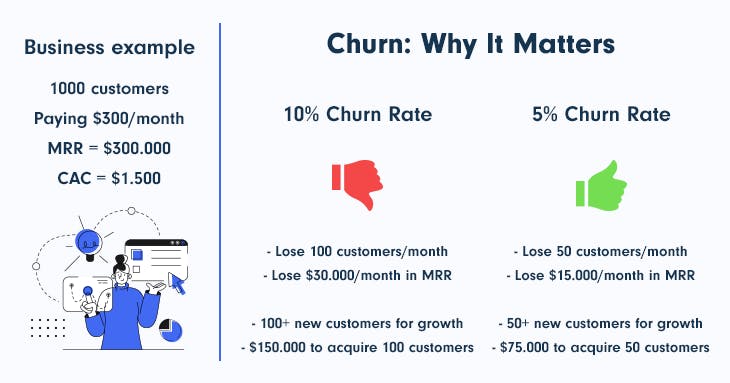
You can grow at 25% a year and still go backwards. That’s the simplest way to understand churn. Here’s what two companies look like when they grow at the same rate but one churns 5% and the other churns 10%.
|
Year 0 ARR |
Year 1 ARR |
Year 2 ARR |
Year 3 ARR |
Year 4 ARR |
||
|---|---|---|---|---|---|---|
|
25% growth, 5% churn |
$1,000,000 |
$1,200,000 |
$1,440,000 |
$1,728,000 |
$2,073,600 |
$2,448,320 |
|
25% growth, 10% churn |
$1,000,000 |
$1,150,000 |
$1,322,500 |
$1,520,875 |
$1,749,006 |
$2,011,357 |
A 5-point difference in churn costs the second company more than $400K of ARR by year five. The gap grows every year because churn compounds in the wrong direction.
That’s the headline reason. Three more.
Your unit economics depend on it. Customer lifetime value (LTV) is your average revenue per customer divided by your monthly churn rate. If churn doubles, LTV halves. Your CAC payback periods, your acquisition budgets, and your sales team’s quota math all rest on that number.
It’s an early warning system. A spike in monthly churn usually points to something specific. A bad release. A pricing change that pushed too far. A competitor launched a feature you don’t have. A support backlog. The number shows up before the customer complaints do.
It runs your forecasts and investor conversations. SaaS forecasting models and most investor diligence start with churn. If you can’t answer a question about your churn rate confidently, you can’t answer questions about anything that depends on it.
How to calculate churn rate
You actually need two formulas. One for customers, one for revenue. Most teams calculate one and forget the other.
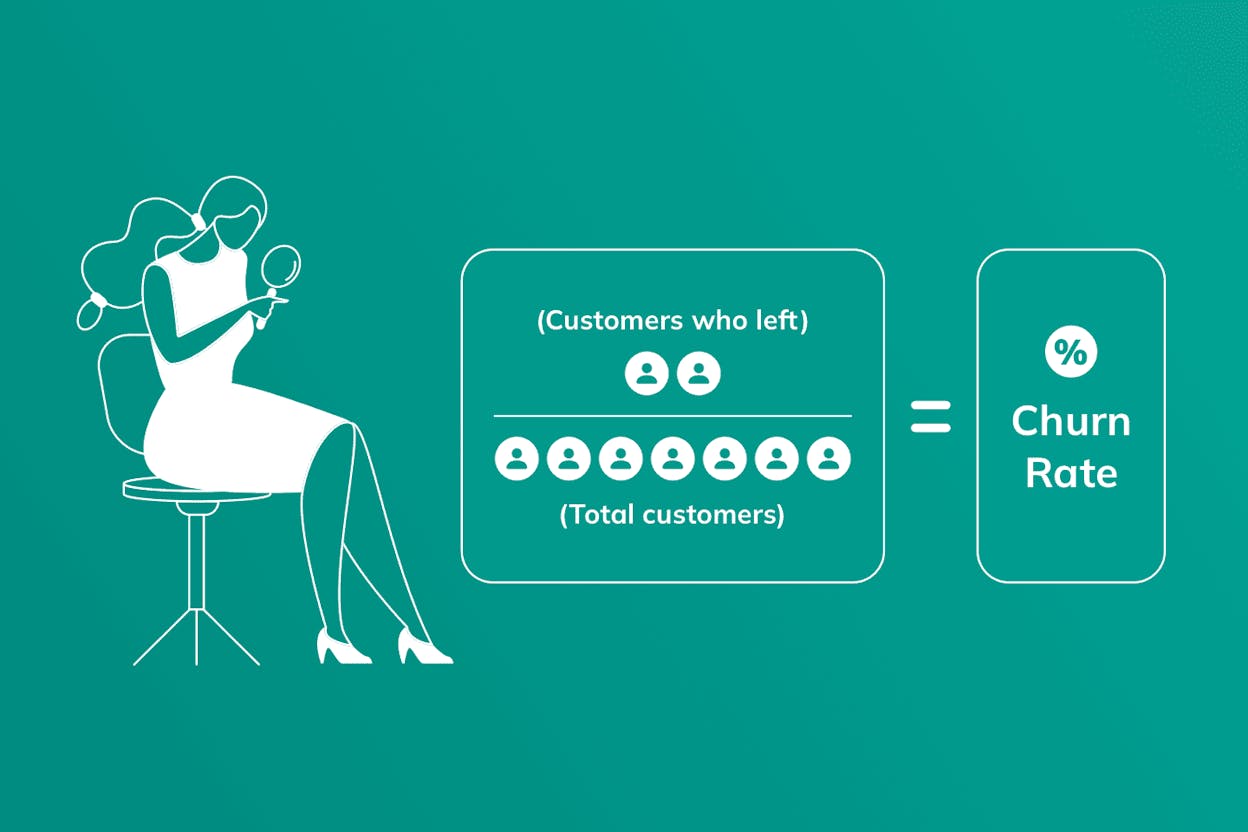
Customer churn rate
Customer churn rate = (customers lost during the period / customers at the start of the period) × 100
If you started May with 1,000 active customers and 25 of them canceled by May 31, your monthly customer churn is 2.5%.
Revenue churn rate
Revenue churn rate = (revenue lost during the period / revenue at the start of the period) × 100
This formula has a wrinkle. You only count revenue movement from customers who were already on the books at the start of the period. New signups don’t go into the numerator or the denominator.
Say you start the month at $100K MRR. Existing customers upgrade for $5K. Other existing customers cancel and take $4K with them. Two more downgrade and lose you another $2K.
Lost revenue is $6K (cancellations plus downgrades). Gained revenue from existing customers is $5K (upgrades). Net revenue lost is $1K. Your revenue churn is 1%.
That number is actually your net revenue churn, also called net dollar churn. Gross revenue churn ignores upgrades and only counts losses. In the example above, gross revenue churn is 6%.
Both numbers are useful. Gross churn tells you how much existing revenue you’re hemorrhaging. Net churn tells you whether expansion is making up for it. The goal is negative net revenue churn, which means upgrades from existing customers more than cover everything you lose.
Voluntary vs. involuntary churn
Most churn articles skip this and it costs companies real money. Voluntary churn is when a customer actively cancels. Involuntary churn is when their payment fails and you lose them by default. Research from Paddle and other SaaS billing platforms consistently shows that failed payments account for 20% to 40% of total churn for many subscription businesses. That’s revenue you’re losing without anyone making a decision to leave.
Track them separately. Involuntary churn is a billing problem you fix with dunning emails, card updaters, and retry logic. Voluntary churn is a product or expectation problem.
When monthly averages lie
The simple formula breaks down once you start comparing months across a fast-growing company.
If you acquired a lot of new customers in the last 60 days and they churn faster than older cohorts (which is usually true), your monthly churn rate will jump even though nothing about your retention actually changed. The mix shifted.
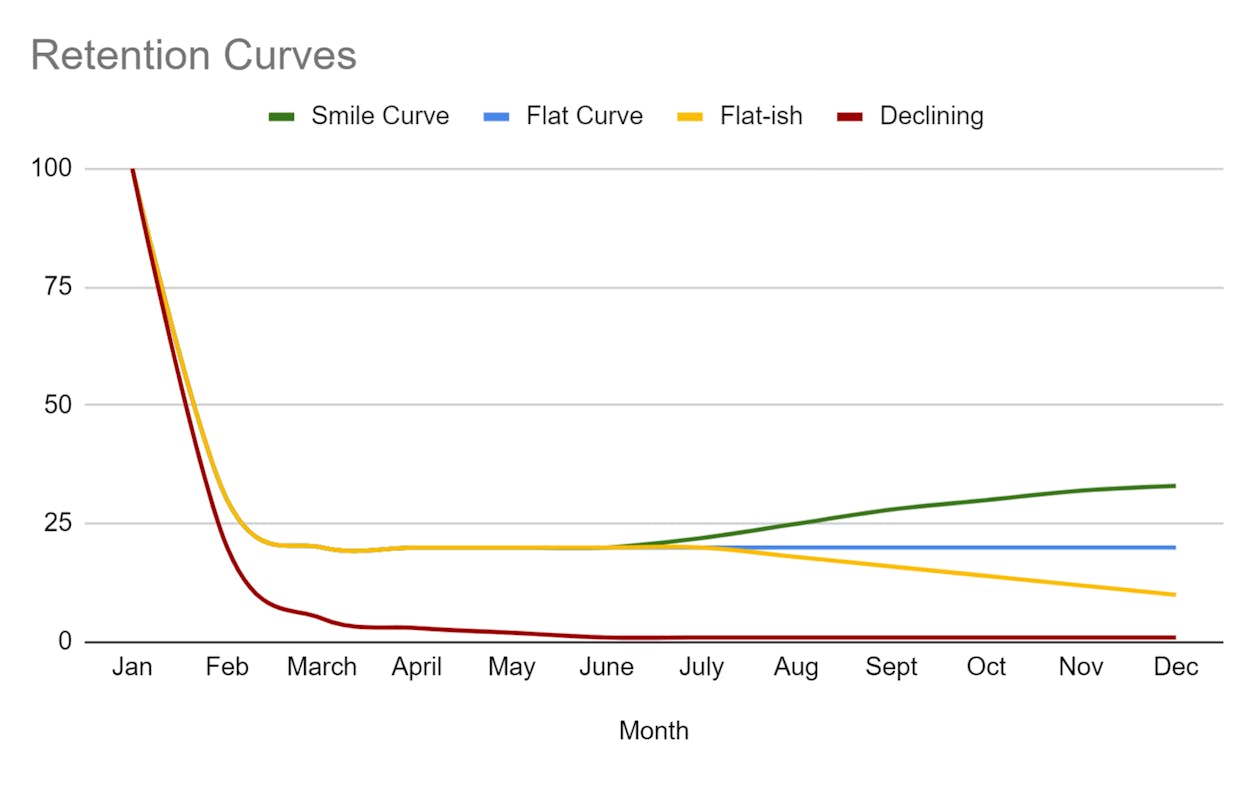
The fix is cohort analysis. Group customers by the month they signed up and track what percentage of each cohort is still paying after 1 month, 3 months, 6 months, and 12 months. You’ll see your retention curve flatten over time. That curve is the truth. Monthly churn rate is the summary that hides it.
Common pitfalls to avoid
A few traps most teams fall into:
-
Calculating annual churn by simply multiplying monthly churn by 12. It overstates losses because each month operates on a smaller base.
-
Lumping segments together when SMB and enterprise behave differently. Track them separately.
-
Comparing your number to averages from other industries. Consumer subscription churn is not enterprise churn.
-
Ignoring seasonality. SaaS used by tax preparers will spike every spring. That’s the business, not a problem.
What’s a good churn rate?
The lazy answer is “between 2% and 8% monthly.” That range is wide enough to be meaningless. A 2% monthly churn is 22% annual. An 8% monthly churn is 64% annual. Same range, completely different businesses.
A more useful answer comes from your competitors. Open Google. Search your competitor’s name plus “churn rate” or “retention rate.” Public companies disclose this on earnings calls. Private companies often have it in interviews and panel discussions.
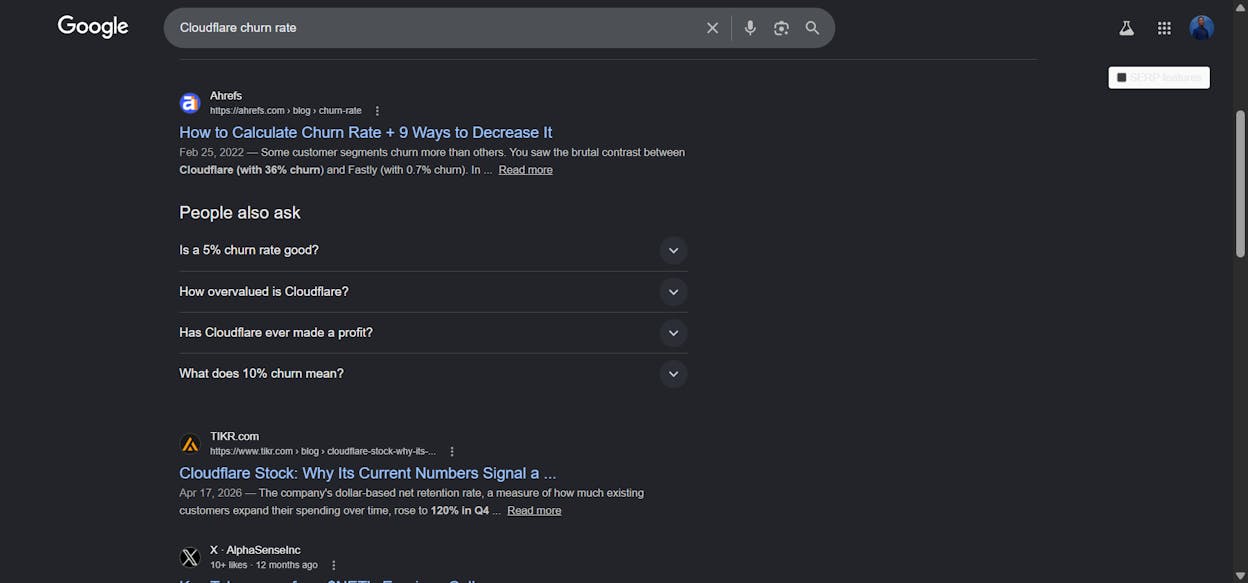
You’ll find that benchmark numbers vary wildly even within a single category. Cloudflare reports around 36% annual churn because they sell to everyone, including a free tier that churns hard. Fastly reports under 1% because they only target enterprise CDN buyers on long contracts. Same product category, completely different gravity.
A rough orientation by segment based on industry data from Recurly and Paddle:
|
Segment |
Healthy monthly churn |
|---|---|
|
B2C subscription |
4% to 7% |
|
SMB SaaS |
3% to 5% |
|
Mid-market SaaS |
1% to 2% |
|
Enterprise SaaS |
Below 1% |
Use these as a starting point and replace them with competitor-specific numbers as you find them.
10 ways to decrease your churn rate
The mistake most teams make is treating churn as something that happens after signup. The seeds of churn are planted before a prospect ever lands on your pricing page. The wrong audience signing up with the wrong expectations is half of your churn problem before any onboarding email goes out.
Here are 10 ways to reduce both the upstream and downstream causes.
1. Run real exit interviews on every cancellation
A cancel reason dropdown is not an exit interview. It’s noise. The actual reason a customer left is rarely in the four options you offered them.
Send a 15-minute Zoom request to every churned customer above a certain price tier. Most will say no. Some will say yes, especially if you offer a small gift card. Ask three questions. What were you trying to accomplish? Where did we fall short? What did you switch to and why?
Sit with the answers for a quarter before you build anything. Patterns only show up across 20 or more conversations.
2. Tighten your positioning so the wrong buyer self-selects out
Vague positioning attracts customers who think you do something you don’t. They sign up, discover the gap, and churn.
Sharp positioning does the opposite. It tells some buyers “this is not for you” before they sign up. That feels counterproductive until you watch your churn drop.
Audit your homepage, your pricing page, and the first ad creative someone clicks. What promise does each one make? Does your product deliver on it within the first 24 hours of signup? If the answer is “kind of” anywhere, that’s where churn is being manufactured.
3. Acquire the right audience from the right channels
Once your positioning is clean, the next question is whether your acquisition channels are bringing in the kind of customer your positioning is written for.
For most B2B companies, organic search delivers higher-intent prospects than paid social. They typed a specific problem. They clicked a result. They self-selected into your funnel. These customers historically retain better.
Solid keyword research is the foundation. Find keywords with buyer intent (not just informational intent) and write content that solves the specific problem behind them. We’ve covered the full process in our guide to SEO keywords and our roundup of keyword research tools.
And add AI search to the mix
Organic search is no longer just Google. A meaningful share of buyers now research products on ChatGPT, Perplexity, and Gemini before they ever type a query into a traditional search engine. AI search is becoming an additional organic acquisition channel that sits alongside SEO, not a replacement for it.
That matters for churn because of how AI search filters intent. When a buyer asks ChatGPT “what’s a good CRM for a 20-person sales team that runs on HubSpot,” the AI gives them a short list. The prospects who arrive on your site from that prompt have already been pre-qualified. They match the use case. They have the right team size. They have the integration requirement. These are the prospects who stick around.
The flip side is also true. If your brand isn’t being recommended in those high-intent prompts, you’re losing exactly the customers who would have churned the least. And you may be picking up different prospects from broader, lower-intent prompts whose use case doesn’t match your product, which means more signups that don’t last.
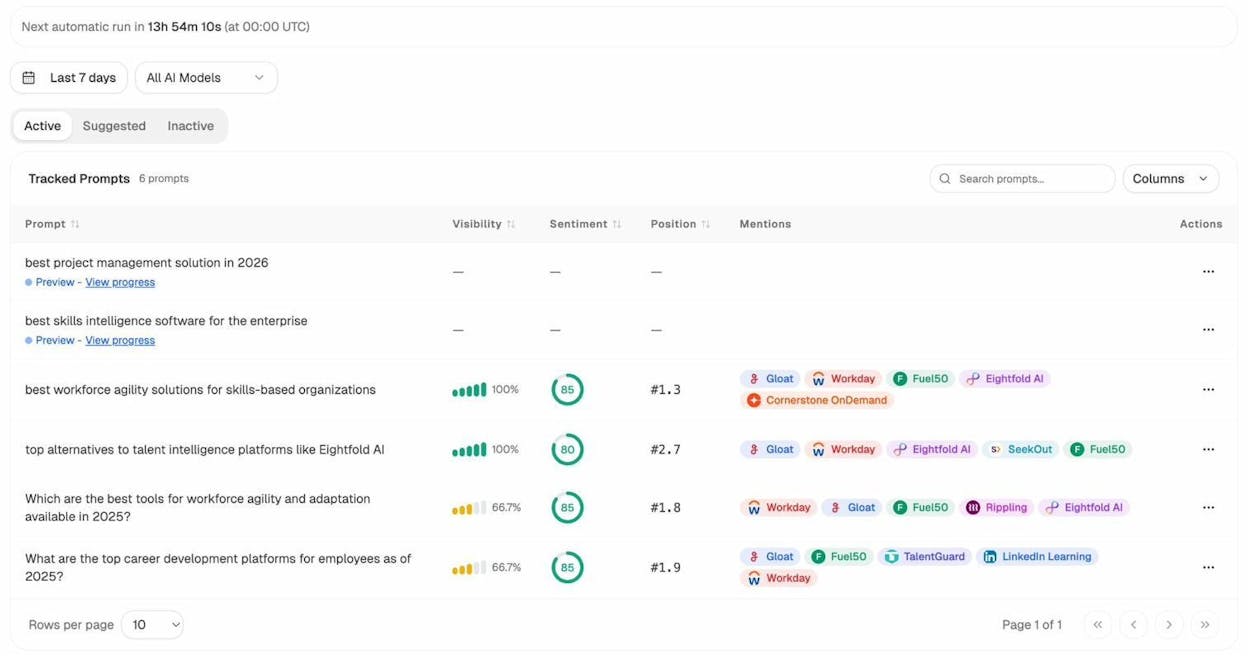
You can see which prompts your brand appears in across ChatGPT, Perplexity, Gemini, and Copilot using Analyze AI’s prompt tracking.
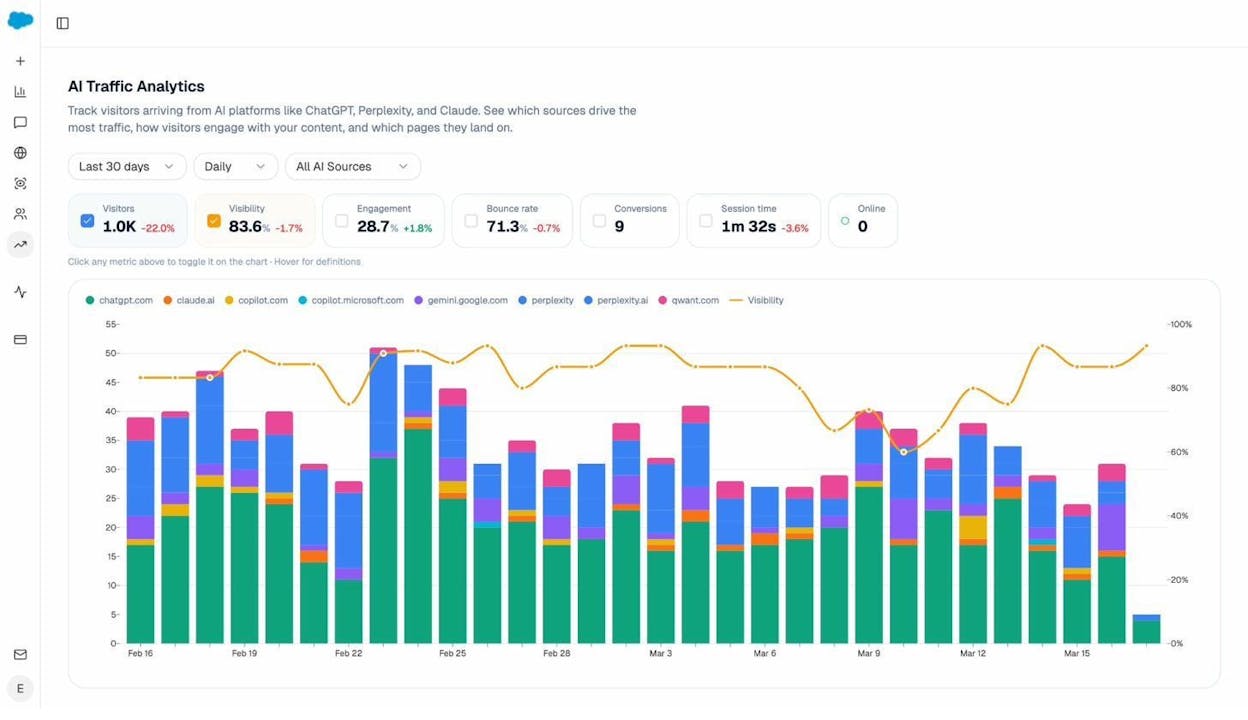
You can also see which of your pages are pulling traffic from AI search engines, which tells you which content is shaping prospect expectations before the demo.
The pattern is straightforward. High-quality acquisition does the work of the first three months of customer success. Get it right and downstream retention gets noticeably easier.
4. Shape brand perception in AI search before prospects ever talk to sales
Customers don’t churn because of what you said in your sales call. They churn because the product didn’t match the picture they already had in their head before the call started.
That picture used to be shaped by your website, reviews, and word of mouth. Now it’s also shaped by what ChatGPT says when someone asks “is [your product] good for [their use case].” If the AI answer overstates what you do, prospects arrive with inflated expectations and churn within 30 days. If the AI answer misrepresents your category positioning, they arrive expecting a different product entirely.
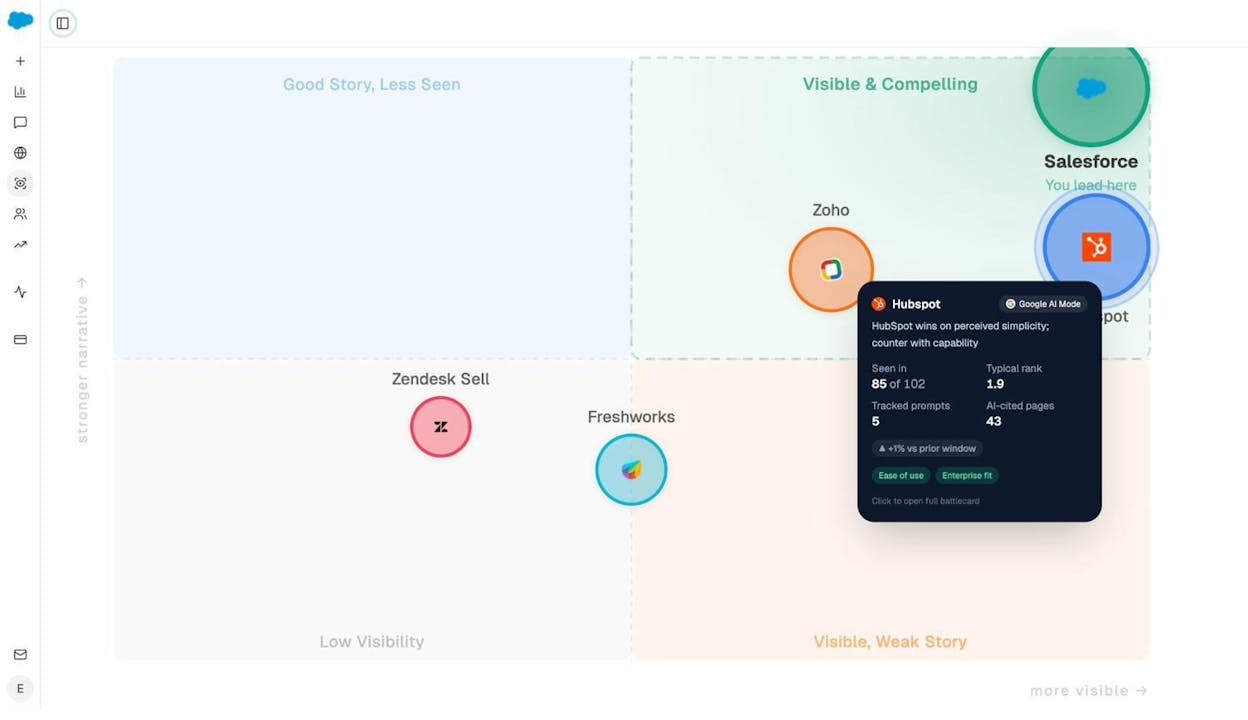
Most companies have no idea what AI search is saying about them. The first step is to find out. Analyze AI’s perception map shows you the attributes AI engines associate with your brand, where you’re stronger or weaker than competitors, and the language models keep repeating about you.
If the perception is wrong, your job is to publish content that corrects it. Case studies for the use cases you actually serve well. Comparison pages that frame your category honestly. Updates to existing pages where outdated language is still being scraped. AI engines lean on cited sources, so updating high-authority pages tends to shift the AI narrative within a few weeks. We covered the playbook in how to outrank competitors in AI search.
5. Offer a free trial or freemium tier
Subscription products that hide behind a sales call have higher churn because more decisions get made on imagined product capabilities instead of demonstrated ones.
Trials and freemium tiers do two things for retention. They let prospects self-disqualify before they pay. And they let prospects validate use cases before they commit. Both are good for your churn.
Free tools at the top of the funnel work the same way. We offer a keyword rank checker and a website traffic checker for that reason. They give prospects a low-stakes first experience that filters for fit.
6. Engineer activation, not just onboarding
Onboarding is the welcome email sequence. Activation is the moment a customer experiences the value they signed up for. Onboarding is what you send. Activation is what they do.
For Slack, activation is sending 2,000 messages within a team. For Dropbox, it’s installing on a second device. Find your equivalent. Then remove every step between signup and that moment.
The teams that win this rebuild signup flows around the activation event, not around feature tours. They cut steps. They auto-populate. They show value first and ask for configuration later.
If 80% of your churn happens in the first 14 days, and for many SaaS products it does, this is where the leverage lives.
7. Educate, don’t just market
A complex product needs a customer who understands it. A reliable way to lose customers on a complex product is to acquire them before they’re ready.
This is why the Animalz playbook of product-led content works. Educational content that genuinely teaches your category builds prospects who, by the time they sign up, already know what to expect, what the product can do, and how to use it. They don’t churn because they’re not surprised.
Channels worth investing in (in roughly that order for B2B SaaS):
-
A blog focused on solving the problems your customers face, not on your product
-
A YouTube channel that demonstrates the product inside real workflows
-
A newsletter that prospects opt into months before they buy
-
In-product tooltips and contextual help that teach as the customer works
8. Win the competitive switches you’re losing in AI search
A meaningful chunk of churn isn’t customers leaving for “better positioning.” It’s customers leaving for a specific competitor who got recommended in a specific moment.
When a customer asks “what’s a good alternative to [your product]” or “[your product] vs [competitor],” the AI answer often becomes the deciding voice. If competitors win those prompts and you don’t, you’ll keep losing renewals.
Run those prompts yourself. Note which competitors keep showing up. Note what the AI says about them and about you. Then go fix the gap. Sometimes it’s a missing comparison page. Sometimes it’s outdated reviews you haven’t responded to. Sometimes it’s a product gap your customer success team has been quietly flagging for two quarters.
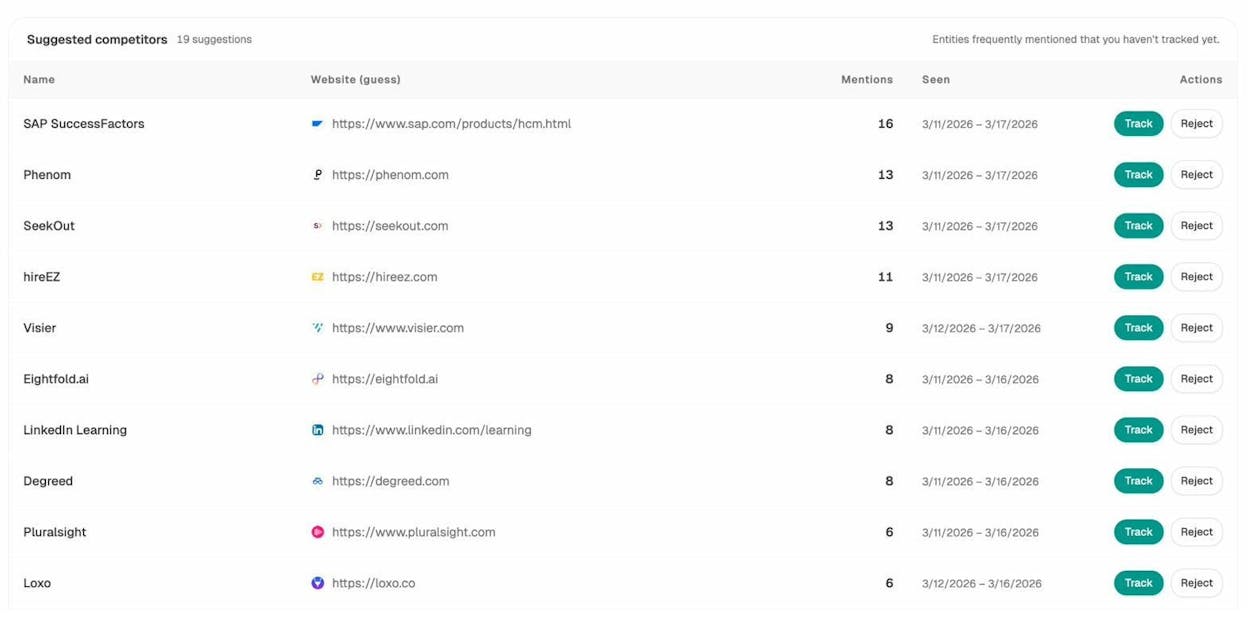
Analyze AI’s competitor intelligence shows you which prompts competitors are winning and where you’re being left out, including which of their pages AI engines are citing as the source.
For a structured approach, we walk through a 6-step SEO competitor analysis that now includes AI search rivals.
9. Track NPS and customer health, then act on the signals
NPS measures how likely customers are to recommend you on a 0 to 10 scale. Subtract the percentage of detractors (0 to 6) from promoters (9 to 10). The result sits between -100 and 100.
NPS by itself is a vanity metric. NPS combined with cohort, plan, and account health data is a churn prediction tool. Detractors churn at three to five times the rate of promoters in most SaaS data. Find them early and you can save them.
Build a customer health score that combines:
-
Last login date and login frequency trend
-
Feature adoption depth versus customers who renewed
-
Support ticket volume and sentiment
-
Payment health (upcoming card expirations, recent failed charges)
-
NPS response
Route low scores to customer success automatically. The earlier the intervention, the higher the save rate.
10. Make canceling easy
This will sound counterintuitive. Teams that work too hard to prevent cancellations through hidden cancel buttons, mandatory cancellation calls, and 12-step flows usually have higher long-term churn, not lower. Customers who feel trapped become detractors. Detractors leave reviews. Reviews shape AI search responses. AI search responses shape future prospects.
Make canceling a one-click action. Put the energy into a post-cancel survey and a polite “we’re here when you come back” email. You’ll lose the same customers either way. The version where they leave on good terms gives you cleaner data, better reviews, and the option of winning them back next year.
Final thoughts
You can’t get to zero churn. Every business has natural attrition. Customers change jobs. Businesses close. Use cases finish. The goal isn’t to eliminate the number. It’s to push it below the threshold where it stops eating your growth math.
Start with the calculation. Get the gross and net numbers separately. Pick your priority segment and benchmark against the right competitor, not an industry average. Then work your way up the list above, starting with the upstream levers. Positioning and acquisition quality move the number more than any onboarding email sequence ever will.
If you want to see what AI search engines are saying about your brand right now, you can run a free check inside Analyze AI’s ad-hoc prompt search.
Ernest
Ibrahim


