


Summarize this blog post with:
In this article, you’ll learn what Google Analytics 4 is, how to install it on your website without breaking anything, how to read the four reports that matter, how to set up conversions, how to spot the AI search traffic GA4 quietly miscounts, and how to turn the numbers into decisions that actually move your business.
Table of Contents
What is Google Analytics 4?
Google Analytics 4 (GA4) is a free web analytics tool from Google that tracks who visits your site, how they got there, and what they do once they arrive.
It is the default version of Google Analytics for every new property created since Universal Analytics was sunset on July 1, 2023. Universal Analytics measured pageviews and sessions. GA4 measures everything as an event, which means a pageview, a click, a scroll, a video play, and a purchase all sit in the same data model. Once you understand that one shift, the rest of the tool stops feeling strange.
GA4 is used by around 28 million websites, which is roughly 85% of the analytics market. That market share is the reason most blog posts, courses, and integrations you find online assume you have it installed.
Why use Google Analytics 4?
You set up a website to bring in customers. To do that consistently, you need to know three things.
-
Where your visitors come from.
-
What they do once they land.
-
Which actions are tied to revenue.
GA4 answers all three for free. Without those answers, every marketing decision is a guess. With them, you stop spending budget on channels that look busy but never convert, and you double down on the pages that are quietly bringing in money.
Is Google Analytics 4 free?
Yes. The free version covers almost every small and mid-sized business. It does have collection limits, but you will not hit them unless you process tens of millions of events per month.
The paid version is called Google Analytics 360. It costs around $150,000 per year and is built for enterprises that need raw data exports, higher sampling thresholds, and a service-level agreement. If you are reading this guide, you do not need it.
If GA4 ever feels too heavy for what you actually need, there are lighter, privacy-friendly options worth knowing about. We compared the strongest ones in our Google Analytics alternatives guide.
How to set up Google Analytics 4
Setup is three steps. Create the account, install the tag, then test the tag.
Step 1: Create your Google Analytics 4 account
-
Go to analytics.google.com and sign in with the Google account you want to own the data.
-
Click Start measuring.
-
Enter an account name. Use your company name. This is internal only.
-
Leave the data sharing settings on their defaults unless your legal team has a reason to change them. Click Next.
-
Enter a property name. Your domain works well, especially if you plan to add more sites later under the same company.
-
Set the reporting time zone and currency to match where the business actually operates, not where you happen to be sitting. Getting this wrong will skew every report you ever pull.
-
Enter your industry and business size. Click Next.
-
Pick Web as the platform.
-
Enter your website URL. Be exact about HTTPS vs HTTP and www vs non-www. A mismatch here causes duplicate hostnames in your reports.
-
Name your data stream and click Create stream.
-
Copy the Measurement ID. It starts with G- followed by ten characters. You will need it in step 2.
![[Screenshot of the GA4 web stream details page showing the Measurement ID]](https://www.datocms-assets.com/164164/1778179442-blobid1.png?auto=format,compress&w=1248&fit=max)
Step 2: Install the GA4 tag on your website
Pick the path that matches your stack.
WordPress. Install the Site Kit by Google plugin, connect it to your Google account, and select the GA4 property you just created. Site Kit injects the tag for you and adds a basic dashboard inside WordPress.
Shopify. Go to Online Store > Preferences, scroll to the Google Analytics section, and paste your Measurement ID. Shopify handles the rest, including ecommerce events.
Wix. Open Marketing & SEO > Marketing Integrations, click Connect under Google Analytics, paste the Measurement ID, and save.
Webflow. Open your project settings, go to the Custom Code tab, and paste the gtag.js snippet from your GA4 admin into the Head Code field. Publish the site.
Anything else. Copy the full gtag.js snippet from your GA4 admin under Admin > Data Streams > [your stream] > View tag instructions > Install manually and paste it into the <head> of every page on your site. A full list of CMS-specific instructions is maintained on the Google Analytics Help Center.
![[Screenshot of the GA4 install manually screen showing the gtag.js snippet]](https://www.datocms-assets.com/164164/1778179451-blobid2.png?auto=format,compress&w=1248&fit=max)
If you plan to add multiple tracking tags later, like Meta Pixel, LinkedIn Insight, or HubSpot, install Google Tag Manager once and load every tag through it instead. It takes longer to set up the first time and saves hours every month afterward.
Step 3: Test that the tag fires
Skipping this step is the most common reason beginner reports look broken weeks later.
Use Google Tag Assistant. Open the Tag Assistant page, enter your URL, and click Connect. Tag Assistant will load your site in a new window and show every tag that fires on every page you click.
![[Screenshot of Tag Assistant showing a successful GA4 tag fire with green checkmarks]](https://www.datocms-assets.com/164164/1778179451-blobid3.png?auto=format,compress&w=1248&fit=max)
If your tag is firing, open GA4 and go to Admin > DebugView. Click around your site in another tab. Within a few seconds, you should see your own clicks, page_views, and scrolls appear in real time. DebugView is the single most underused QA tool in GA4. Use it every time you add a new event.
![[Screenshot of GA4 DebugView showing real-time events streaming in]](https://www.datocms-assets.com/164164/1778179457-blobid4.png?auto=format,compress&w=1248&fit=max)
How to set up conversions and events in GA4
Out of the box, GA4 automatically tracks a useful set of events called enhanced measurement: page views, scrolls past 90% of a page, outbound clicks, site searches, video engagement, and file downloads. Turn it on under Admin > Data Streams > [your stream] > Enhanced measurement.
![[Screenshot of the Enhanced Measurement settings panel in GA4]](https://www.datocms-assets.com/164164/1778179459-blobid5.jpg?auto=format,compress&w=1248&fit=max)
Enhanced measurement covers most websites. The events that matter most to your business are usually custom ones like form submissions, demo requests, button clicks, signups, and purchases. You add these in two ways.
Through Google Tag Manager. Create a new tag of type Google Analytics: GA4 Event, name the event (for example, demo_request), choose a trigger (for example, a click on the demo button), and publish. The event will appear in GA4 within 24 hours.
Through the GA4 interface. Go to Admin > Events > Create event, name it, and define the conditions that should fire it. This works for simple cases that build on existing events.
Once an event exists in GA4 and has fired at least once, mark it as a conversion. Go to Admin > Conversions > New conversion event, type the exact event name, and save.
![[Screenshot of the Mark as conversion toggle in the Events section of GA4]](https://www.datocms-assets.com/164164/1778179465-blobid6.jpg?auto=format,compress&w=1248&fit=max)
A short reference for the most-used GA4 conversion events:
|
Business type |
Event name to track |
When it should fire |
|---|---|---|
|
SaaS |
sign_up |
After successful account creation |
|
SaaS |
demo_request |
On demo form submission |
|
Ecommerce |
purchase |
On the order confirmation page |
|
Ecommerce |
add_to_cart |
When a user adds an item to cart |
|
Lead generation |
generate_lead |
On any contact form submission |
|
Content site |
newsletter_signup |
After email subscription |
Set these up before you start analyzing data. Reports without conversions are interesting. Reports with conversions tell you what is making money.
How to use Google Analytics 4
GA4 has hundreds of reports. Four of them cover what most people need 90% of the time: Acquisition, Engagement, Conversions, and the Realtime overview. We will walk through the three that drive decisions.
Acquisition reports
Acquisition tells you how visitors found you.
GA4 splits this into User acquisition (how new users first found your site) and Traffic acquisition (where each session came from, including return visits). They will not match, and that is the point. Use User acquisition to evaluate channels that bring in new audiences. Use Traffic acquisition to understand what brings people back.
To open the User acquisition report:
-
In the left navigation, click Reports.
-
Expand Life cycle > Acquisition.
-
Click User acquisition.
![[Screenshot of the GA4 User acquisition report with the channel grouping in the first column]](https://www.datocms-assets.com/164164/1778179467-blobid7.png?auto=format,compress&w=1248&fit=max)
The default first column is First user default channel group. This bundles dozens of sources into clean buckets like Organic Search, Direct, Email, Paid Search, Organic Social, and Referral. Sort by New users to see which channels are pulling new audiences.
You can change the dimension by clicking the dropdown above the first column. Switching to First user source / medium breaks Organic Search apart into google / organic, bing / organic, duckduckgo / organic, and so on. This is the level of detail you need when you want to know whether your SEO work is paying off in Google specifically or across the board.
Engagement reports
Engagement tells you what people did on your site.
The most useful engagement report is Pages and screens. It shows you which URLs people landed on, how long they stayed, and how often they converted.
To open it:
-
Click Reports.
-
Expand Life cycle > Engagement.
-
Click Pages and screens.
![[Screenshot of the GA4 Pages and screens report sorted by views]](https://www.datocms-assets.com/164164/1778179471-blobid8.png?auto=format,compress&w=1248&fit=max)
Change the dimension at the top of the first column from Page title to Page path and screen class to see actual URLs instead of titles. Titles are useful for editorial review, but URLs are what you optimize.
The columns to watch are Views, Average engagement time, and Key events. A page with high views and low engagement time is either misnamed in search, weakly written, or attracting the wrong audience. A page with modest views and a high conversion rate is a hidden winner that probably deserves a content refresh and an internal-link campaign behind it.
To narrow down to organic traffic only, click Add filter at the top, set the dimension to First user default channel group, and pick Organic Search. You now have a list of every page bringing in organic visitors, ranked by traffic, with engagement and conversions side by side.
Conversions and Key events
In GA4, the word “conversions” is being slowly renamed to Key events across the interface. Same data, new label. Both refer to the events you marked as important earlier.
To open the report:
-
Click Reports.
-
Expand Life cycle > Engagement.
-
Click Conversions (or Key events depending on your account).
![[Screenshot of the GA4 Conversions report showing event names and conversion counts]](https://www.datocms-assets.com/164164/1778179473-blobid9.jpg?auto=format,compress&w=1248&fit=max)
Click any event name to drill into a per-event report that shows the source, medium, campaign, and revenue tied to that specific conversion. Add a secondary dimension by clicking the blue + next to the first column. Layer in City to see where your converters live, Device category to see whether mobile or desktop drives sales, or Landing page to see which entry pages produce the most conversions.
This is where most people stop in GA4. It is also where most people start losing data.
What GA4 misses (and how to actually track AI search traffic)
GA4 was built when “search traffic” meant Google. It does not have a native channel for ChatGPT, Perplexity, Claude, Gemini, or Copilot. When a visitor clicks a citation inside ChatGPT and lands on your site, GA4 sorts that session into one of two wrong buckets.
If the AI assistant passed a referrer header, GA4 lumps the session into Referral, hidden inside a long list of unrelated domains.
If the assistant stripped the referrer (which most do, most of the time), GA4 marks the session as Direct, the same bucket as bookmarks and untagged email links. You see a sudden spike in Direct, you cannot explain it, and you eventually shrug it off.
This is not theoretical. AI search visitors already convert at much higher rates than traditional organic visitors for some sites, as Ahrefs found when they discovered AI traffic converts at 23x their normal organic rate. If your GA4 buckets that traffic into Direct, you cannot attribute the revenue, you cannot identify the winning pages, and you cannot brief your team on what to write next.
There is a partial workaround inside GA4 itself. You can create a custom channel group that uses a regex to catch the known AI domains.
-
Go to Admin > Data display > Channel groups.
-
Click Create new channel group, then Add new channel.
-
Name it AI Search.
-
Set the rule to Source matches regex with this pattern: chatgpt\.com|perplexity\.ai|claude\.ai|copilot\.microsoft\.com|gemini\.google\.com|you\.com
-
Save and apply to all reports.
![[Screenshot of the GA4 custom channel group setup with the AI search regex]](https://www.datocms-assets.com/164164/1778179478-blobid10.jpg?auto=format,compress&w=1248&fit=max)
This catches sessions that arrive with a referrer. It does not catch the much larger share that arrive as Direct, and it does not tell you which prompts generated the citation, which AI engine it came from, or what your competitors are getting cited for in the same conversations.
That gap is exactly what Analyze AI’s AI Traffic Analytics was built to close. It sits alongside GA4 and pulls in the data that GA4 cannot see.
You see visitor counts broken out by AI source over time, so the spike in your “Direct” bucket finally has a name.
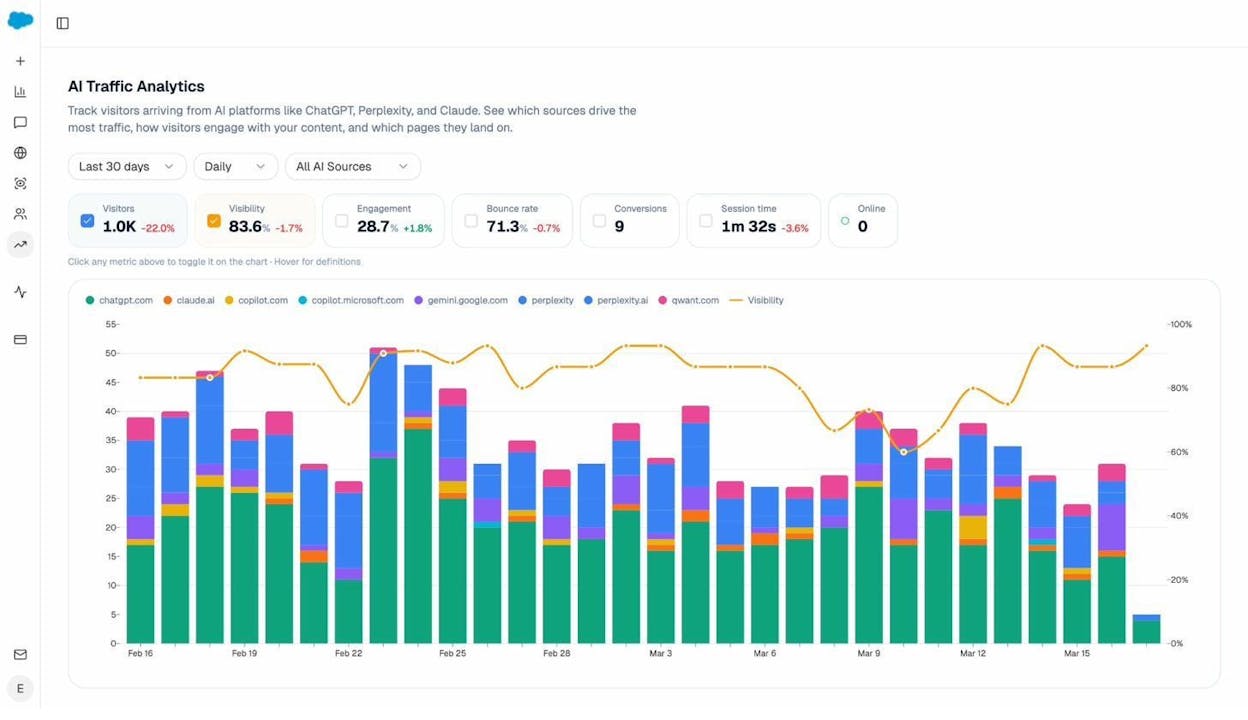
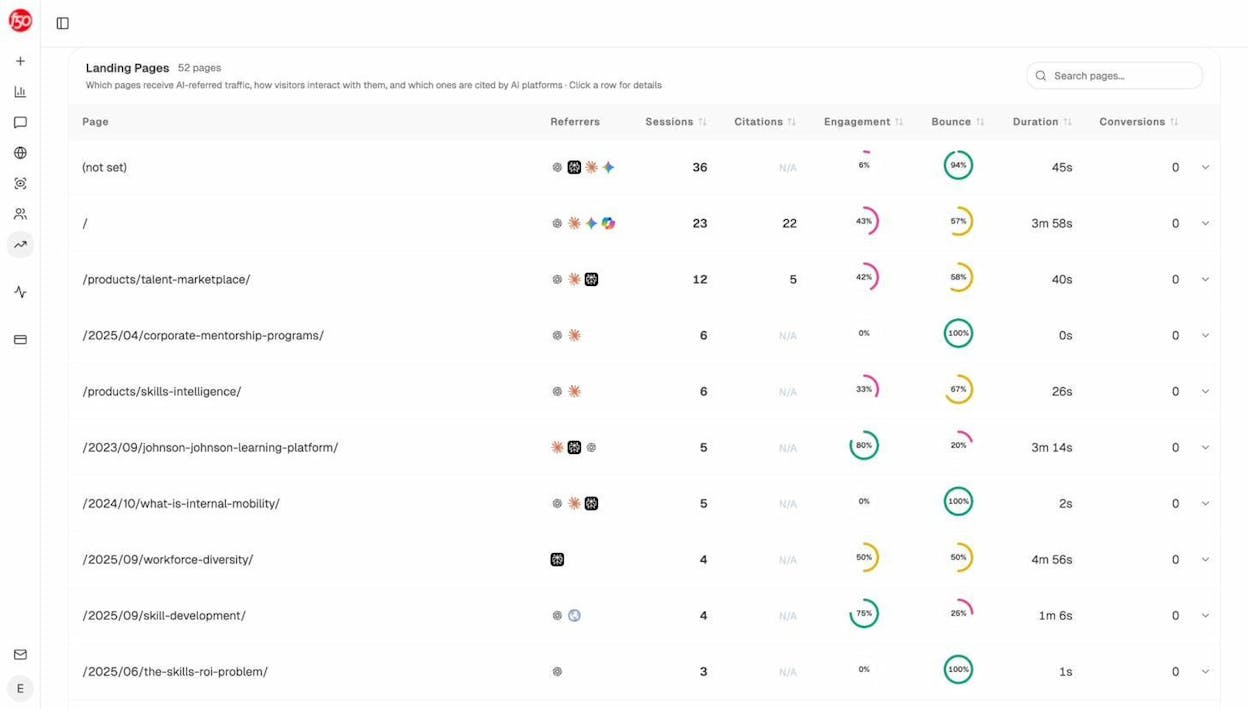
You see the landing pages that AI traffic actually hits, with sessions, citations, engagement, bounce, duration, and conversions in one view.
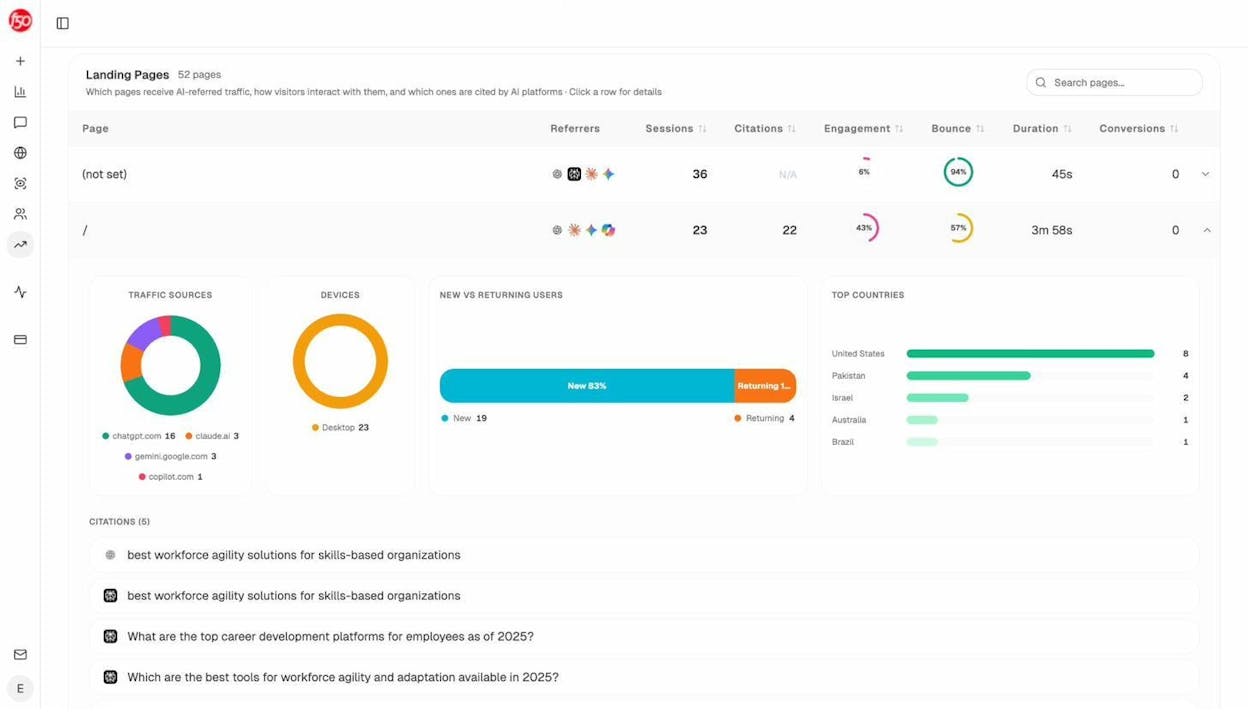
Click into any page and you see the citation chats that drove the visit, the traffic source breakdown, the device split, the new vs returning ratio, and the countries those visitors came from.
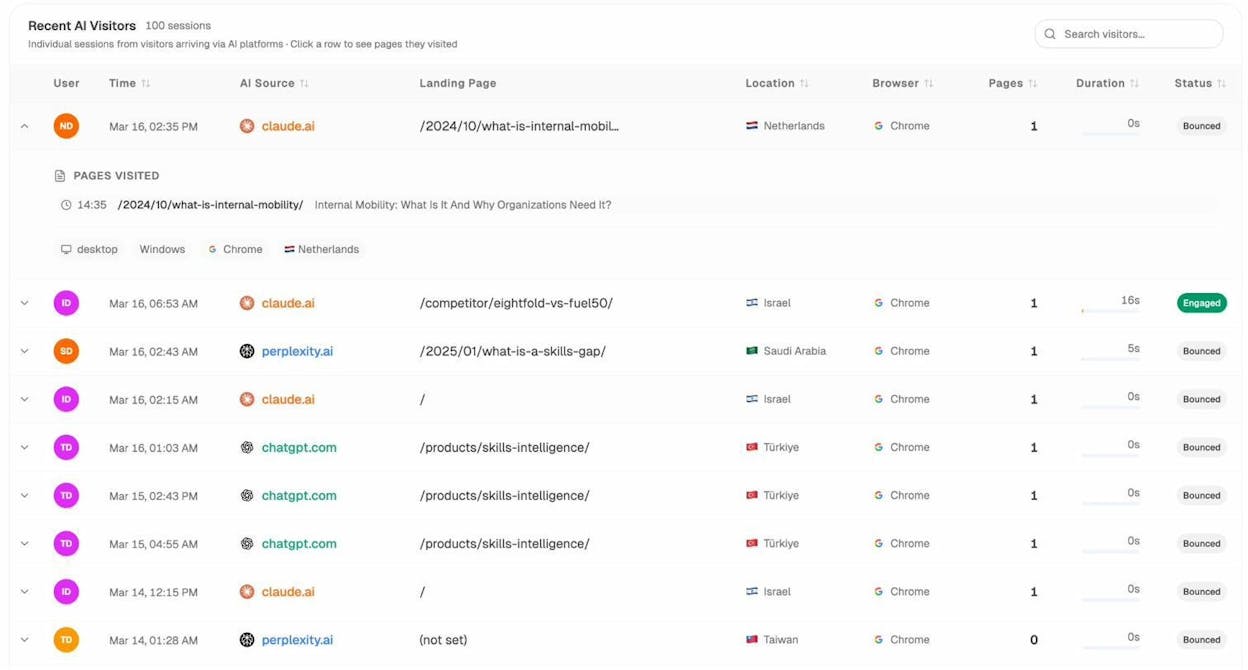
You also see individual sessions with timestamp, AI source, landing page, location, browser, page count, duration, and engagement status. This is the GA4 equivalent of an event-level export, but only for AI traffic.
Read this together with your standard GA4 acquisition reports and you stop having two parallel pictures of the same business. You have one.
How to use Google Analytics 4 to improve your website
Setup and reports are step one. Step two is using what you find to make the site better. Five things to do once data starts flowing.
1. Find the channels that bring in your best customers
The temptation is to optimize for the channel with the most traffic. The right move is to optimize for the channel with the highest conversion rate.
Open User acquisition, sort by Sessions in descending order, then look across the row at Engagement rate, Average engagement time, and Conversions. The channel that wins on volume is rarely the channel that wins on quality. Cut budget from the loud-but-empty channels and reinvest in the quiet-but-profitable ones.
2. Double down on pages that already convert
Open Pages and screens, filter by First user default channel group = Organic Search, and sort by Key events. The top of the list is your library of proven content. Three actions to take on each:
-
Refresh the post (update statistics, screenshots, examples) every 90 to 180 days.
-
Add internal links to it from at least three other relevant pages on your site.
-
Look at the queries it ranks for in Google Search Console and write supporting cluster posts that target the long-tail variants you do not own yet.
3. Cut or rewrite content that brings in nothing
Sort the same report in ascending order. Pages with zero conversions and very few sessions over the last 90 days are candidates for either a full rewrite or removal. Removing dead pages is not a vanity exercise. It concentrates crawl budget and topical authority on the work that earns its keep.
4. Use geography to fix targeting waste
Open the Demographic details report under User attributes. Sort by conversions, by city, by region. If you sell into one country and you are getting 40% of your traffic from a country you cannot fulfill, your paid campaigns probably have weak geographic targeting and your SEO is attracting the wrong audience. Both are fixable in an afternoon. Pair this with our website traffic checker to spot-check competitor traffic patterns in the same regions before you commit budget.
5. Find the pages that AI search has decided are your strongest
GA4 will not tell you this. Inside Analyze AI’s Sources view, you see the content types and domains AI engines cite most in your industry, broken out by AI model.
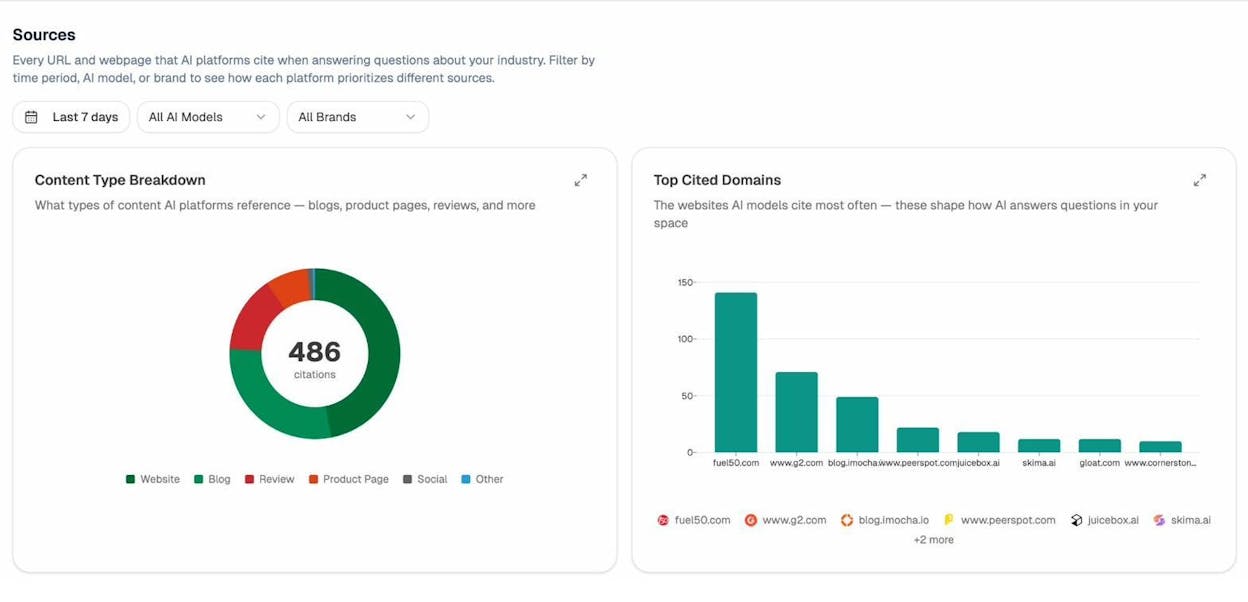
If your blog posts are heavily cited but your product pages are not, that is a signal to add structured information, comparison content, and clearer feature descriptions to your money pages. If a competitor’s review pages are getting cited and yours are not, the gap is not a mystery, it is a content brief.
The pattern to internalize: GA4 tells you what people did on your site. Analyze AI tells you what AI engines said about you to people who never landed on your site at all. Both are needed. Neither replaces the other. This is the same point we make on our 4 Pillars of an Effective SEO Strategy for AI Search and in our SEO Competitor Analysis breakdown.
Final thoughts
GA4 is not as complicated as the first hour with it makes it feel. Three steps to install. Four reports to read. One regex to start catching AI traffic. One companion tool to see the rest of it.
Set it up properly today, leave it to collect data for two to three weeks, then come back and walk through the five improvements above. That is the loop. Run it monthly and your website stops being something you guess about and starts being something you measure.
The real shift since the GA4 launch is that “organic traffic” is no longer one channel. It is two channels now, classic search engines and AI assistants. SEO is not dead. It is sharing the surface with another organic channel that GA4 alone cannot see. Track both. Optimize both. Win on both.
Ernest
Ibrahim


