


Summarize this blog post with:
The AARRR metrics framework, also called pirate metrics or the AARRR funnel, tracks the user behaviors that drive business growth. The acronym stands for acquisition, activation, retention, referral, and revenue.
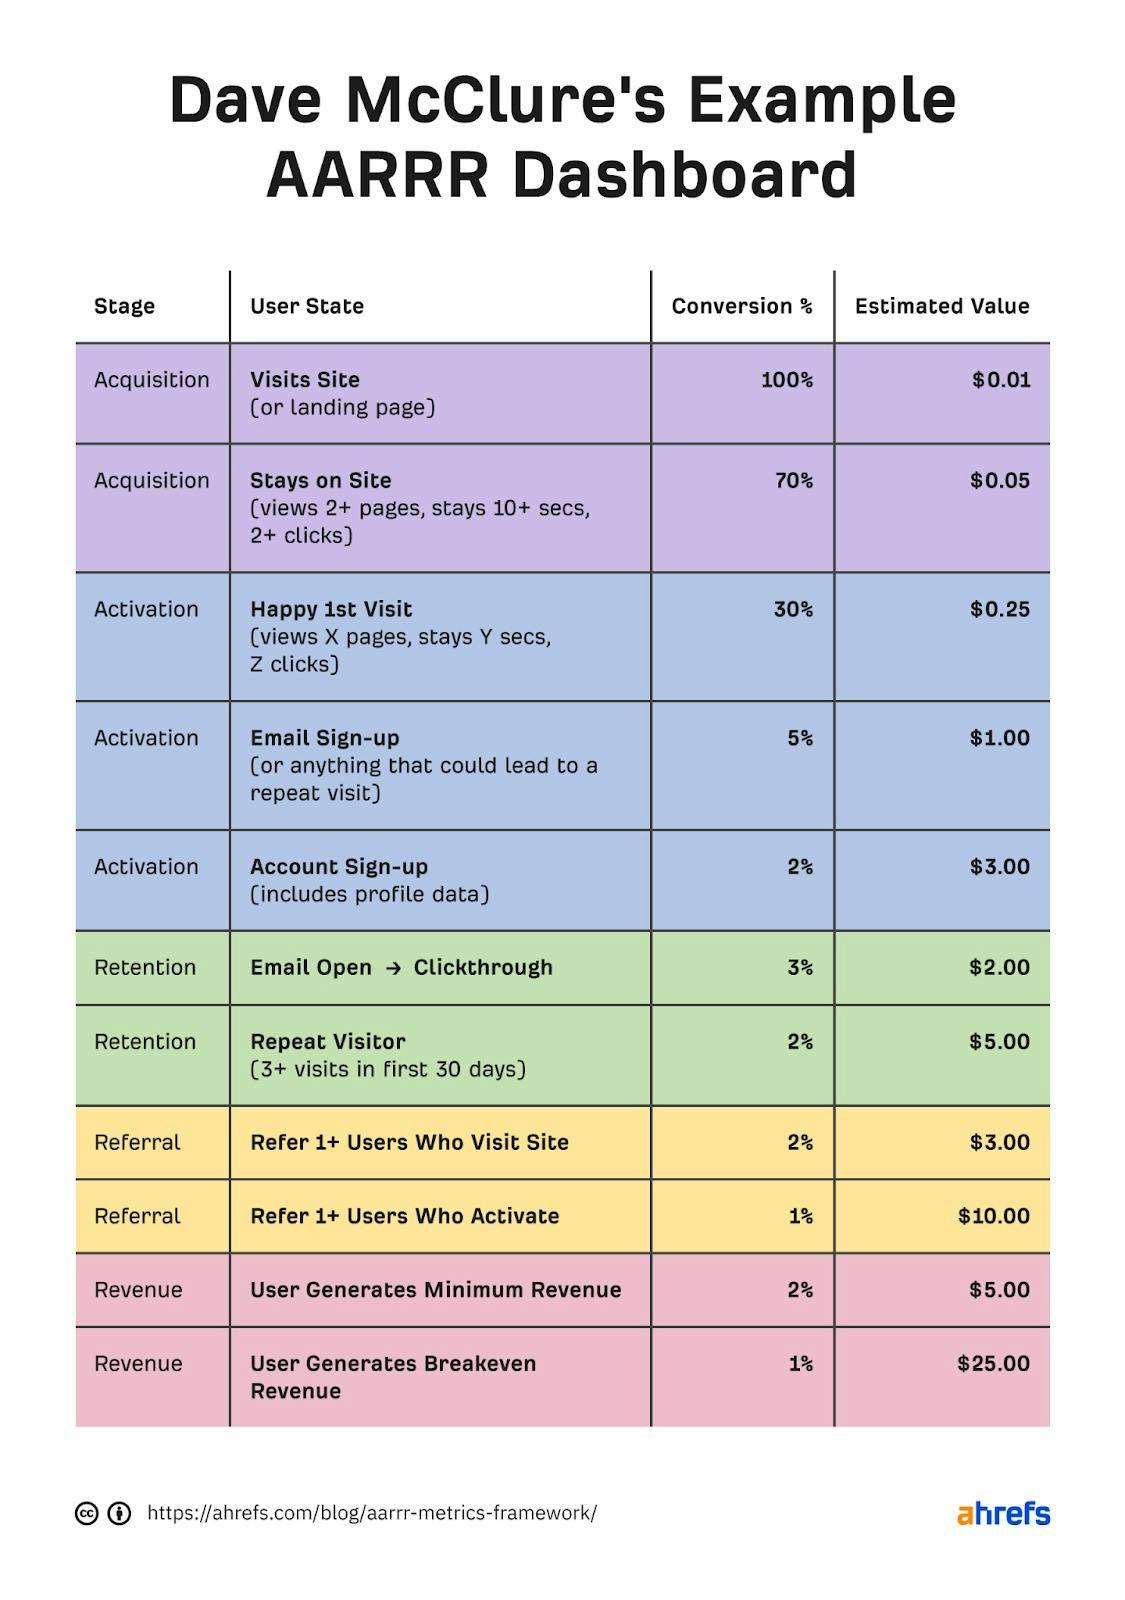
Investor Dave McClure (founder of 500 Startups) introduced the framework in 2007 in his original Startup Metrics for Pirates talk. His goal was to give startups a small, clear set of metrics to focus on instead of drowning in dashboards full of vanity numbers. Almost twenty years later, AARRR is still widely used in SaaS, even though the channels and tools around it have changed completely.
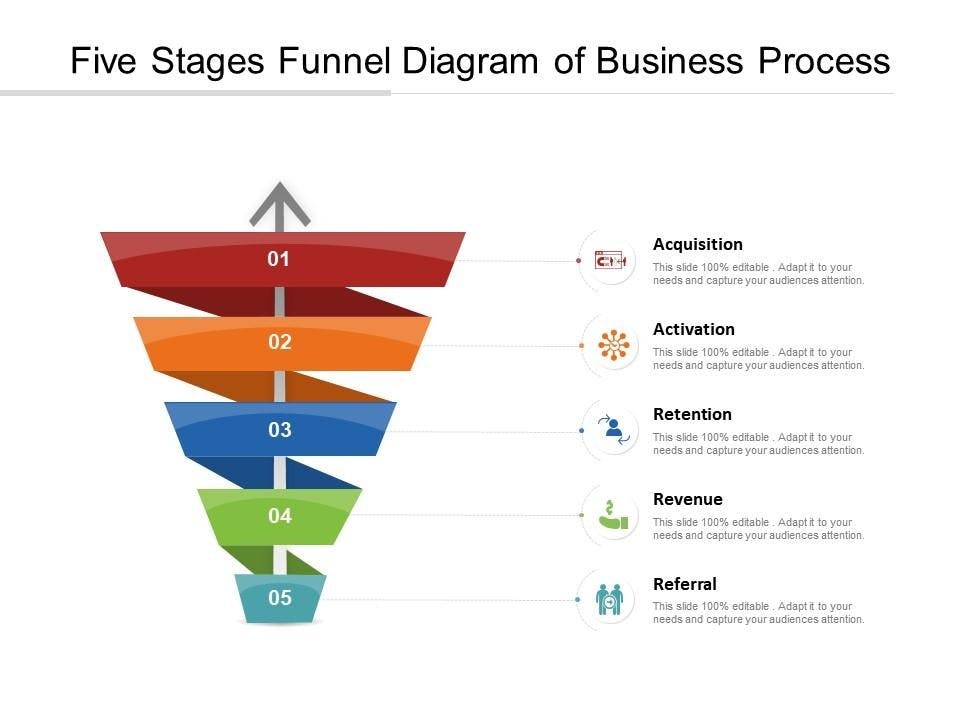
Table of Contents
Who is the AARRR framework for?
AARRR was built for startups, but any business with a multi-step buyer journey can use it. If your customers go through some version of “find you, try you, come back, recommend you, pay you,” AARRR maps cleanly to your funnel.
It works well for:
-
Founders who need a single page that explains where the business is leaking
-
Product managers who want to tie product decisions to growth outcomes
-
Marketing leaders building an attribution story for the C-suite
-
Investors evaluating whether a startup is actually growing or just looking busy
It does not work well for one-off transactional businesses with no repeat behavior, or for offline services with no measurable activation step.
The 5 stages of AARRR
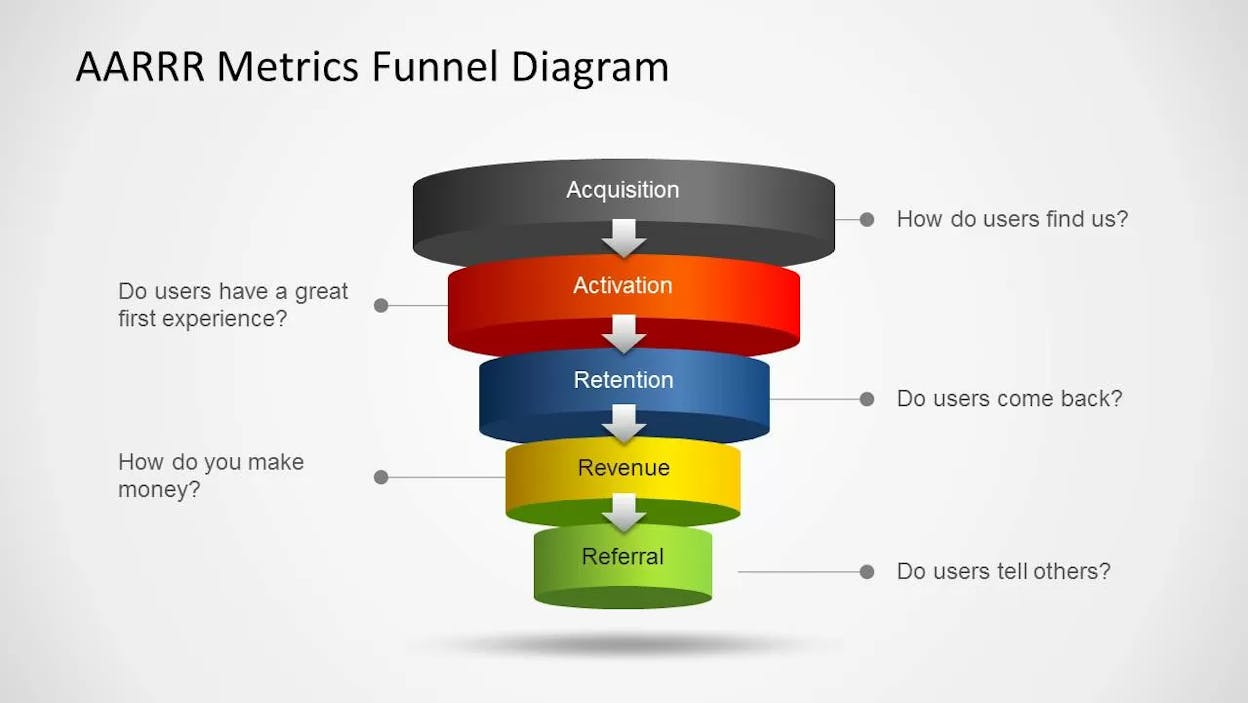
Each stage answers one question. Each one has a primary metric, a few supporting metrics, and a set of levers you can pull to improve it. We’ll walk through each stage in order.
1. Acquisition
Acquisition answers one question. How are people finding you? The primary metric to track is new visitors per channel, per period.
Acquisition is everything that brings a new person to your front door for the first time. Search traffic, paid ads, partnerships, podcast mentions, referral links, app store visits, and now AI search assistants all count. Without acquisition, the rest of the funnel has nothing to convert.
The mistake most teams make at this stage is counting all traffic equally. A visitor from a long-tail blog post who matches your ICP is worth more than a thousand visitors from a meme tweet. Track acquisition by channel and by intent, not by raw volume.
A practical channel split looks like this:
-
Organic search (Google, Bing)
-
AI search (ChatGPT, Perplexity, Gemini, Copilot, Claude)
-
Direct traffic
-
Referral traffic from review sites, partners, and PR
-
Paid traffic by campaign
-
Social
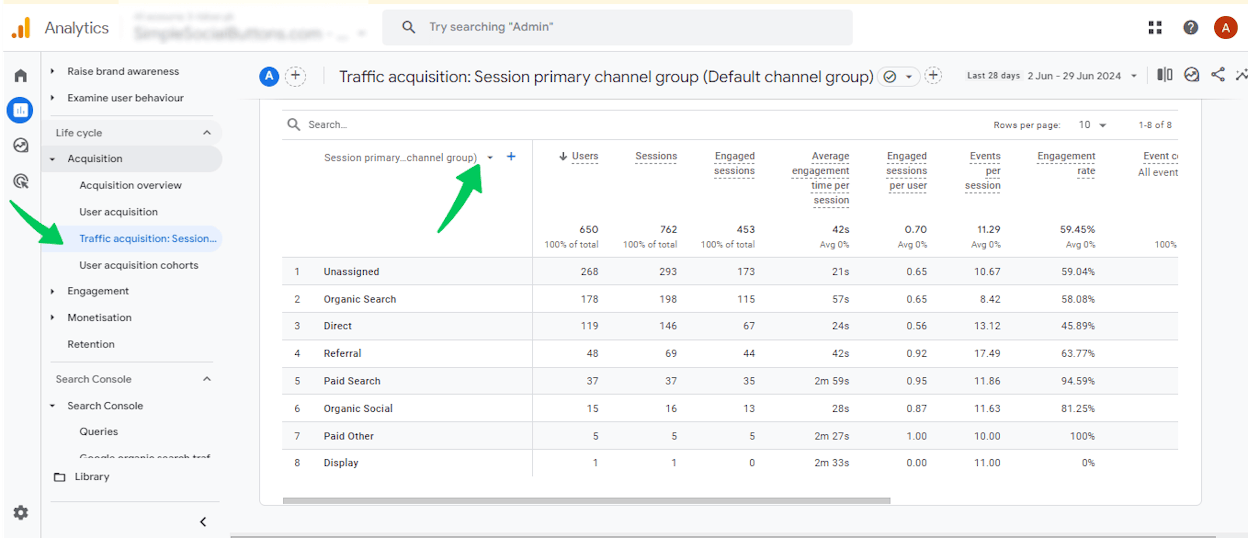
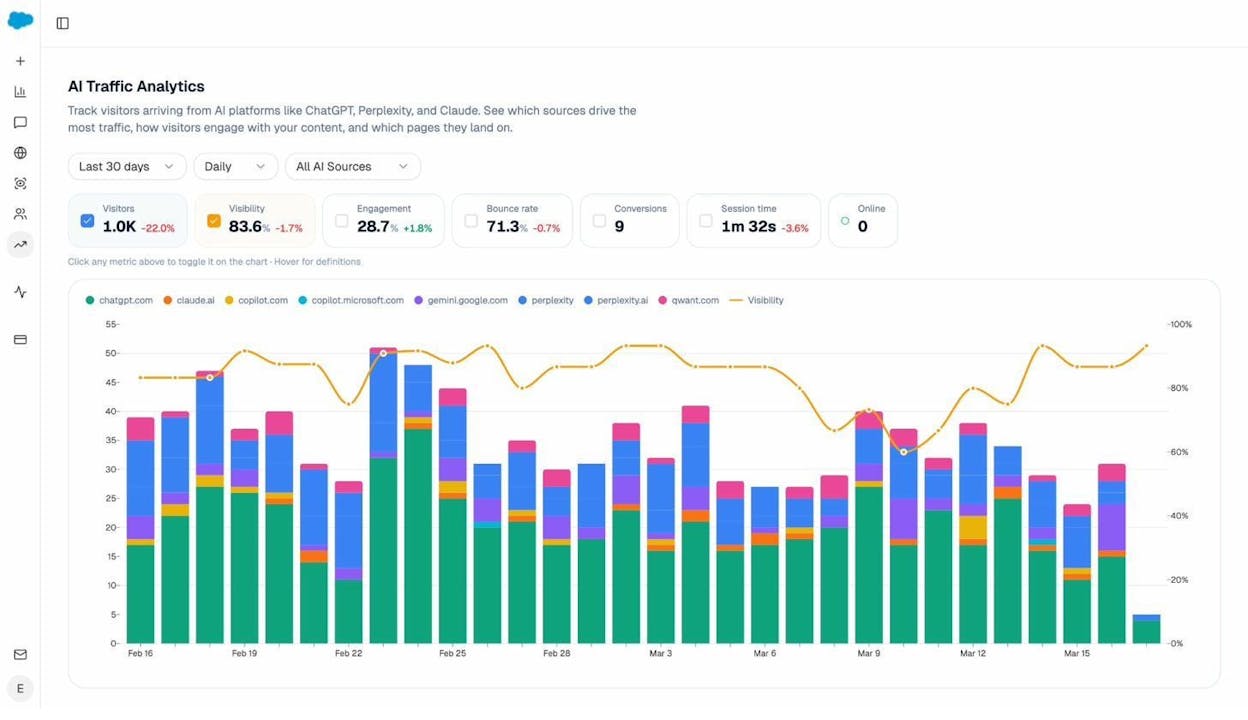
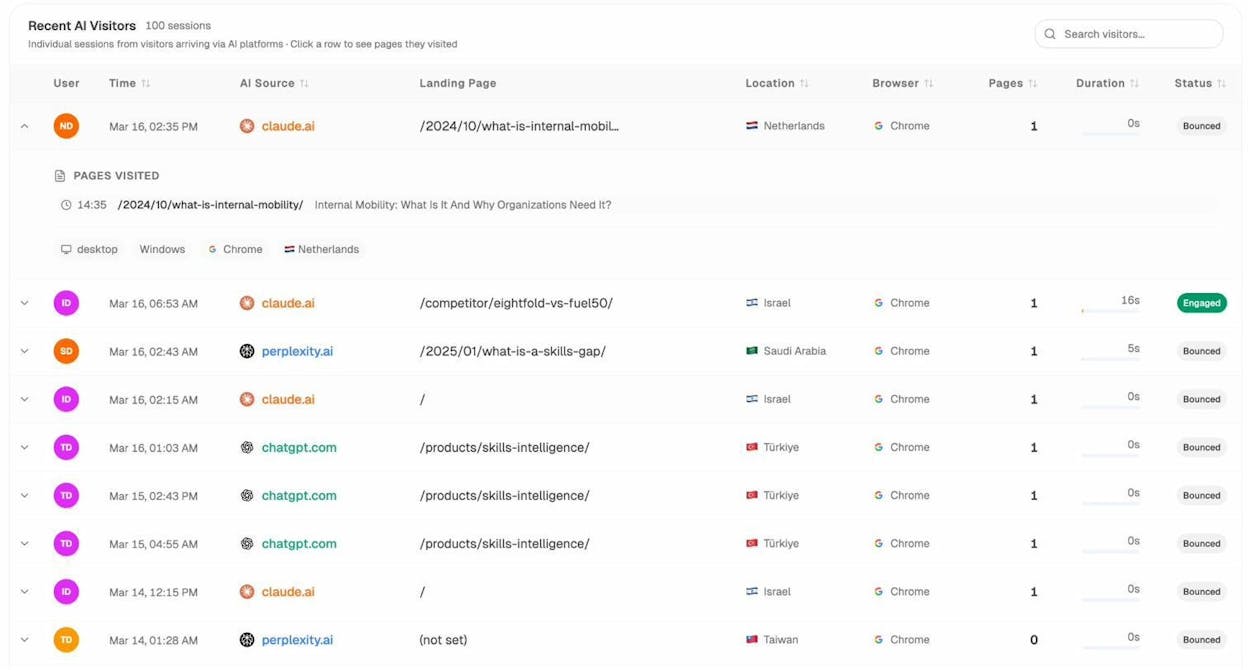
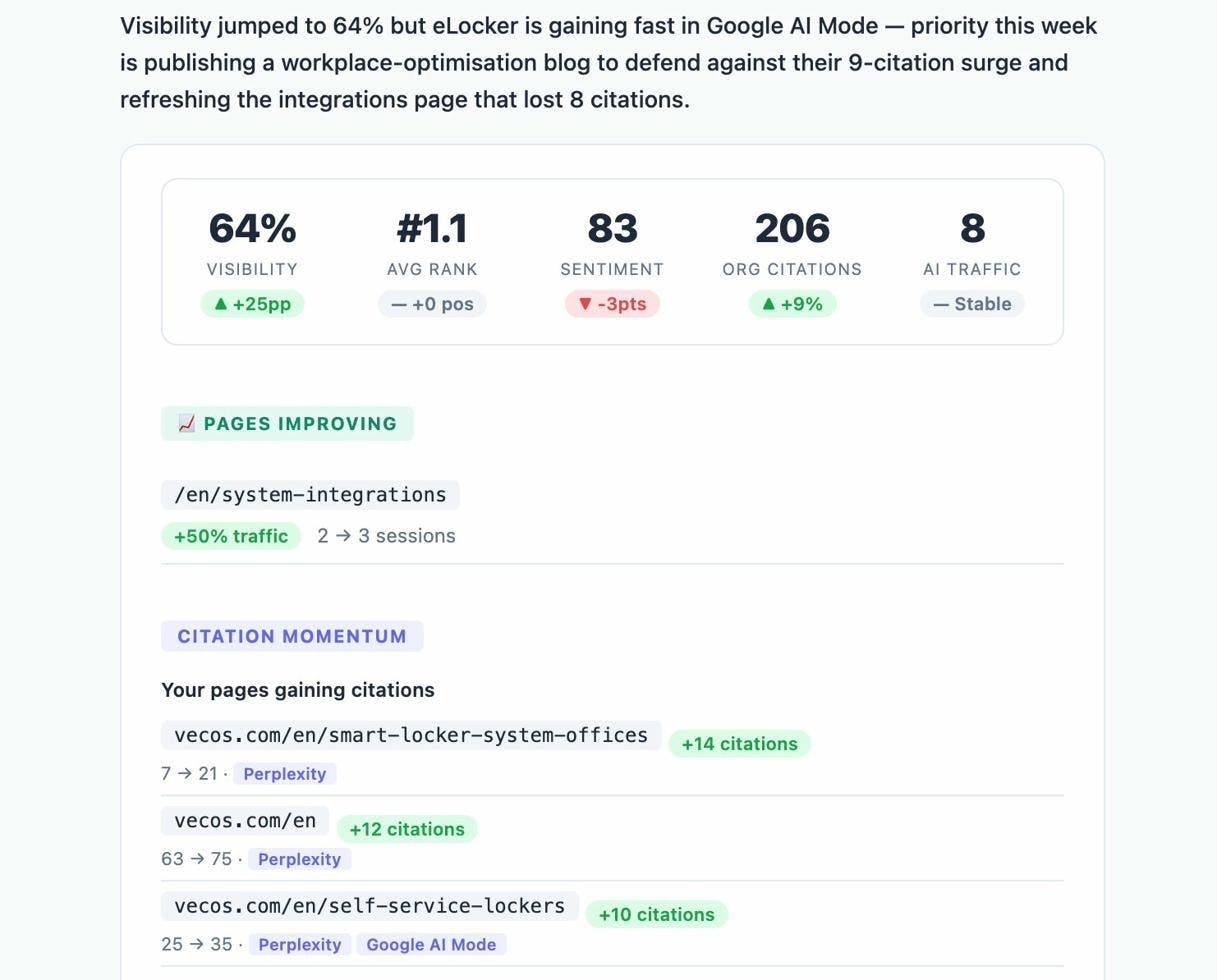
For traditional channels, GA4 and your ad platforms cover most of the work. For AI search, you need a separate tracking layer because most analytics tools either group AI referrers under “direct” or attribute them to the wrong source. The Analyze AI Traffic Analytics dashboard shows how many visits each AI engine sends, which pages they land on, and which ones convert.
To find more acquisition opportunities, you can do classic keyword research with the Analyze AI keyword generator or the keyword difficulty checker, then write content that ranks. This is still a reliable acquisition lever for most B2B companies, and it pairs well with a structured plan like our 10-step SEO content strategy.
For AI search, the equivalent of keyword research is finding the prompts your buyers ask AI assistants and making sure you appear in those answers. The Prompts feature in Analyze AI tracks the prompts that matter for your category, who shows up in the answer, and where you sit relative to competitors.
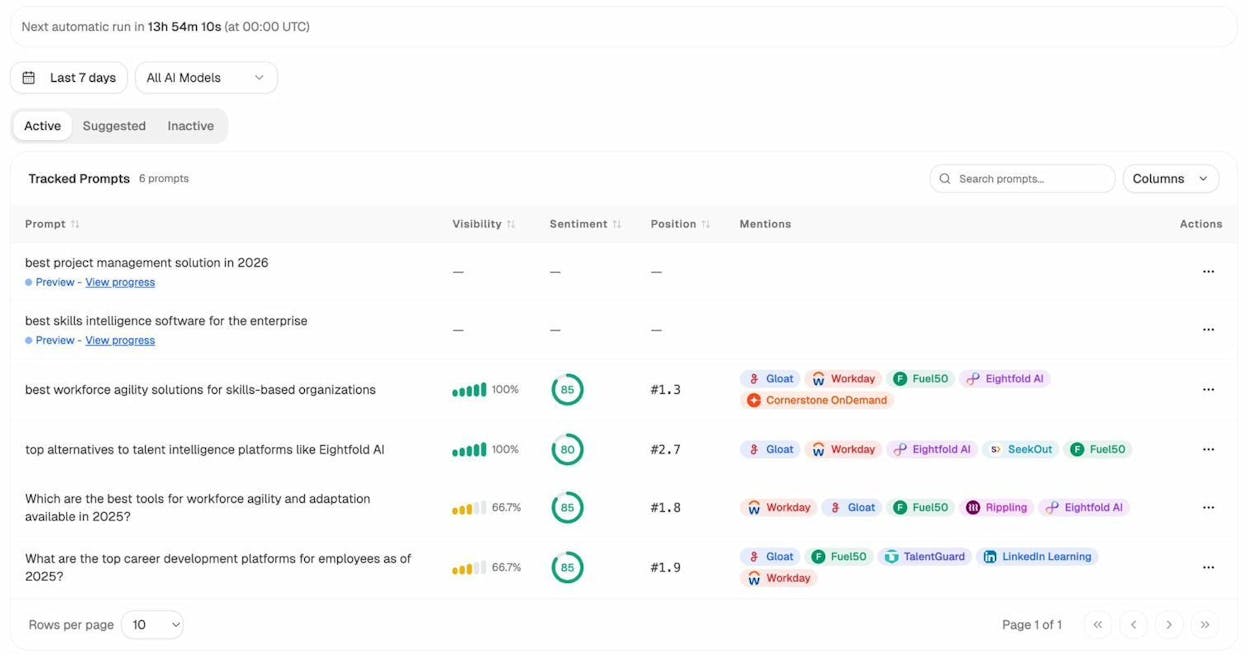
You can also find prompts you weren’t tracking by running ad-hoc searches across engines and seeing which content gets cited. Pages that already win in AI search become a template for what to write more of. For a deeper walkthrough, see our guide on how to get mentioned in AI search.
A clean acquisition dashboard answers two questions in one glance. Which channels are growing, and which channels are converting. Volume without conversion is a vanity number.
2. Activation
Activation answers one question. Are new visitors getting enough value to come back? The primary metric to track is activation rate, defined as the percentage of new visitors who complete your “aha moment” action within a defined window (usually 7 days).
Activation is the moment a visitor stops being a visitor and becomes someone who has experienced your product. For a SaaS tool, this might be importing data, inviting a teammate, or running a first report. For an ecommerce brand, it might be account creation or first add-to-cart. For media, it might be reading three articles in a session.
The trick is picking the right action. If you set the bar too low (newsletter signup), you’ll celebrate activations that never convert. If you set it too high (paid checkout), you’ve collapsed activation and revenue into the same metric and lost the diagnostic value of the funnel.
A good activation event has three properties.
-
It correlates strongly with future retention in your data
-
It happens within the first session or first few days
-
It requires the user to experience the actual product, not just look at it
To find your activation event, pull a cohort of paying customers and look at what they did within their first week that non-payers didn’t. Common patterns are project created, file uploaded, integration connected, and first invite sent.
Once you have an activation rate, you improve it by reducing friction.
-
Cut required signup fields to the minimum
-
Add inline product education at the moment of confusion
-
Use empty-state design that pre-fills sample data
-
Send a single, well-timed activation email instead of a 7-day drip
For AI-driven traffic, activation deserves its own breakdown. Visitors arriving from AI assistants are usually further along in their decision because they’ve already received a synthesized answer that included you. They tend to convert at higher rates per session but in lower volume. Splitting your activation rate by source (AI search vs. organic search vs. paid) tells you which channels are sending real intent and which are sending browsers.
If a specific AI-driven landing page activates above your average, you’ve found a pattern worth replicating. If a high-traffic page from AI search activates poorly, the prompt being asked probably doesn’t match your offer, and that’s a positioning problem, not a copy problem.
3. Retention
Retention answers one question. Do activated users come back? The primary metric to track is Day-N retention, where N is the natural usage cadence of your product (D1 for consumer apps, D7 for collaboration tools, D30 for monthly workflows).
Retention is the stage that predicts long-term outcomes. If you have it, growth compounds. If you don’t, you’re filling a leaky bucket and your CAC will eventually crush you. Most teams over-invest in acquisition and under-invest in retention, then wonder why payback periods keep stretching.
The simplest way to measure retention is a cohort table. Group every user who activated in the same week, then track how many of them came back in week 2, week 3, week 4, and so on. After about eight weeks, the retention curve usually flattens. The level it flattens at is your “retention floor,” and it’s the closest thing to a true product-market fit signal you can get from data alone.
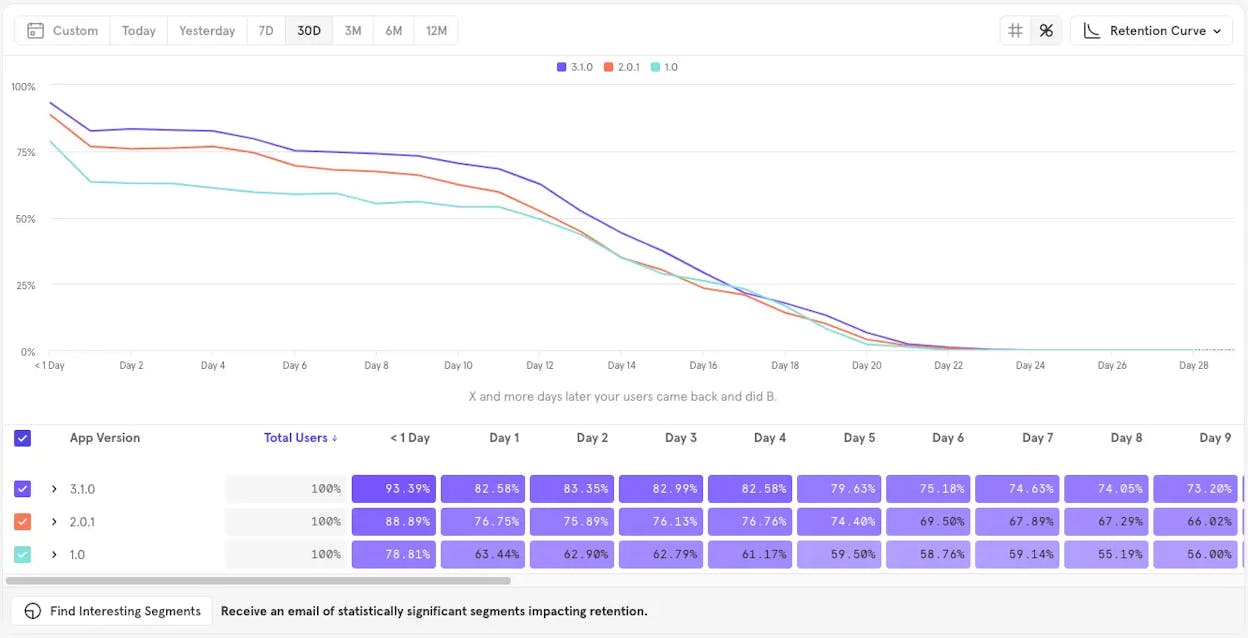
You can build this in Mixpanel, Amplitude, PostHog, or with a SQL query against your event table. For analytics tooling alternatives, see our roundup of Google Analytics alternatives for SMBs.
Levers that improve retention:
-
Better onboarding for the first session. Most retention loss happens before the user finishes their first task.
-
A weekly habit loop. Email digests, Slack notifications, or scheduled reports that bring users back without asking them to remember.
-
In-product education for unused features. People churn from products they don’t fully understand.
-
Use-case-specific templates. Generic empty states are retention killers.
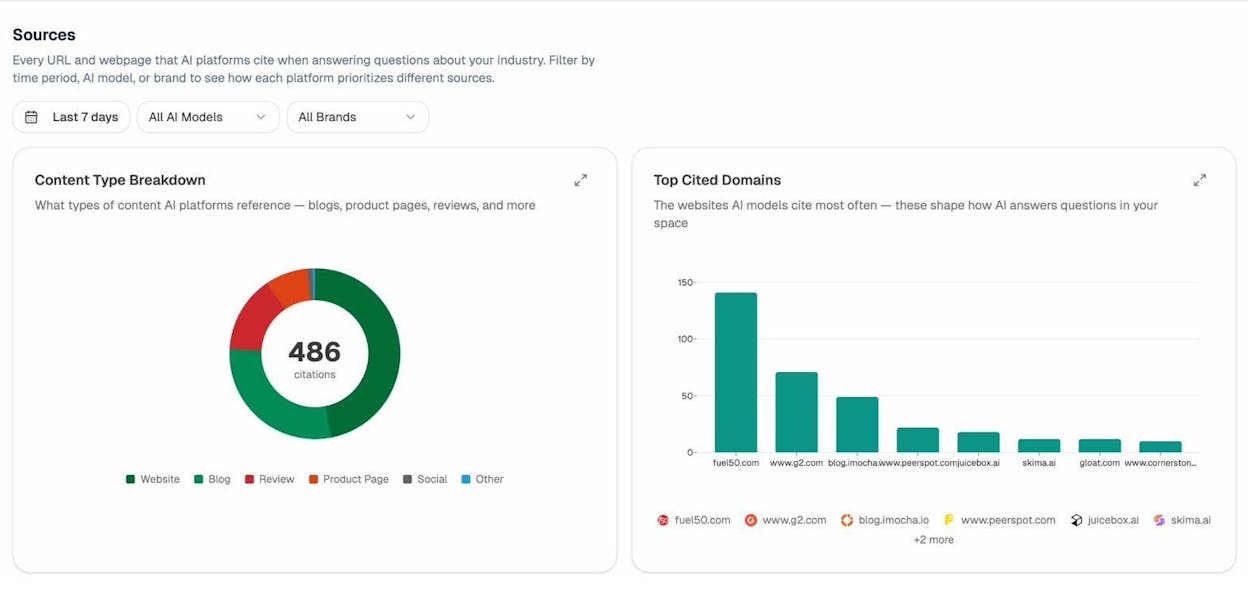
For AI search, retention works differently because the “user” is partially the AI assistant itself. If ChatGPT cited you once and stopped citing you, you’ve lost retention with the model, not just with end users. The Sources view in Analyze AI tracks which of your URLs keep getting picked up over time and which ones drop off. Pages that lose citations usually have a freshness or accuracy issue you can fix.
Treat your AI citation rate the same way you’d treat user retention. As a leading indicator of trust.
4. Referral
Referral answers one question. Are users telling others about us? The primary metric to track is the viral coefficient (k-factor) for product-led referrals, or share of branded mentions for word-of-mouth-led referrals.
Referrals are a low-cost acquisition channel and a clear signal of quality. If users recommend you without being asked, you have something worth paying for. If they don’t, no amount of paid spend will fix the underlying problem.
Traditional referral measurement looks at three things.
-
Branded search volume over time. People searching your brand name directly is a clean word-of-mouth signal.
-
Mentions on social, communities, and review sites. Tools covered in our brand tracking software roundup handle this.
-
Net Promoter Score, or a single “would you recommend us” survey question.
This is also where AI search reshapes the stage entirely. When a buyer asks ChatGPT “what’s the best CRM for a 50-person sales team,” the AI gives them a recommendation. That recommendation is a referral, made at scale, by a system that millions of people consult daily. AI assistants now operate as a referral engine that runs 24/7 across every category.
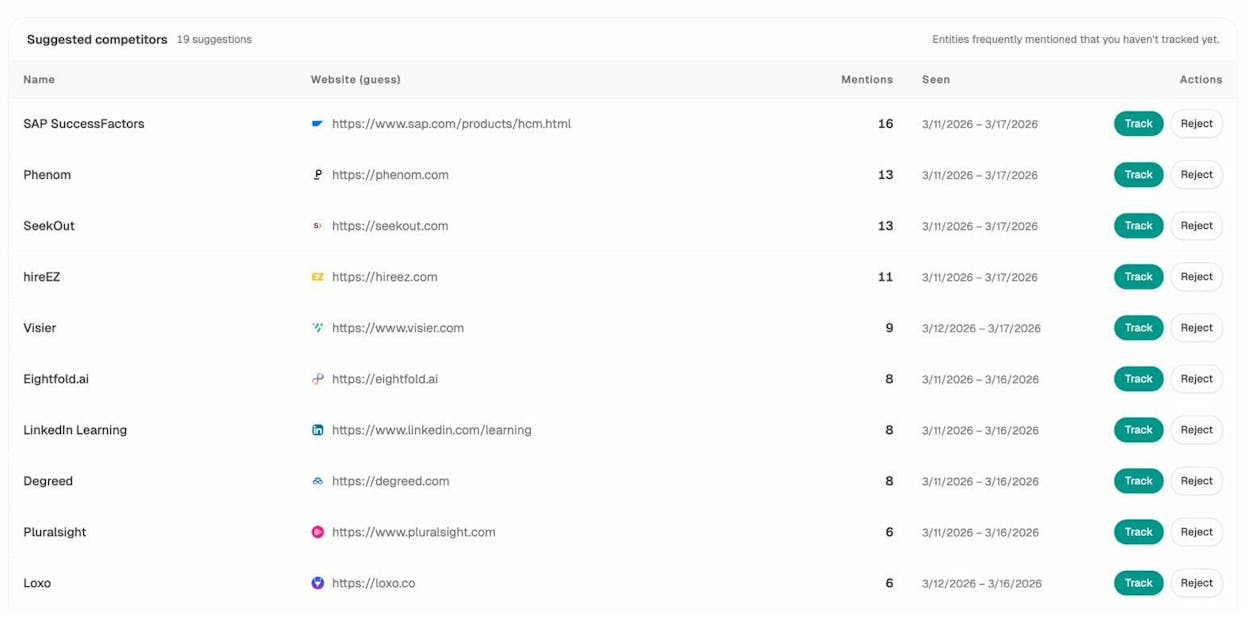
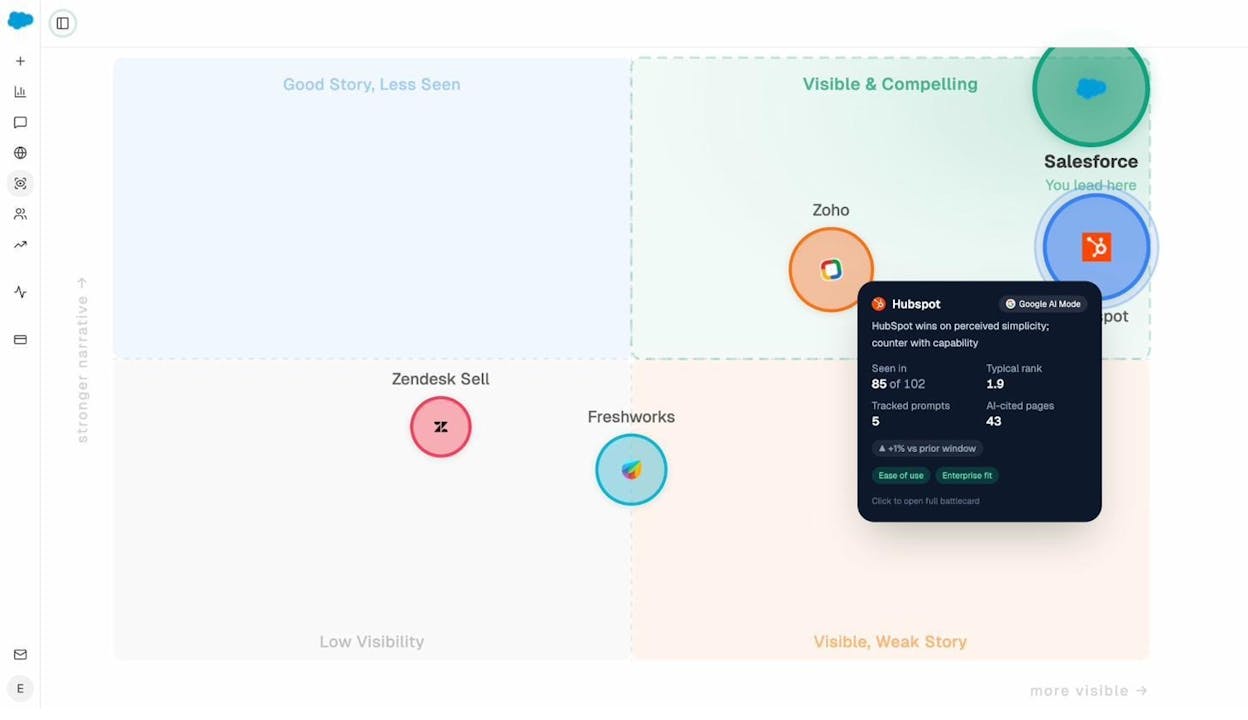
This means your AI mention rate is a referral metric, not just a visibility metric. The Competitors view in Analyze AI shows how often you’re recommended versus your competitors across every major engine.
To track sentiment specifically (because being mentioned negatively is a referral too, just a bad one), use the AI Sentiment Monitoring view to see how each engine frames your brand in its answers.
A practical referral dashboard for 2026 includes:
|
Metric |
What it tells you |
Where to track it |
|---|---|---|
|
Branded search volume |
Word-of-mouth on Google |
GA4, Search Console |
|
AI mention share |
AI-driven recommendations |
|
|
Review site rating trend |
Public peer endorsement |
G2, Capterra, Trustpilot |
|
Sentiment score by engine |
How AI frames your brand |
Analyze AI Sentiment Monitoring |
|
NPS |
Direct intent to recommend |
In-product survey |
If three of these five are trending up, you have a real referral engine. If only one is, you have a marketing campaign that’s pretending to be one.
5. Revenue
Revenue answers one question. Are users paying us, and is each cohort more valuable than the last? The primary metric to track is customer lifetime value (LTV), segmented by acquisition cohort.
Revenue is the outcome of every previous stage done well. You can’t fix revenue directly. You fix the inputs.
The metrics most teams use here:
-
Average revenue per user (ARPU)
-
Monthly or annual recurring revenue (MRR, ARR)
-
Customer lifetime value (LTV)
-
Gross margin per customer
-
CAC payback period
A useful exercise at this stage is segmenting LTV by acquisition channel. You’ll often find that one channel produces customers worth two to five times more than another. That’s the channel you scale.
For AI search, this is one of the few channels where you can now show direct pipeline contribution. Connect your GA4 to Analyze AI and you can see which AI-driven sessions converted, which pages they landed on, and what pipeline value they produced.
For example, our customer Kylian AI saw a 5% conversion rate from AI search traffic, well above the typical 1-2% blog benchmark. The cleanest way to know whether AI search is a real revenue channel for you is to measure it directly instead of arguing about it.
If you want a CMO-friendly summary of where your pipeline is coming from week to week, the Weekly Email Digest feature delivers it without anyone needing to log in.
How to build an AARRR dashboard you’ll actually use
The mistake we see most often is teams building a dashboard with twenty metrics, looking at it for two weeks, and quietly abandoning it. A useful AARRR dashboard has one primary metric per stage and no more than two supporting metrics.
Here’s a starter structure:
|
Stage |
Primary metric |
Supporting metric |
|---|---|---|
|
Acquisition |
Weekly new visitors by channel |
Cost per visit (paid) and AI mention share |
|
Activation |
% of new users who hit the activation event in 7 days |
Time to activation |
|
Retention |
Week 4 cohort retention |
Weekly active users |
|
Referral |
AI mention share + branded search volume |
NPS |
|
Revenue |
LTV by cohort |
CAC payback period |
Review it weekly with your team. Pick the weakest stage and ship one experiment against it before the next review. That’s the entire game.
Common mistakes that break the framework
A few patterns hurt teams more than any tooling problem.
Mixing acquisition with activation. “We had 50,000 visitors last month” is meaningless if you don’t know how many activated. Always pair the two.
Treating retention as a marketing problem. Retention lives in the product, not in the marketing email. If your product doesn’t get better with use, no amount of lifecycle email will save you.
Counting the same user twice. A user who comes back is retention, not acquisition. Most analytics defaults conflate the two until you set them up properly.
Ignoring AI search referrals because they’re hard to track in GA4. AI assistants now influence buyer decisions before they ever land on your site. If your dashboard treats them as zero, you’re flying with one eye closed. To check whether you’re being mentioned, the AI Search Explorer lets you run an ad-hoc check across engines in seconds.
Building the dashboard once and never revisiting it. The right metrics change as the business grows. A pre-product-market-fit company should obsess over retention. A scaling company should obsess over CAC payback. Update the dashboard every quarter.
AARRR vs. RARRA: which one should you actually use?
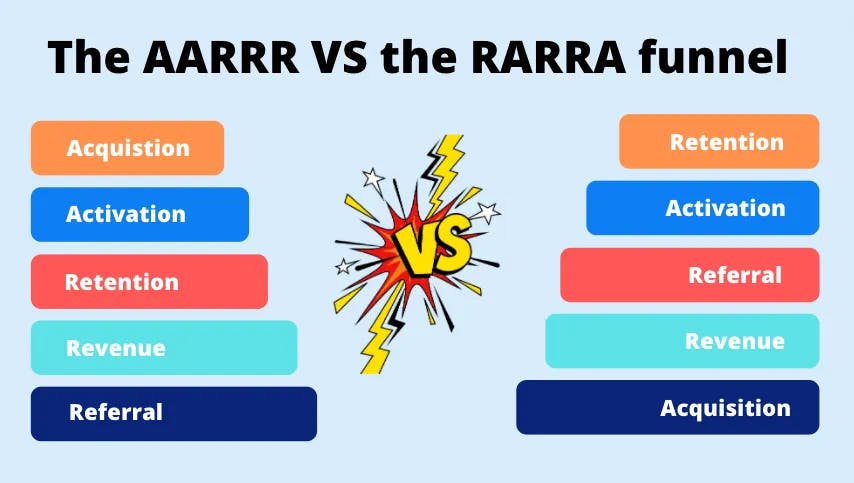
In 2017, Thomas Petit and Gabor Papp proposed RARRA as a “remix” of AARRR for mobile apps. The order changes to retention, activation, referral, revenue, acquisition. Their argument is that mobile startups historically over-invested in acquisition before they had a product anyone wanted to come back to.
The two frameworks aren’t really competitors. AARRR is a model of the buyer’s journey from first touch to revenue. RARRA is a prioritization heuristic that says “fix retention first, then everything else gets easier.”
Use AARRR to map your funnel. Use RARRA’s logic to decide where to invest first. Both are right.
If you’re pre-product-market-fit, prioritize retention. If you have product-market fit and you’re trying to scale, prioritize acquisition. The order of investment changes with stage. The model of the funnel doesn’t.
Final thoughts
AARRR is almost twenty years old, and it still works because the underlying truth hasn’t changed. People find you, try you, come back, recommend you, and pay you. Anything that doesn’t fit one of those five stages is probably noise.
What has changed is the channels. AI search is now a real acquisition channel, AI assistants are now a real referral channel, and tracking both requires tools that weren’t built when McClure first sketched the funnel. SEO is not dead. It has a new sibling, and the brands that treat AI search as a parallel organic channel (not a replacement) are the ones that compound over time.
If you want to see how AI search currently fits into your own AARRR funnel, you can get a free baseline of your AI visibility with Analyze AI and start measuring the channel that’s reshaping the top of the funnel.
Ernest
Ibrahim


