


Summarize this blog post with:
Every SEO has had this moment. You check a keyword’s search volume in one tool. Then you check it in another. The numbers don’t match. So you open Google Keyword Planner to get the “real” number. And that number doesn’t match either.
The natural reaction is frustration. You want to know exactly how many people search for a keyword each month so you can prioritize the right topics. But here’s the uncomfortable truth that most SEOs eventually learn the hard way.
There is no such thing as an accurate search volume. Not in Google Keyword Planner. Not in Google Search Console. Not in any third-party SEO tool. The metric itself is a rough estimate based on imperfect data and backward-looking averages.
That doesn’t make search volume useless. It just means you need to understand what it actually measures, where it breaks down, and how to use it correctly.
In this article, you’ll learn why no tool on the planet can give you a truly accurate search volume number, why the numbers in Google Keyword Planner and Google Search Console are just as flawed as third-party tools, and why chasing precision is the wrong goal entirely. You’ll also learn how to use search volume the right way for SEO decisions, and how to measure search demand in AI search where volume numbers don’t exist at all.
Table of Contents
What is search volume and where does the data come from?
Before we talk about why search volume is inaccurate, it helps to understand what the metric actually represents.
Search volume is an estimate of how many times a keyword is searched per month, usually shown as a monthly average over the past 12 months. Most SEO tools pull their search volume data from one of two places.
The first is Google Keyword Planner (GKP). Google provides search volume ranges to advertisers through its Keyword Planner tool, and most third-party SEO tools use this data as a foundation. They then apply their own clickstream data, machine learning models, and proprietary adjustments to refine the numbers.
The second is clickstream data. Some tools supplement GKP data with anonymized browsing data collected from browser extensions, apps, and ISP panels. This gives them an additional signal to estimate search volume, but clickstream panels are never fully representative of all searchers.
Both sources have significant limitations. And understanding those limitations is the key to using search volume correctly.
Search volumes in Google Keyword Planner aren’t accurate
If you’ve been doing keyword research for any amount of time, you probably know that Google Keyword Planner is not a neutral data source. It’s an advertising tool built for Google Ads customers, and the numbers it shows reflect that purpose.
Here are the specific problems.
GKP rounds numbers into “volume buckets”
Google doesn’t give you a precise count of monthly searches. Instead, it rounds the data into predefined ranges. A keyword with 870 real monthly searches and a keyword with 1,200 real monthly searches will both show up as “1,000” in Keyword Planner.
![[Screenshot: Google Keyword Planner showing rounded search volume ranges like 100-1K, 1K-10K for a set of keywords]](https://www.datocms-assets.com/164164/1777577313-blobid1.png?auto=format,compress&w=1248&fit=max)
This rounding means the number you see could be off by 50% or more from the actual search count. For low-volume keywords, the distortion is even worse. A keyword that gets 15 searches per month and one that gets 90 searches per month might both display as “10-100.”
GKP groups similar keywords together
This is one of the most misleading behaviors in Keyword Planner. Google often treats keywords with similar meanings as a single group and assigns them the same search volume.
For example, “keyword research” and “keyword research tool” might show the same volume in GKP, even though they represent very different search intents and get very different numbers of actual searches.
![[Screenshot: Two similar but distinct keywords in Google Keyword Planner showing identical search volume numbers]](https://www.datocms-assets.com/164164/1777577328-blobid2.png?auto=format,compress&w=1248&fit=max)
This grouping is designed to simplify things for advertisers who just need to know the rough demand for a topic. But for SEOs who need to distinguish between closely related keywords, it creates a false picture.
GKP shows annualized averages
The search volume you see in Keyword Planner is typically a 12-month rolling average. That means seasonal spikes and dips are smoothed out. A keyword like “best sunscreen” might show 10,000 monthly searches, but the actual month-by-month numbers might range from 3,000 in December to 25,000 in June.
This is a problem if you’re making content decisions based on current demand. The average tells you what happened over the past year. It doesn’t tell you what’s happening right now or what will happen next month.
GKP limits data for low-spending accounts
If you don’t have an active Google Ads campaign with meaningful spend, Google Keyword Planner will only show you broad ranges (like “1K-10K”) instead of more specific estimates. This means the same tool shows different data to different users based on how much money they spend on ads.
The bottom line is that Google Keyword Planner was never designed to give SEOs precise search data. It was designed to help advertisers decide how much to bid on keywords. Treating it as a source of truth for organic search planning is a mistake.
Search volumes in Google Search Console aren’t accurate either
When SEOs realize that Keyword Planner numbers are rough estimates, they often turn to Google Search Console (GSC) as a more reliable alternative. After all, GSC shows you the actual number of impressions your pages receive for specific queries. That should be closer to real search volume, right?
Not quite. GSC has its own set of accuracy problems.
Rank tracking bots inflate your impressions
This is a problem that few people talk about. Every rank tracking tool on the market (including the ones built into major SEO platforms) sends automated queries to Google to ![[Screenshot: Google Keyword Planner showing broad ranges for a non-spending account vs. more specific estimates for an active advertiser]](https://www.datocms-assets.com/164164/1777577340-blobid3.png?auto=format,compress&w=1248&fit=max) check where pages rank for specific keywords. Each of those automated queries counts as an impression in your Search Console data.
check where pages rank for specific keywords. Each of those automated queries counts as an impression in your Search Console data.
Think about how many different SEO tools, agencies, and in-house teams might be tracking the same popular keywords. All of those bot queries show up as “impressions” in your GSC reports, inflating the numbers beyond what real human searchers actually generate.
![[Screenshot: Google Search Console performance report showing impressions for a keyword, with an annotation highlighting that bot traffic inflates these numbers]](https://www.datocms-assets.com/164164/1777577343-blobid4.png?auto=format,compress&w=1248&fit=max)
You only see full impression data if you rank in the top 10
GSC only reports impressions for queries where your page appeared in the search results. If your page ranks on page two or beyond, you won’t see impressions for that keyword at all. And if your page ranked in the top 10 for only part of the month, you’ll see a partial impression count.
To see the full monthly search volume through GSC, your page would need to rank in the top 10 for every single day of the month, across every geographic location. That almost never happens. Rankings fluctuate daily, and search results vary by location, device, and personalization.
GSC impression counts have their own discrepancies
Like any analytics tool, GSC has counting quirks. Compare the “Clicks” reported in Search Console with your actual server logs or Google Analytics data, and you’ll find they rarely match exactly. The same is true for impressions.
Google doesn’t publicly document exactly how it counts and deduplicates impressions. There are edge cases around infinite scroll, featured snippets, image results, and other SERP features where the counting methodology is unclear.
GSC only shows data for your own site
This is the most fundamental limitation. GSC only shows impression data for keywords where your site appears in search results. If you’re researching a new topic and your site has no existing rankings for related terms, GSC gives you zero data.
That makes it useful for analyzing keywords you already rank for, but useless for discovering new keyword opportunities. For finding new keywords, you still need to rely on keyword research tools and their estimated volumes.
Why third-party SEO tools can’t fully solve the accuracy problem
If GKP and GSC both have major limitations, can’t third-party tools do better? The answer is: somewhat, but not by as much as you’d hope.
Most SEO software platforms build their search volume estimates using a combination of GKP data, clickstream data, and machine learning models. Each layer adds some value, but also introduces new sources of error.
Clickstream data has sampling problems
Clickstream data comes from panels of users who have opted into sharing their browsing behavior (usually through browser extensions or apps). The problem is that these panels are never fully representative. They tend to skew toward certain demographics, geographies, and device types.
A panel heavy on desktop users in the US will produce different volume estimates than a panel heavy on mobile users in Europe. No single panel captures the full picture of global search behavior.
Different tools produce wildly different estimates
Try checking the search volume for any keyword across three or four different SEO tools. You will almost always get three or four different numbers. Sometimes the differences are small. Sometimes one tool shows 5,000 and another shows 15,000 for the exact same keyword.
This happens because each tool uses different data sources, different processing methods, and different models. None of them are “wrong” in an absolute sense. They’re all making educated guesses based on incomplete data.
Model updates change historical numbers retroactively
When SEO tools update their search volume models (which happens regularly), the volume for a keyword can change overnight. A keyword that showed 2,000 monthly searches yesterday might show 3,500 today, not because search behavior changed, but because the model’s estimate was recalibrated.
This makes it tricky to track search volume trends over time if you’re relying on a single tool’s numbers.
Search volume shows the past, not the future
Even if we set aside all the accuracy problems above, there’s a more fundamental issue with search volume as a planning metric. It’s backward-looking.
Search volume is calculated from historical data. It tells you how many people searched for a keyword over the past 12 months (approximately). But SEO content strategy is forward-looking. You’re choosing keywords today that you hope to rank for months from now.
Consider the timeline. You pick a keyword in January. You write and publish a page in February. Based on research from Ahrefs, it takes an average of 3-6 months for a new page to reach its peak ranking potential. So you might not see meaningful rankings until July or August.
By that time, the search volume could be very different from what you saw when you chose the keyword. Trending topics rise and fall. Seasonal keywords shift. New products launch and change what people search for.
Some tools now offer search volume trend data and forecasting features that project volume into future months. These are helpful directional signals, but they’re still estimates built on top of estimates. They’re not predictions of what will actually happen.
The practical lesson here is that search volume should never be the sole factor in your keyword decisions. It’s one input among many, including topic relevance, business value, competitive difficulty, and alignment with your content strategy.
Even if search volume WAS accurate, you still couldn’t predict your traffic
Let’s do a thought experiment. Imagine a tool existed that could tell you the exact number of human searches for any keyword in any given month. Down to the last query. Would that solve your problems?
No. And here are three reasons why.
You can’t predict your ranking position
Rankings are volatile. Your page might rank #3 today, #7 tomorrow, and #1 next week. SERP positions fluctuate based on algorithm updates, competitor activity, and dozens of other factors you can’t control.
Without knowing your exact position, you can’t calculate your expected traffic from a keyword, even if you knew the exact volume.
You can’t predict your click-through rate
Each SERP is unique. Some SERPs have featured snippets that steal clicks from organic results. Others have shopping carousels, video packs, People Also Ask boxes, or AI Overviews that push organic results below the fold.
The click-through rate for position #1 varies wildly depending on what the SERP looks like. For some keywords, position #1 gets 40% of clicks. For others, it gets less than 10% because a featured snippet or AI Overview answered the query directly.
Pages don’t rank for a single keyword
This might be the most important point. A well-written page doesn’t rank for just one keyword. It ranks for hundreds or even thousands of related terms.
Research has consistently shown that a page ranking in the top 10 for one keyword will also rank for roughly 1,000 other related keywords. The combined traffic from all those related keywords often dwarfs the traffic from the primary keyword you originally targeted.
So even if you could perfectly predict your traffic from one keyword, you’d still be missing the full picture. The real traffic potential of a page depends on the entire cluster of keywords it can rank for, not just the one you plugged into a tool.
What “directionally accurate” actually means (and why it’s enough)
If exact accuracy is impossible, what standard should you hold search volume data to?
The answer is directional accuracy. A search volume metric is useful when it helps you answer relative questions, not absolute ones.
You don’t need to know that “keyword research tools” gets exactly 4,800 searches per month. You need to know that it gets significantly more searches than “keyword research tools for enterprises” (which might show 200). That relative difference helps you prioritize.
Directionally accurate data lets you do three things well.
Compare keywords against each other. You can tell which keywords have more demand and which have less. That’s enough to build a prioritized list.
Identify trends over time. Even if the absolute numbers are off, you can see whether a keyword’s popularity is growing, stable, or declining. That’s enough to spot opportunities and avoid fading topics.
Estimate the general scale of demand. A keyword with 50,000 monthly searches and a keyword with 500 monthly searches represent fundamentally different content opportunities. You don’t need exact numbers to recognize that difference.
The keyword difficulty checker and keyword generator tool from Analyze AI are built on this same philosophy. The goal is not to give you a false sense of precision. The goal is to help you make better decisions faster.
How to use search volume the right way
Knowing that search volume is directionally accurate (not precisely accurate) should change how you use it. Here are the practical adjustments worth making.
Use volume ranges, not exact numbers
Stop fixating on whether a keyword gets 2,400 or 3,100 monthly searches. Think in ranges instead. Is this a low-volume keyword (under 500), a medium-volume keyword (500-5,000), or a high-volume keyword (5,000+)?
Those ranges are stable enough to be useful for planning, even across different tools that might show slightly different exact numbers.
Cross-reference multiple data sources
No single tool has the best data for every keyword. If you’re making a high-stakes content decision, check the volume in two or three different tools and use the range between them as your estimate. If all tools agree the keyword is in the 2,000-5,000 range, you can be fairly confident in that order of magnitude.
You can also use the SERP checker to see what’s actually ranking for a keyword. If the top results are all from authoritative, well-optimized sites, that’s a strong signal of demand regardless of what the volume number says.
Prioritize traffic potential over single-keyword volume
Instead of looking at the volume for one keyword, look at the entire topic cluster. How many related keywords exist? What’s the combined volume of all related terms?
A keyword with 500 monthly searches that’s part of a cluster with 50 related terms might represent more total traffic potential than a keyword with 5,000 searches that has no meaningful variations.
This is where keyword clustering becomes valuable. By grouping related keyword types together, you get a better picture of the real opportunity than any single volume number can provide.
Look at the SERP, not just the number
Sometimes the most useful thing you can do is ignore the volume number entirely and look at what’s actually happening in the search results.
![[Screenshot: A Google SERP for a keyword showing the types of results (articles, videos, tools, etc.) that rank]](https://www.datocms-assets.com/164164/1777577348-blobid5.png?auto=format,compress&w=1248&fit=max)
Are the top-ranking pages getting real traffic? (You can estimate this with tools that show traffic estimates per page.) Are they well-maintained and recently updated? Is there a featured snippet or AI Overview dominating the top of the page?
The SERP itself tells you more about the real opportunity than any search volume metric can.
Use GSC to validate after you rank
Once you’ve published content and started ranking, use Google Search Console to validate your keyword choices. GSC shows you the actual impressions and clicks your pages receive for specific queries.
![[Screenshot: Google Search Console showing impressions, clicks, CTR, and position for specific queries]](https://www.datocms-assets.com/164164/1777577355-blobid6.png?auto=format,compress&w=1248&fit=max)
This real-world performance data is far more useful than pre-publication volume estimates. Use it to identify which keywords are driving real traffic and which ones underperformed your expectations.
You can also use the keyword rank checker to monitor your positions over time and correlate ranking changes with traffic changes.
AI search has no “search volume” at all. Here’s what to track instead.
Everything we’ve discussed so far applies to traditional Google search. But there’s a growing channel that makes the entire concept of search volume even more complicated.
AI search engines like ChatGPT, Perplexity, Gemini, and Copilot don’t work the same way Google does. Users don’t type short keywords. They ask natural language questions, and they often ask follow-up questions in the same conversation. There are no “search results pages” in the traditional sense. There are generated answers with cited sources.
This means there is no search volume metric for AI search. Nobody can tell you how many times a specific prompt is asked across ChatGPT or Perplexity. That data doesn’t exist in any tool, and AI search engines don’t publish it.
But that doesn’t mean you should ignore AI search. AI search is a growing organic channel, and brands that treat it as an extension of their SEO strategy (rather than a replacement for it) are already seeing compounding traffic from it.
The question is: if there’s no search volume for AI prompts, what should you track instead?
Track whether AI engines mention your brand
The most fundamental metric in AI search is visibility. When someone asks ChatGPT or Perplexity a question related to your industry, does your brand show up in the answer?
In Analyze AI, you can track this across all major AI engines. The platform monitors specific prompts and shows you whether your brand is mentioned, what position it appears in, and how the sentiment of the mention reads.
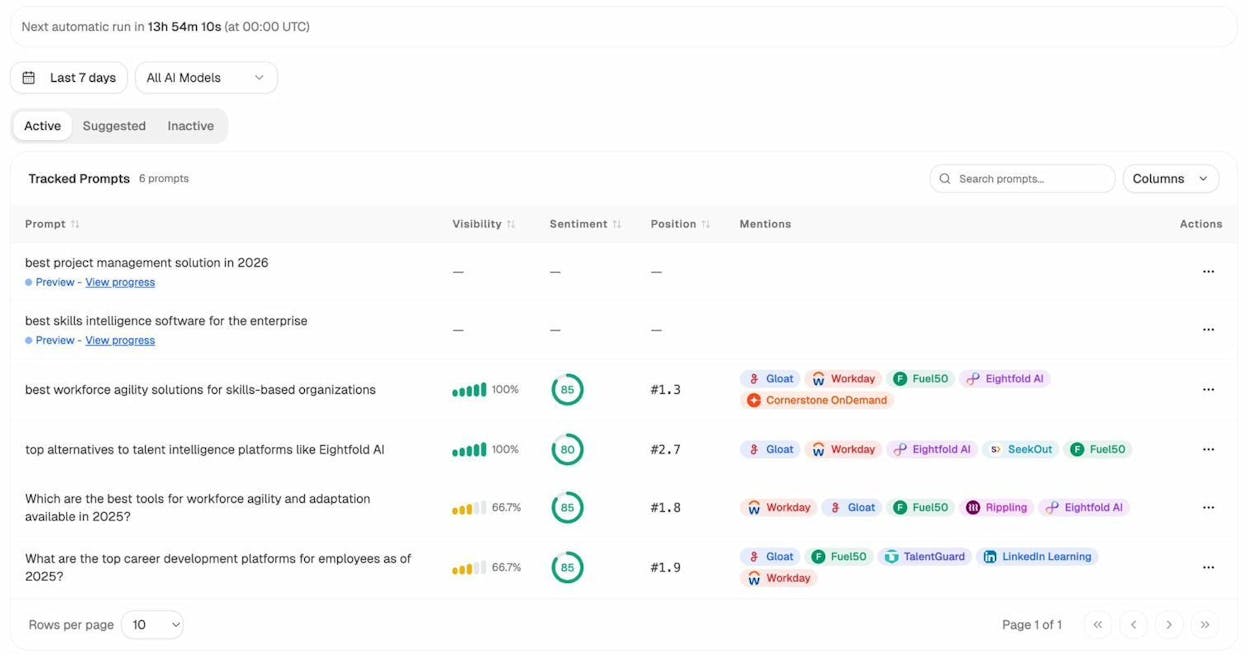
This is the AI search equivalent of rank tracking. Instead of checking your Google position for a keyword, you’re checking your visibility across AI answers for the prompts that matter to your business.
Track which competitors appear instead of you
In traditional SEO, you use tools to see who ranks above you for a keyword. In AI search, you need to see who gets recommended instead of you.
Analyze AI’s competitor intelligence feature shows you exactly which brands AI engines mention alongside yours, which ones appear where you don’t, and how often they get cited.
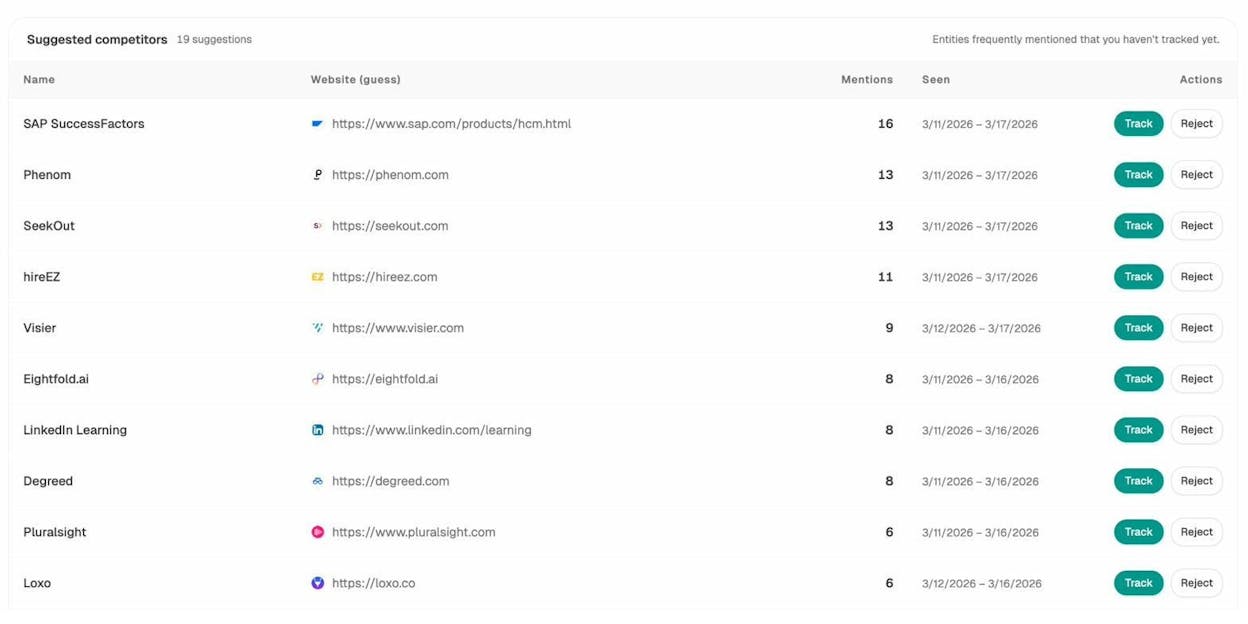
This is where the real opportunity lies. If a competitor appears in AI answers for prompts where your brand is absent, that’s a gap you can close by improving your content, building citations on trusted sources, and making your brand easier for AI models to reference.
Track your AI search traffic
Unlike traditional search volume (which is estimated from historical data), AI search traffic is something you can measure directly. When someone finds your site through an AI engine, that visit shows up in your analytics.
Analyze AI connects to your GA4 data and breaks down AI traffic by engine. You can see how many sessions come from ChatGPT, Perplexity, Gemini, Claude, and other AI sources, along with which landing pages receive that traffic and how visitors engage.
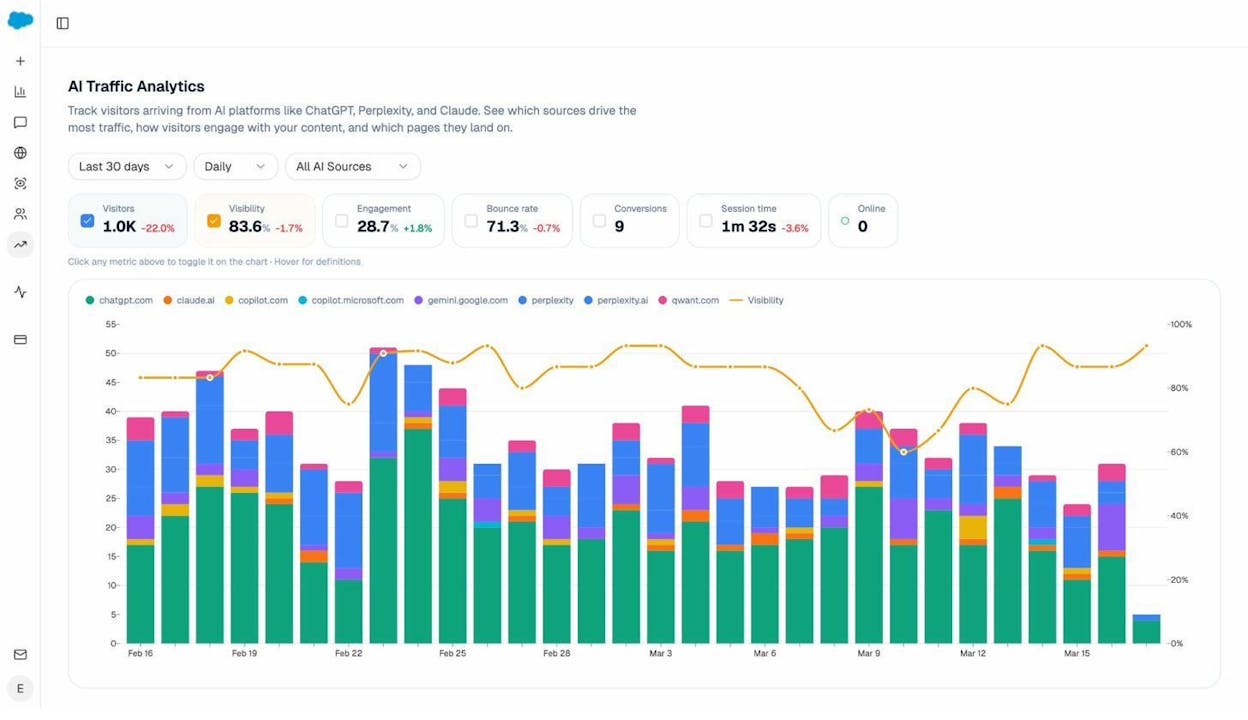
This is more concrete than search volume. Instead of estimating how many people might search for a keyword, you’re seeing how many people actually visited your site from AI search engines. And you can go deeper by looking at which specific pages attract AI referral traffic.
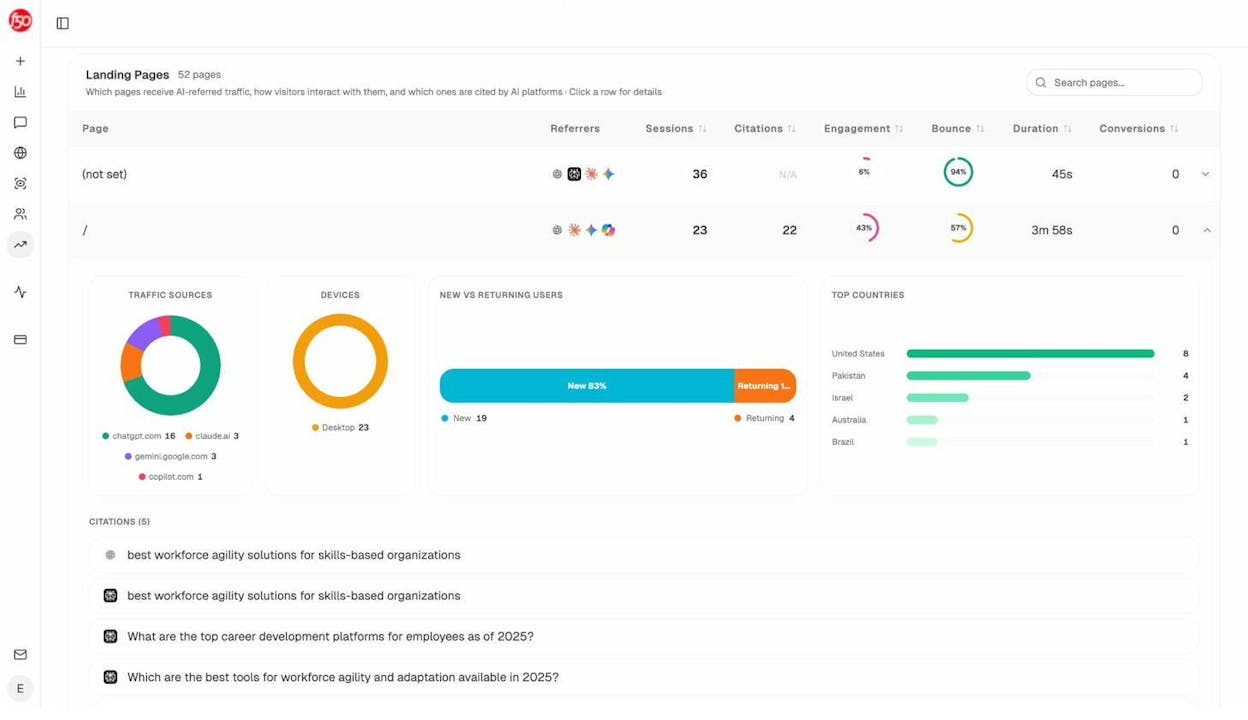
Those landing page patterns tell you what types of content work in AI search. You can then double down on what’s already converting and create more content in that format.
Track the sources AI engines cite
AI engines don’t just generate answers from thin air. They cite sources. And the domains and URLs they cite shape which brands get mentioned and recommended.
The citation analytics feature in Analyze AI shows you every URL and domain that AI engines cite in your industry. You can see the content type breakdown (blogs, product pages, reviews, social), the most-cited domains, and where your own domain stands in the citation landscape.
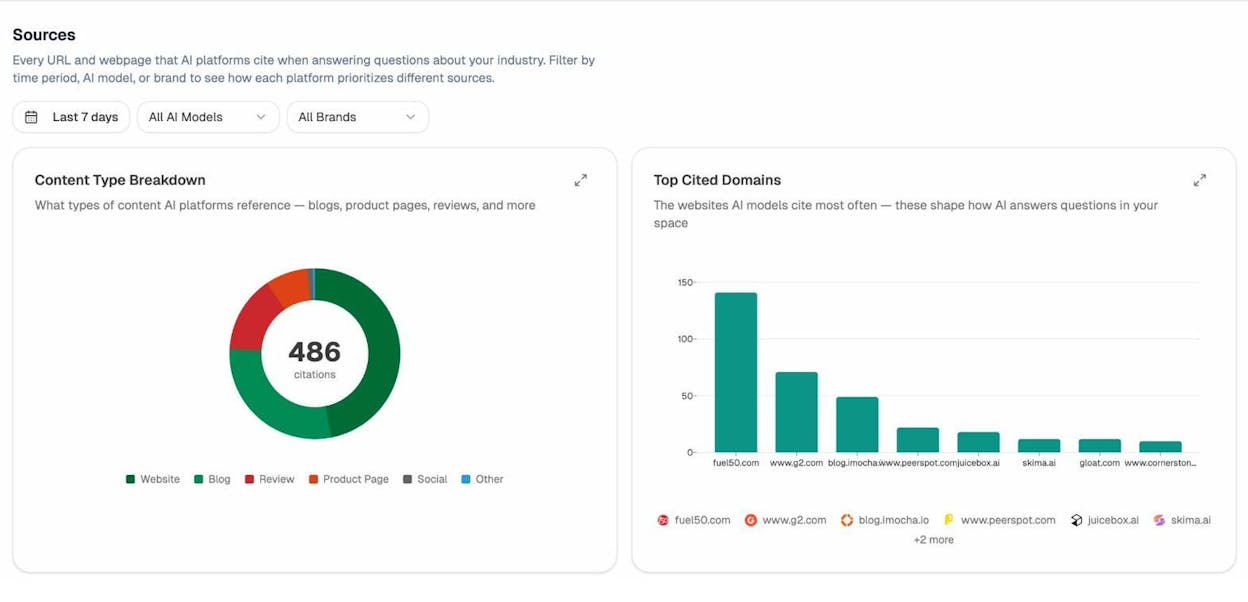
If a review site or third-party blog is heavily cited by AI engines in your space, that’s a signal. Getting mentioned, linked, or featured on that source could boost your visibility in AI answers.
Use ad hoc prompt searches to test your visibility
Before building an entire tracking campaign, you can run a one-off prompt search across AI engines to see who shows up for any question.
The AI Search Explorer in Analyze AI lets you type any prompt, select a country, and instantly see which brands and sources AI engines mention in their answers.
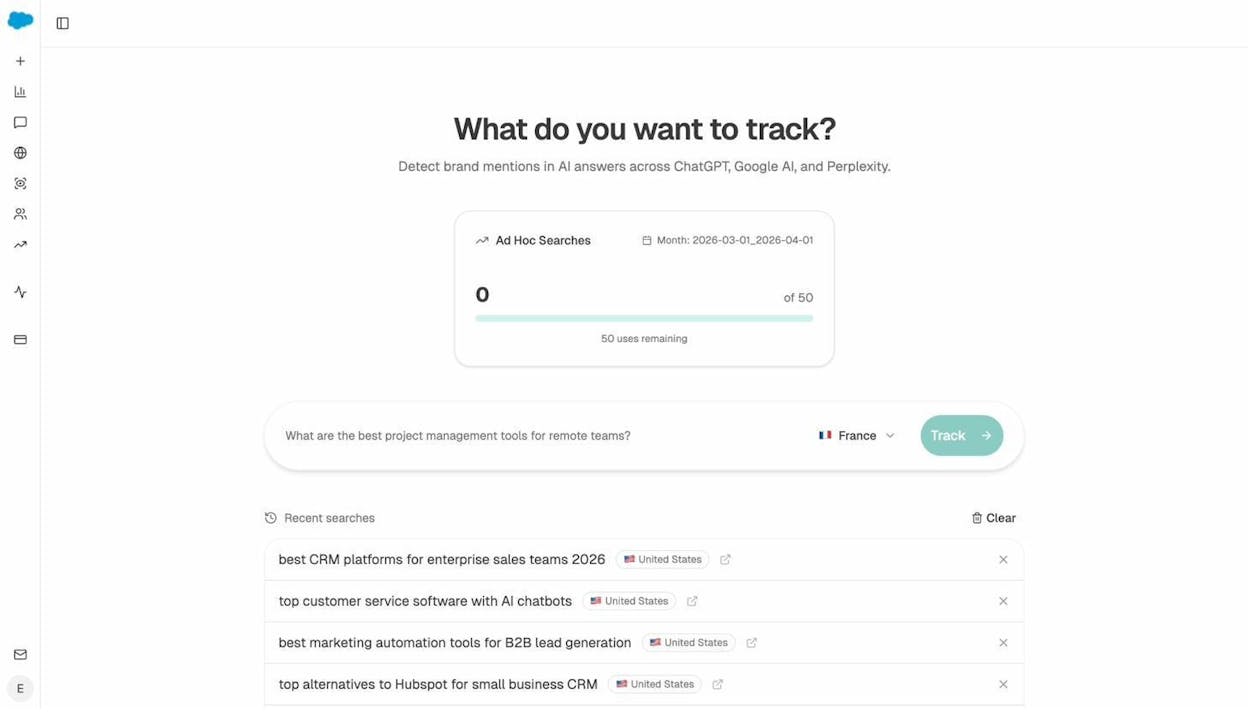
Think of this as the AI search equivalent of a manual Google search. You’re checking visibility for a specific query before committing to ongoing tracking.
Search volume is a compass, not a GPS
Search volume was never meant to give you exact coordinates. It was meant to point you in the right direction.
The SEOs and content marketers who get the best results from keyword research are the ones who understand this. They use search volume as one signal among many. They look at the SERP, the competition, the business value of the topic, the topic cluster, and the trend direction before making a decision.
And as organic search expands beyond Google into AI search engines, the idea of a single “accurate” volume number becomes even less relevant. What matters is whether people are searching for topics related to your business (they are), whether you’re visible where those searches happen (in both Google and AI engines), and whether you can create content that earns traffic from both channels.
You don’t need perfect data to build a great SEO content strategy. You need directionally accurate data, a clear understanding of what it does and doesn’t tell you, and the discipline to pair it with real-world signals like SERP analysis, traffic data, and competitive intelligence.
The tool that gives you the “most accurate” search volume is not the one that shows you the most precise number. It’s the one that helps you make the best decision.
Ernest
Ibrahim


