


Summarize this blog post with:
We pulled the latest figures from the Chrome User Experience Report (CrUX), the 2025 Web Almanac (which analyzed performance across millions of pages on the HTTP Archive), the Core Web Vitals Technology Report, and several recent third-party studies. We focused on 2025 data because the Core Web Vitals lineup changed in 2024, which makes older studies misleading. More on that in a moment.
In this article, you’ll see what the latest Core Web Vitals data reveals about how the web actually performs in 2025, which metric most sites still fail, and how page speed is now starting to shape something newer than rankings, namely AI search citations.
You’ll also get a step-by-step approach to fixing the metric most pages get wrong, and a way to track those improvements alongside your visibility in ChatGPT, Perplexity, Gemini, and Copilot.
Table of Contents
What changed since the last big Core Web Vitals study
Most published Core Web Vitals studies still reference First Input Delay (FID). FID is no longer a Core Web Vital. In March 2024, Google replaced it with Interaction to Next Paint (INP), and the swap matters more than it sounds.
FID measured only the very first input on a page. INP measures every interaction across the page lifecycle and reports the value at the 75th percentile, which captures the slower-end experiences rather than the median. That makes INP harder to pass than FID, especially on JavaScript-heavy pages.
So if you are benchmarking against an older study that says “almost every site passes interactivity,” that conclusion no longer holds. The bar moved.
The three current Core Web Vitals are:
-
Largest Contentful Paint (LCP). How fast the main visible content loads. Good is under 2.5 seconds.
-
Interaction to Next Paint (INP). How quickly the page responds to clicks and taps. Good is under 200 milliseconds.
-
Cumulative Layout Shift (CLS). How much the layout jumps around as the page loads. Good is below 0.1.
Now to what the data shows.
Only about half the web passes Core Web Vitals
According to the 2025 Web Almanac, which uses CrUX data from July 2025, 48% of mobile origins and 56% of desktop origins pass all three Core Web Vitals. A separate analysis from DebugBear using October 2025 CrUX data put the desktop pass rate slightly higher at 57.1% and mobile at 49.7%.
Either way, more than half the mobile web is still failing.
![[Screenshot of HTTP Archive 2025 Web Almanac chart showing the year-over-year Core Web Vitals pass rate from 2021 to 2025, split by mobile and desktop]](https://www.datocms-assets.com/164164/1778088904-blobid1.png?auto=format,compress&w=1248&fit=max)
The trend line is positive but slowing. Mobile climbed from 32% in 2021 to 36% in 2023, jumped to 44% in 2024, and reached 48% in 2025. Desktop went from 41% in 2021 to 56% in 2025. Most of the easy wins are gone, and the next gains are harder to come by.
Here is the year-over-year picture in a single table.
|
Year |
Mobile pass rate |
Desktop pass rate |
|---|---|---|
|
2021 |
32% |
41% |
|
2022 |
31% |
44% |
|
2023 |
36% |
48% |
|
2024 |
44% |
55% |
|
2025 |
48% |
56% |
Source: 2025 Web Almanac (HTTP Archive, CrUX July 2025).
LCP is where most sites fail
Breaking the pass rate down by metric on mobile gives a much sharper picture of where the actual problems are.
|
Core Web Vital |
% of mobile origins rated Good (2025) |
|---|---|
|
LCP (Largest Contentful Paint) |
62% |
|
INP (Interaction to Next Paint) |
77% |
|
CLS (Cumulative Layout Shift) |
81% |
LCP is the choke point. CLS and INP are both above 75% globally, but only 62% of mobile pages clear the LCP threshold. That tracks with what every performance team sees in the field. Getting the largest visible element on screen in under 2.5 seconds is hard once you add a hero image, web fonts, third-party scripts, and a slow server.
The implication for prioritization is clear. If your site fails Core Web Vitals, the cause is almost always LCP. Fix that first and your overall pass rate will move further than from any other change.
Mobile lags desktop, and the gap is closing slowly
Desktop improved from 48% in 2023 to 56% in 2025. Mobile improved from 36% to 48% over the same period. The absolute gap shrank, but desktop still leads by 8 to 10 percentage points across studies.
The reasons are familiar. Weaker CPUs on mid-range phones, slower mobile networks (still mostly 4G in many markets), and more aggressive third-party scripts that hurt mobile harder than desktop. If your traffic skews mobile-heavy, your CWV story will skew worse.
Home pages are slower than the rest of your site

This finding is new since the older 2022 studies, and it’s worth highlighting.
The 2025 Web Almanac broke pass rates down by page type:
-
Home pages: 47% pass on desktop, 45% on mobile.
-
Secondary pages: 61% pass on desktop, 56% on mobile.
The gap is 14 points on desktop and 11 points on mobile. Home pages tend to carry larger hero media, more dynamic blocks, and more third-party tags, all of which hurt LCP. Secondary pages are usually templated and benefit from cached resources.
The practical takeaway is that if your overall pass rate looks poor, audit your home page template separately. It is almost certainly dragging the average down.
CMS rankings: Duda leads, WordPress lags
The Core Web Vitals Technology Report tracks pass rates by CMS. Mid-2025 numbers from the report:
|
CMS |
% of sites passing CWV |
|---|---|
|
Duda |
83.6% |
|
Shopify |
~70% |
|
Squarespace |
~67% (and #1 for INP at 95.85%) |
|
Wix |
~60% |
|
Drupal |
~52% |
|
WordPress |
43.4% |
WordPress powers roughly 40% of the web, so its underperformance pulls the overall web average down. WordPress sites started 2025 at 42.58% passing and ended June at 43.44%. Effectively flat for the first half of the year.
If you’re on WordPress, hosting quality and a small set of plugins (caching, image optimization, render-blocking script management) explain most of the variance between sites that pass and sites that don’t. Choosing a host with edge caching included is usually the dominant factor.
Performance varies by country
![[Screenshot of CrUX dashboard showing country-level Core Web Vitals pass rates with the top 10 and bottom 10 markets]](https://www.datocms-assets.com/164164/1778088916-blobid4.png?auto=format,compress&w=1248&fit=max)
Performance still varies sharply by country. Korea continues to lead globally, sitting near the top across study after study. Markets with widespread fiber and modern phones cluster near the top alongside it. Markets where most users browse on mid-range Android devices over slower connections cluster at the bottom.
If your audience is concentrated in slower markets, your scores will under-index relative to peers serving Western Europe or East Asia, even with identical code. This isn’t an excuse to stop optimizing. It is an argument for more aggressive optimization (smaller images, less JavaScript, more aggressive caching) because your users start with less headroom.
Where Core Web Vitals meet AI search
This is where older studies stop, and where the picture has shifted substantially.
A few years ago, Core Web Vitals only mattered for Google rankings. Today, the same speed metrics also gate something else, which is whether AI search engines like ChatGPT, Perplexity, Gemini, and Copilot can read your pages well enough to cite them.
Here is what the recent data shows.
AI crawlers operate on tighter timeouts than Googlebot. Most AI bots give up after 1 to 5 seconds if a page hasn’t returned content. Googlebot is far more patient. If your TTFB (Time to First Byte) is high or your LCP comes from JavaScript that hasn’t executed yet, AI crawlers may pull a partial page or skip it entirely.
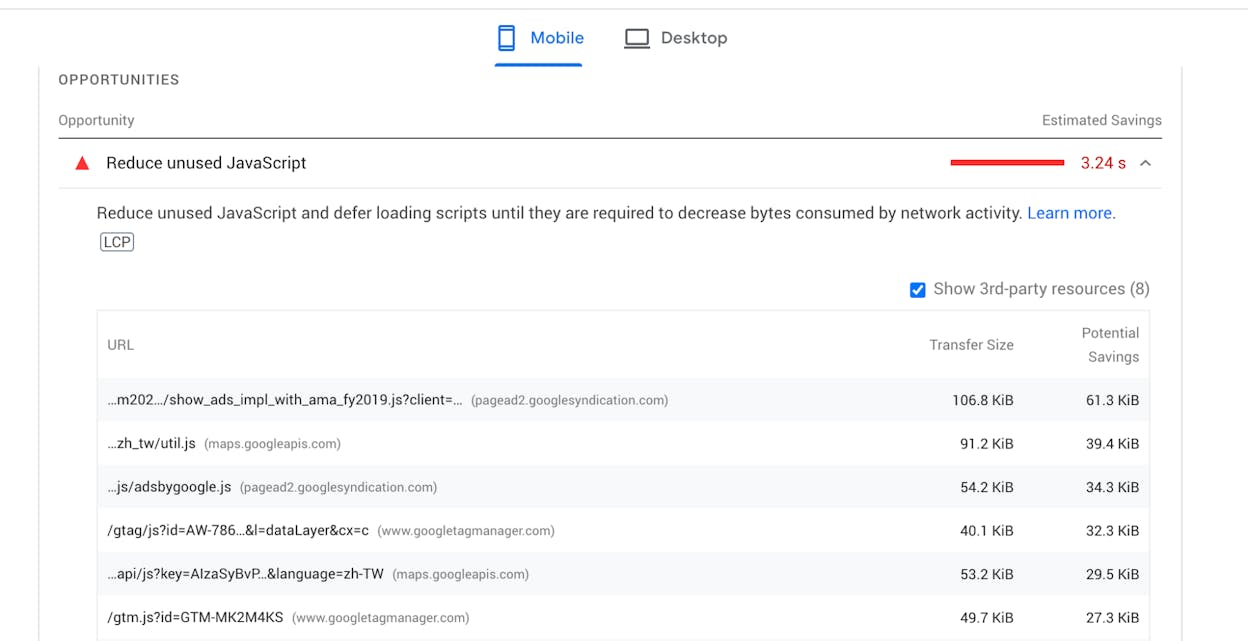
Most AI crawlers do not execute JavaScript. PerplexityBot, GPTBot, and Claude’s crawler all read raw HTML. Anything that depends on client-side rendering is invisible to them. This means a page can pass CWV in the field (because real Chrome users render the JS) but still fail to enter the AI retrieval pool.
Page speed correlates with citation frequency. Independent analysis of pages cited by ChatGPT, Perplexity, and Copilot found that pages with First Contentful Paint under 0.4 seconds averaged 6.7 citations, while slower pages averaged 2.1. The technical performance gap shows up as a visibility gap.
The honest framing is that Core Web Vitals are not a confirmed direct ranking signal in AI search the way they are in Google. But they shape the candidate pool. AI engines mostly draw their sources from existing search indices and from real-time crawls that respect timeouts. A page that fails CWV badly tends to lose engagement, lose Google ranking, and become harder to fetch, all of which push it out of the set AI engines pick from.
This connects to our position at Analyze AI, which is that AI search isn’t replacing SEO. It’s an additional organic channel that shares many of the same technical foundations. A fast, accessible page wins twice. If you’re new to this framing, our breakdown of the 4 pillars of an effective SEO strategy for AI search walks through it in more depth.
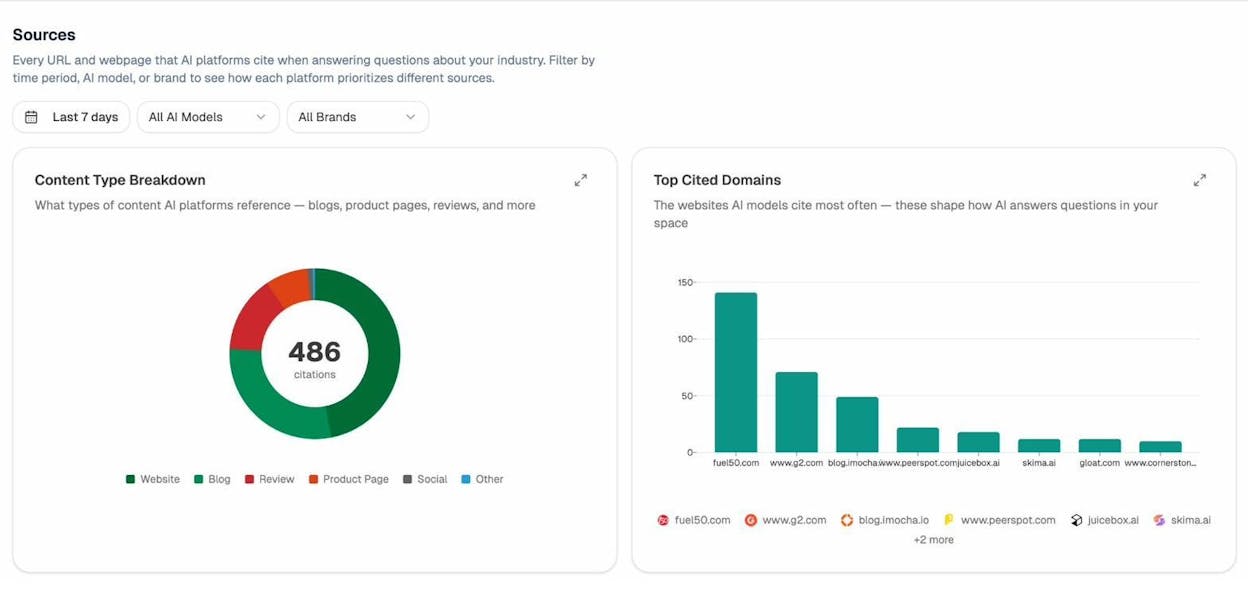
In Analyze AI, the Sources view shows every URL and webpage that AI platforms cite when answering questions in your industry. If your pages aren’t fast enough or accessible enough for AI crawlers, they won’t appear here, no matter how strong the content is.
How to fix Core Web Vitals (start with LCP)
Since LCP is the metric most sites fail, it’s the place to start. Here is a practical sequence.
Step 1: Find which pages fail and which metric is failing
Open Google Search Console and go to the Core Web Vitals report under the Experience section. This shows real field data from Chrome users grouped by URL pattern.
![[Screenshot of the Google Search Console Core Web Vitals report showing URL groups rated Poor, Needs Improvement, and Good, with the failing metric labeled for each group]](https://www.datocms-assets.com/164164/1778088922-blobid6.png?auto=format,compress&w=1248&fit=max)
Group failing URLs by template, not by individual page. If all your product pages share one failure pattern, you’ll fix them all by fixing the template.
Step 2: Run a lab test on a representative URL
Use PageSpeed Insights, which is free and runs Lighthouse in the cloud. PageSpeed Insights returns both lab and field data side by side, so you can see what real users experience and what the page looks like to a synthetic test.
![[Screenshot of PageSpeed Insights for a single URL, with the LCP score visible, the LCP element highlighted in the diagnostics panel, and the LCP subparts breakdown shown]](https://www.datocms-assets.com/164164/1778088923-blobid7.png?auto=format,compress&w=1248&fit=max)
The section to focus on is “Diagnostics” → “Largest Contentful Paint element”. This tells you exactly which element on the page is being measured. Usually it’s a hero image or a headline above the fold. Fixing LCP starts with making that element appear faster.
Step 3: Optimize the LCP element
Three fixes cover most LCP failures.
-
Preload the LCP image with <link rel="preload" as="image" href="..." fetchpriority="high">. This tells the browser to fetch it immediately rather than waiting for the HTML parser to find it.
-
Serve the LCP image in a modern format (WebP or AVIF) at the actual rendered size. A 4000-pixel-wide hero displayed at 1200 pixels is wasted bytes.
-
Don’t lazy-load the LCP image. Lazy-loading is for below-the-fold content. Loading the hero image lazily delays LCP by hundreds of milliseconds.
Step 4: Fix server response time (TTFB)
TTFB is the foundation. If your server takes 1.2 seconds to send the first byte, no front-end optimization will get LCP under 2.5 seconds. Move to a faster host, add edge caching, or put the page behind a CDN. For WordPress sites, this is usually the dominant fix.
You can run a quick health check across your domain with the Analyze AI website traffic checker and the website authority checker to spot domain-level issues that often show up alongside CWV failures.
Step 5: Wait for the field data to update
CrUX uses a rolling 28-day window. If you ship a fix today, it takes about a month for the field data to fully reflect it. Don’t panic when Search Console keeps showing the old number for the first few weeks.
Step 6: Repeat for INP and CLS
Once LCP is in the green, move to INP (typically caused by long JavaScript tasks blocking the main thread) and then CLS (typically caused by images without dimensions, dynamically injected ads, or fonts that swap to a different size).
How to track CWV improvements alongside AI visibility
Core Web Vitals are one half of organic visibility in 2026. AI search visibility is the other. Once you’ve fixed your speed issues, the next question is whether those fixes are translating into more citations and more AI-driven traffic.
That’s where Analyze AI fits in. Two views are particularly useful here.
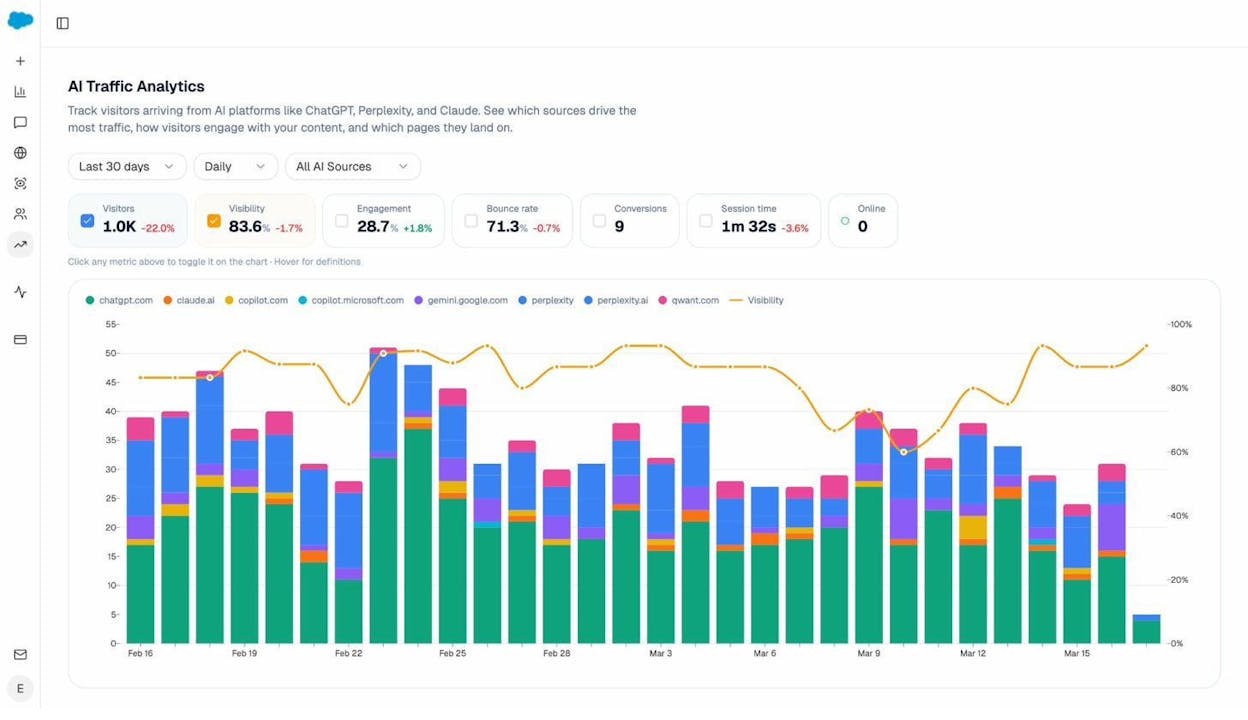
The AI Traffic Analytics view shows visitors arriving from ChatGPT, Perplexity, Claude, Gemini, Copilot, and other AI engines, broken down by source over time. After a CWV fix ships, this is the report to watch for an uplift in AI-referred sessions.
The Landing Pages view inside AI Traffic Analytics breaks AI-referred traffic down by URL. This is where patterns emerge. Which pages are working, which are still invisible, and where to invest next.
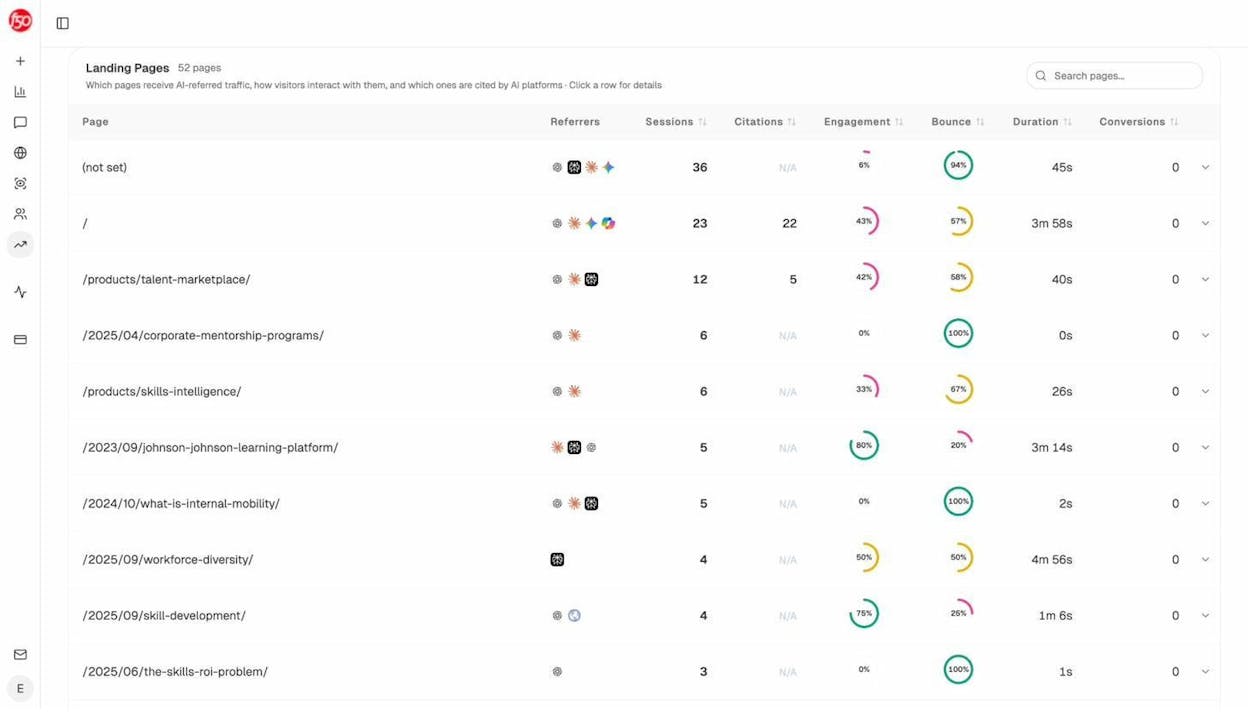
If a page that previously got zero AI citations starts appearing here after a speed fix, you’ve connected the cause to the effect. If pages that were already fast keep dominating citations, that confirms the pattern. Speed is a gate, not a differentiator. Once you clear it, content quality and authority do the rest.
For a deeper view of which pages your competitors are winning AI citations on (and which keywords those pages rank for), the competitor intelligence features inside Analyze AI surface exactly where you have the technical foundation to compete but haven’t yet. And if you want a single dashboard that pulls visibility, sentiment, and engine breakdowns into one weekly view, the weekly email digests give you a snapshot of changes without logging in.
What this data should change in your roadmap
Three takeaways are worth acting on.
First, the dominant CWV opportunity is still LCP, and within LCP it is still the hero image and TTFB. If you have a backlog of “performance work,” put those at the top.
Second, the metric mix has changed. INP is harder than FID was. Old playbooks that focused on first-input optimization will leave gaps. Audit interactions that happen mid-session, not just first-load.
Third, speed now buys you two channels, not one. The same work that improves Google rankings also makes your pages legible to AI crawlers that operate on tighter timeouts. The investment compounds.
The web is getting faster, slowly. The question for any individual site is whether it’s getting faster faster than the average. If 48% of mobile origins now pass, the median is moving. Standing still means falling behind.
For more on how AI search and SEO work as one organic channel rather than competing channels, see our deep dive on how to get mentioned in AI search and our walkthrough of the SEO competitor analysis process for AI search.
Ernest
Ibrahim


