


Summarize this blog post with:
In this article, you’ll learn the four categories of website metrics that actually inform decisions, the free and paid tools to track each, how to read the patterns those metrics form together, and how to apply the same framework to AI search now that ChatGPT, Perplexity, Claude, and Google AI Mode are sending real visitors to your site.
Table of Contents
The four categories of website metrics worth tracking
Every metric you will ever see fits into one of four buckets.
|
Category |
Question it answers |
Examples |
|---|---|---|
|
Traffic |
Who is showing up and where from? |
Unique visitors, sessions, source, country |
|
Engagement |
What are they doing once they land? |
Engagement rate, average engagement time, pages per session |
|
Visibility |
How easy are you to find in search and AI answers? |
Keyword rankings, AI prompt rankings, citations, backlinks |
|
Conversion |
Did anything happen at the bottom of the funnel? |
Signups, demo requests, revenue per visitor |
Anything that does not fit one of these buckets is probably a vanity metric. Treat the four as one dashboard you check together, not four separate reports you check once a quarter.
1. Traffic metrics
Traffic metrics tell you the size and shape of your audience. Three numbers do most of the work, and one channel deserves its own row in the table.
Unique visitors count individual people. If the same person comes back twice in a day, that counts as one unique visitor.
Sessions count visits. The same person can rack up several sessions a week.
Sessions per visitor tells you whether people come back. Above 1.5 means a meaningful share of your audience is returning rather than passing through once.
You can pull all three from Google Analytics 4, Plausible, or Simple Analytics. For a quick external read on a domain you do not own, the free Analyze AI Website Traffic Checker estimates monthly visits without an account.
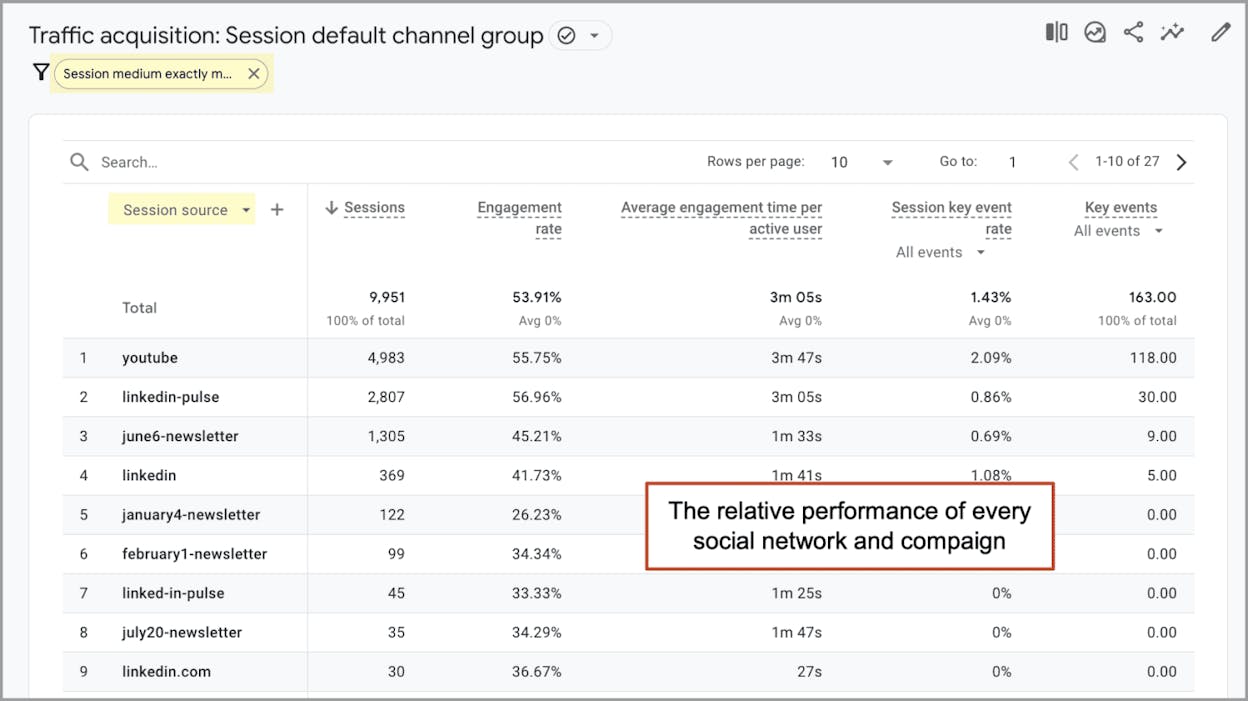
Traffic sources matter more than the totals
Total visits feel good. The breakdown by source tells you where to invest. In GA4, the Acquisition report under Traffic acquisition splits sessions by default channel grouping. A healthy portfolio looks something like this.
|
Channel |
Healthy share |
What a problem looks like |
|---|---|---|
|
Organic Search |
35-55% |
Below 25% means rankings are not pulling weight |
|
Direct |
15-25% |
Above 40% often hides untagged traffic |
|
Referral |
5-15% |
Zero referral usually points to a thin backlink profile |
|
Social |
5-15% |
Wild swings here mean you are at the mercy of one platform |
|
AI Search |
Growing month over month |
Flat or zero usually means GA4 is misattributing it |
There is no universal “correct” mix. The point is to spot single-source dependence early. A site getting 80% of its traffic from one channel is one algorithm change away from a bad quarter.
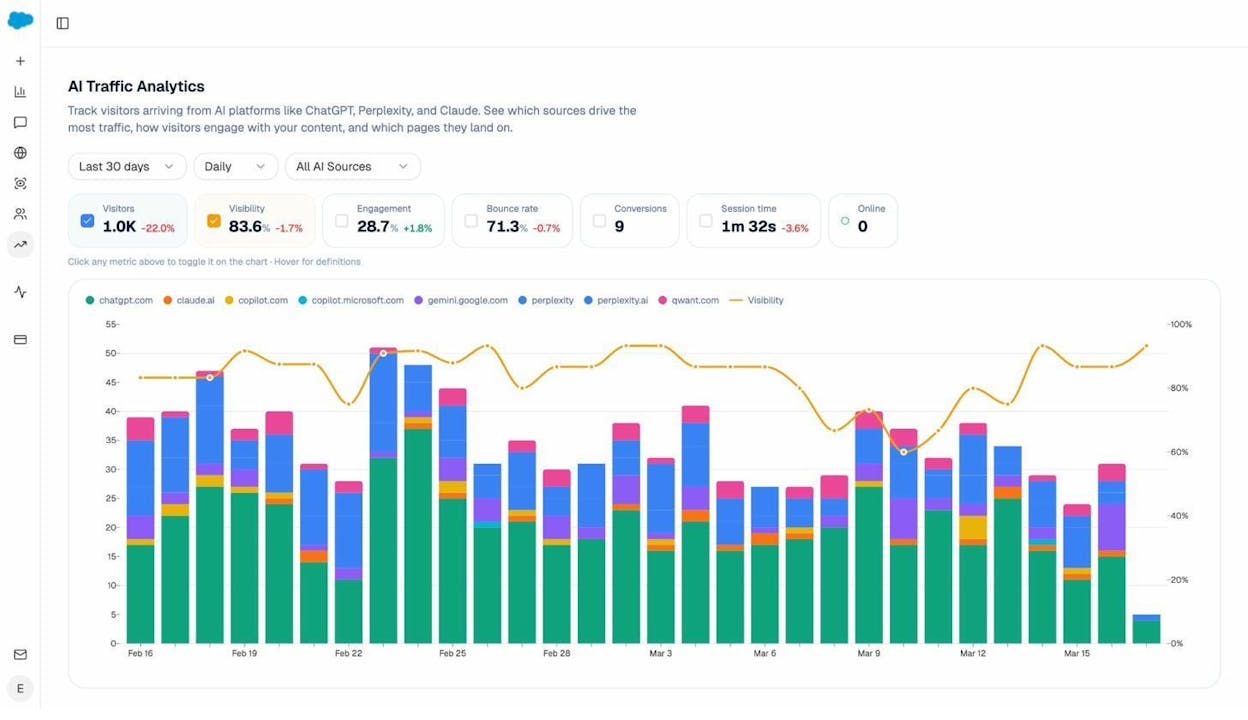
AI search is its own traffic channel now, and standard analytics tools miss it
GA4, by default, dumps visits from chat.openai.com, perplexity.ai, and claude.ai into “Direct” or “Referral.” That misclassification hides a channel that is growing fast.
Analyze AI’s AI Traffic Analytics breaks AI visitors out cleanly so you can see how each assistant is sending sessions, which pages they land on, and how engaged they are.
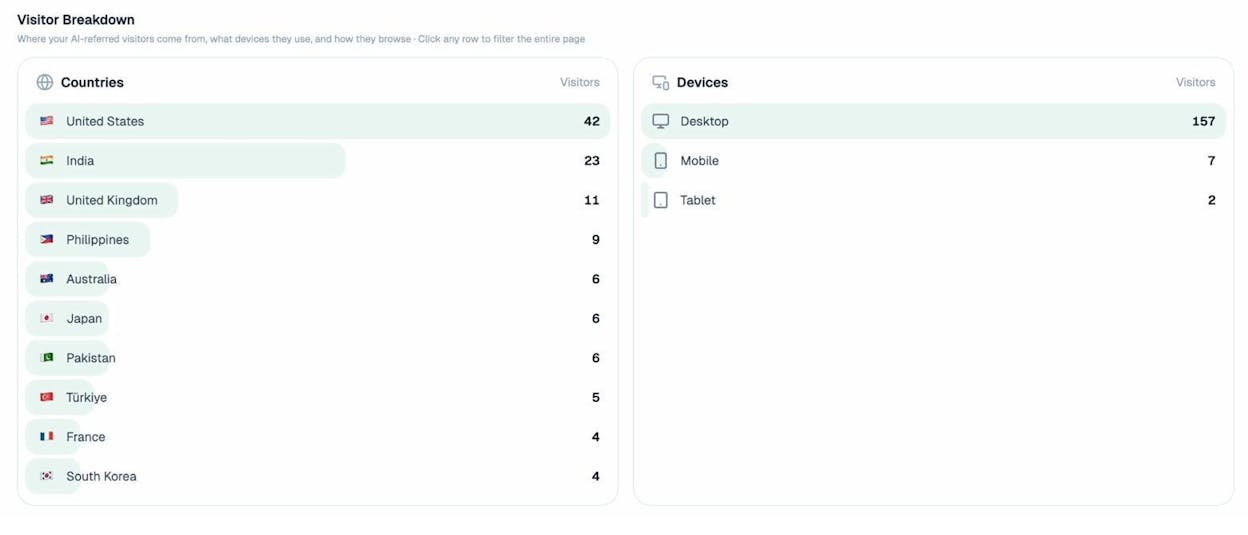
You can also see country-level breakdowns the same way you would for traditional traffic, which matters because AI search adoption is much higher in some regions than others.
For a free read on AI visibility before committing to any tool, the Keyword Rank Checker and SERP Checker cover the SEO side, and AI Search Explorer handles the AI side.
2. Engagement metrics
Once someone lands, engagement metrics tell you whether the page did its job. GA4 changed the vocabulary here, so a quick translation.
|
Old GA name |
New GA4 equivalent |
What it actually measures |
|---|---|---|
|
Bounce rate |
Inverse of engagement rate |
Sessions that did not engage |
|
Time on page |
Average engagement time |
Active time on the tab |
|
Pages per session |
Pages per session |
Same as before |
The number to focus on is engagement rate. A session counts as “engaged” if it lasts more than 10 seconds, has a conversion event, or includes two or more page views. Healthy engagement rates run between 55% and 75% for content sites. Below 40% usually points to a content quality or page speed problem.
Average engagement time has more nuance. For a how-to article, two to four minutes is a strong signal. For a contact page, ten seconds is fine. The number only means something against the page’s intent.
Pages per session above 1.8 means your internal linking is working. If it sits at 1.0, every visitor is bouncing after a single page. Our guide on internal linking for SEO walks through how to fix this.
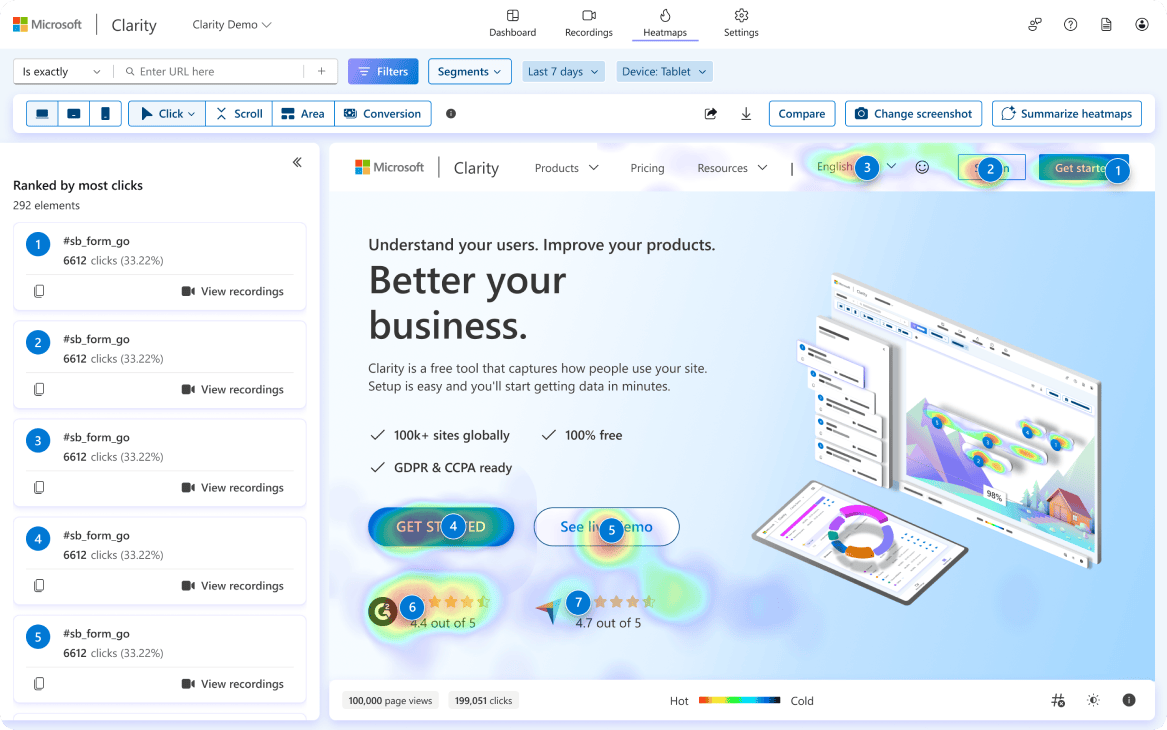
Layer behavioral data on top
Numbers tell you that something is wrong. Behavior recordings tell you what. Microsoft Clarity is free, has no session limits, and gives you heatmaps and session replays in under five minutes of setup.
For AI-referred traffic, engagement looks different. Visitors arriving from ChatGPT or Perplexity often have higher intent than search visitors, but they tend to be on a single fact-finding mission and bounce after they get the answer. Track engagement on AI traffic separately so you can see whether your content is converting that high-intent audience or just feeding the answer engine.
3. Visibility metrics
Visibility is where SEO and AI search share a lot of DNA. Both are about being findable. The metrics split into four pieces.
Keyword rankings (the SEO side)
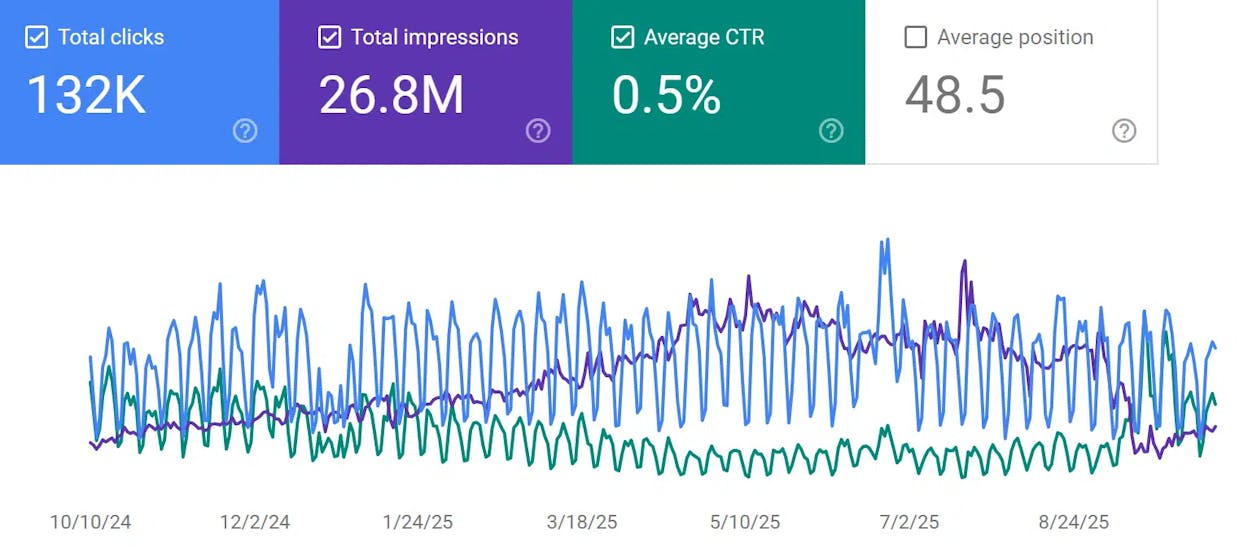
Google Search Console is free and tells you exactly which queries are sending impressions and clicks. Filter by Position 1-20 and impressions above 500 to surface queries where small ranking improvements move real traffic.
For deeper coverage, you will want a rank tracker. The Analyze AI Keyword Rank Checker is free for spot checks. For ongoing tracking, a paid rank tracker that updates daily is standard. We compare options in our keyword tracking tools post.
AI prompt rankings (the new sibling)
In AI search, you do not rank for keywords. You rank inside answers to specific prompts. “Best CRM for small business” might generate three different answers across ChatGPT, Perplexity, and Google AI Mode, and your brand might appear in one but not the other two.
Analyze AI tracks visibility, sentiment, and position across prompts the same way a rank tracker handles keywords.
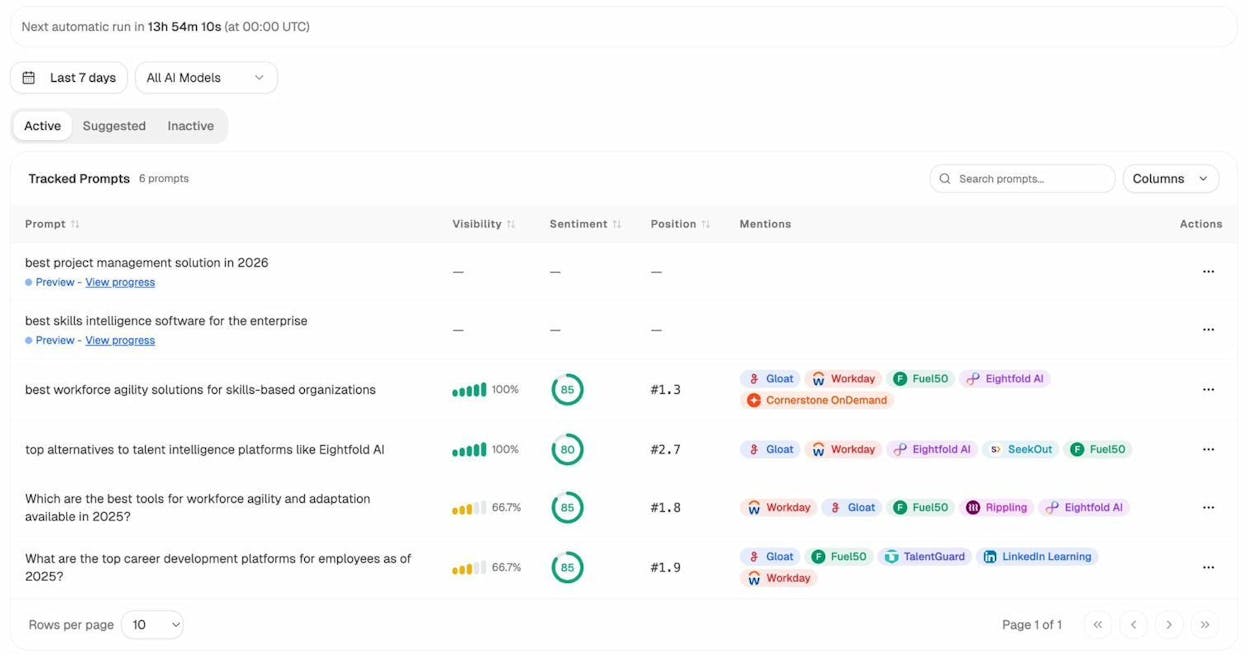
The dashboard view tells you where you stand against competitors at a glance.
For the full method, our guides on how to rank on ChatGPT and how to rank on Perplexity break down what the citation data actually shows.
AI citations and source authority
When ChatGPT or Perplexity answers a question, the URLs they cite are the AI search equivalent of Google’s top ten. If your domain is consistently absent from the cited sources in your category, you have a discoverability problem in AI search regardless of where you rank in Google. The Sources view shows which domains AI engines reach for in your space.
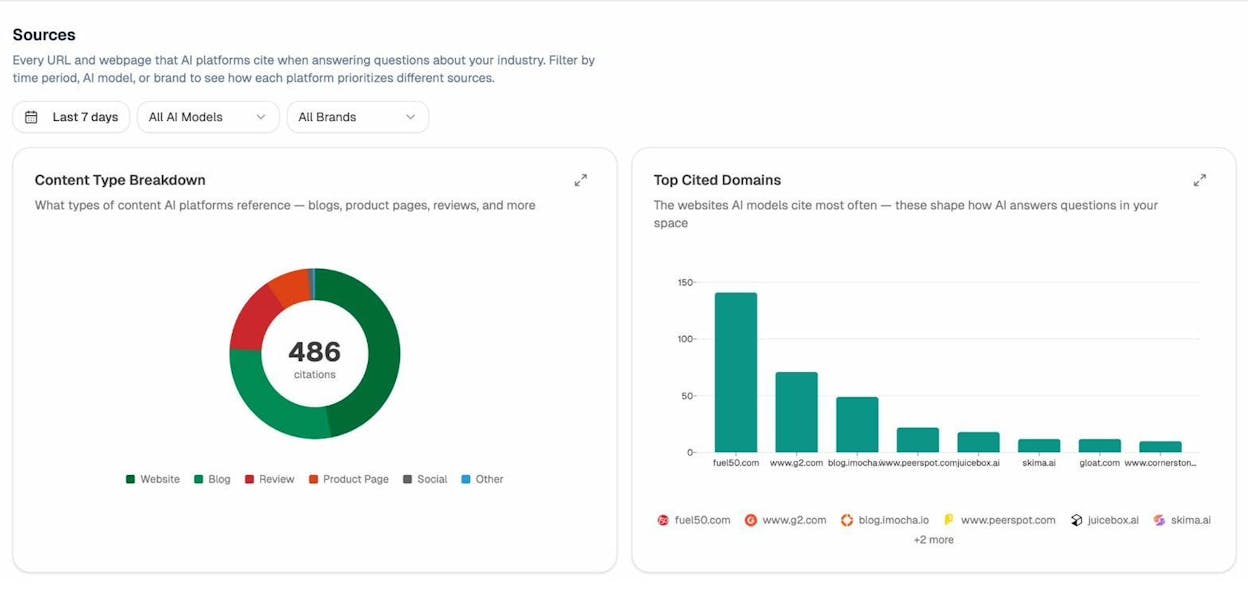
This is a different lens than backlinks. A page can be cited by ChatGPT every day without ever earning a backlink, and that citation drives both traffic and brand authority on its own.
Backlinks and branded vs unbranded
Backlinks remain a meaningful signal for both Google and, indirectly, the LLMs that train on Google-indexed pages. The Analyze AI Website Authority Checker gives you a free read on any domain, and the Broken Link Checker catches lost equity from 404s. Track referring domain count month over month (not total backlinks), the loss-to-gain ratio, and anchor text diversity. If 80% of your inbound anchors are your brand name, you are under-indexed on topical authority.
Branded traffic confirms you are building a name. Unbranded traffic confirms you are reaching new audiences. Healthy SaaS sites typically sit between 30% and 50% branded. If you cross 60% branded, you are probably under-investing in top-of-funnel content.
4. Conversion metrics
Everything above is input. Conversion is the output. Three numbers cover the territory.
Conversion rate by channel. Total conversions divided by sessions, segmented by source. Organic search and AI search often convert at very different rates from paid social, and treating them as one number hides the lever you actually want to pull.
Conversion rate by landing page. This is the page-level diagnosis. Two pages with similar traffic and similar intent should not have a 5x difference in conversion rate. When they do, that is a writing or design problem on the lower one.
Revenue per visitor. Channels that drive low-volume, high-intent traffic look unimpressive on session counts and shine on revenue per visitor. AI search is in this category for a lot of B2B sites right now.
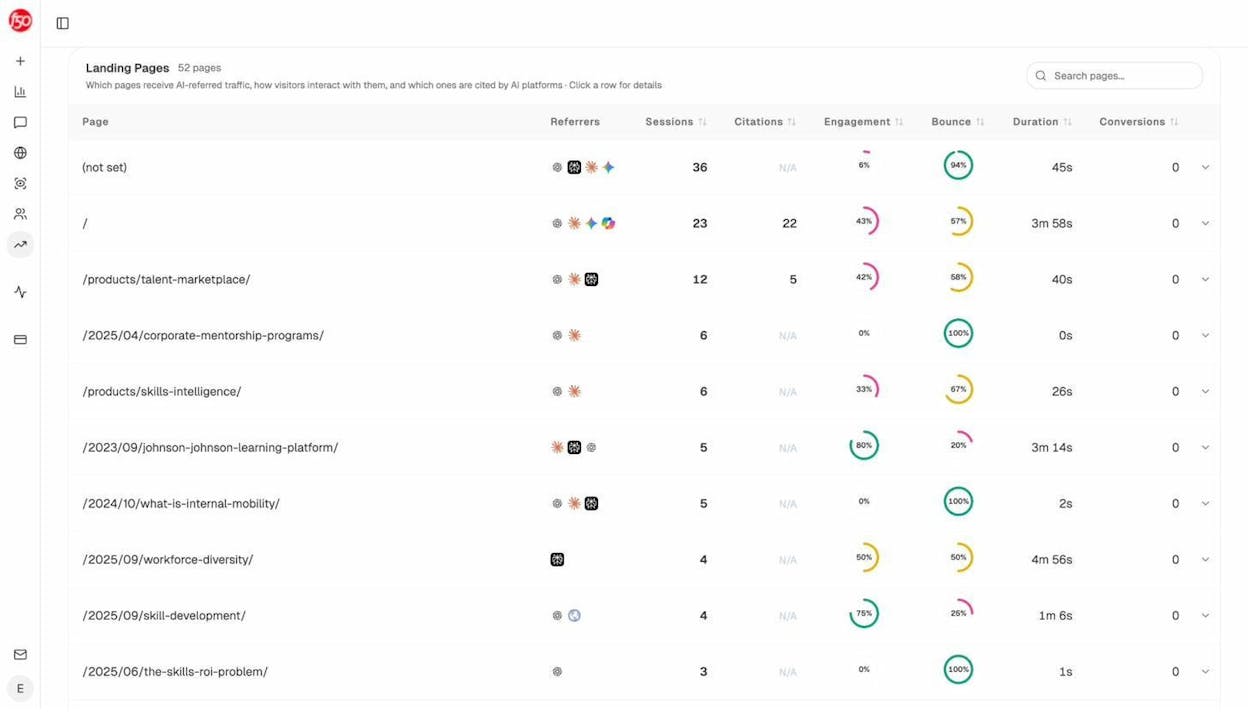
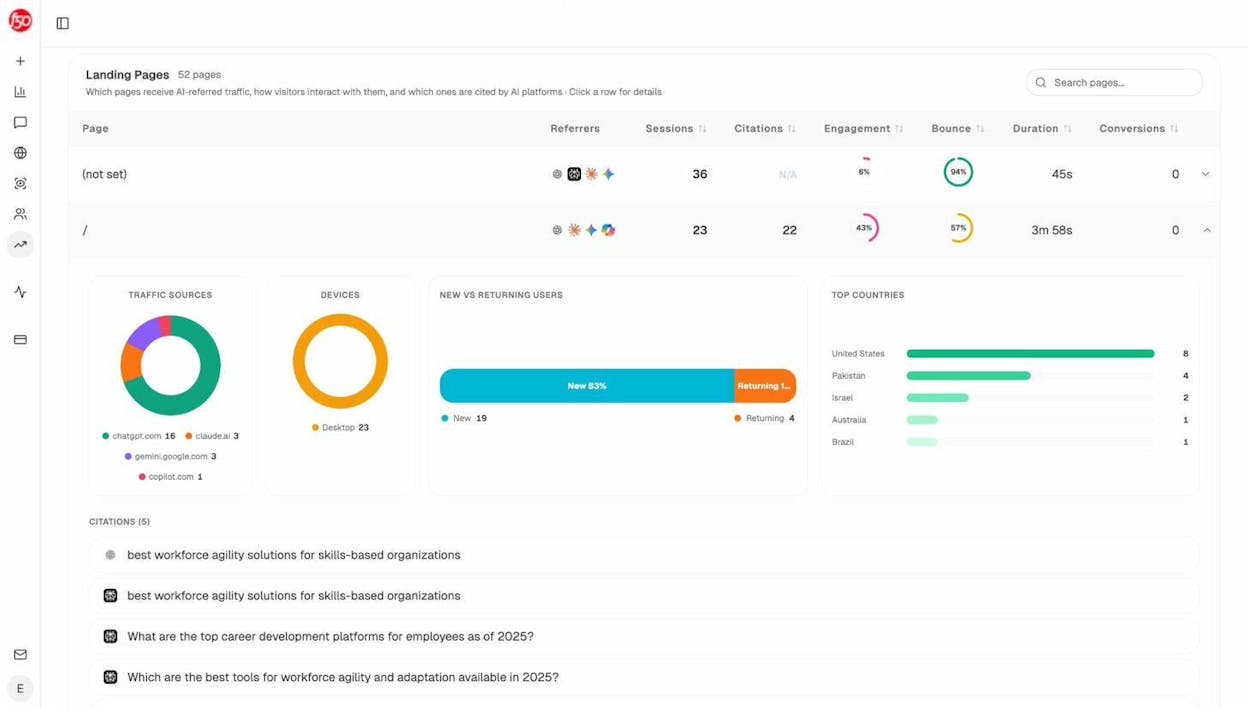
In Analyze AI, the landing pages view ties the AI source to the conversion event so you can answer “did Perplexity actually generate any signups this month?” with a number, not a guess.
The AI Content Optimizer helps you tighten the pages that already convert so they hold position in both Google and the AI engines.
How to read the patterns instead of drowning in numbers
Single data points lie. Patterns across multiple metrics tell the truth. Three patterns are worth learning to spot.
Sudden changes. A 40% spike in one direction needs an explanation before you celebrate or panic. Filter by source to see if the spike is concentrated (one referral) or distributed (real growth). A spike that engages and converts is real. A spike that bounces at 95% is bot traffic or one-off Reddit attention.
Slow trends. A 3% week-over-week climb in organic traffic for six straight weeks is more valuable than any spike. Compounding growth is the kind that survives algorithm updates.
Cross-metric correlation. This is the skill analysts often skip. Useful pairings include the following.
-
Rankings up + traffic flat. Probably an AI Overview is eating your clicks. We cover what to do in our GEO vs SEO post.
-
AI citations up + organic traffic flat. Brand exposure is growing without click-through. Strengthen your homepage and brand pages because that is where the eventual searches will land.
-
Engagement down + traffic up. New traffic is the wrong fit. Check which keywords or prompts are sending the new visitors and decide whether to keep them.
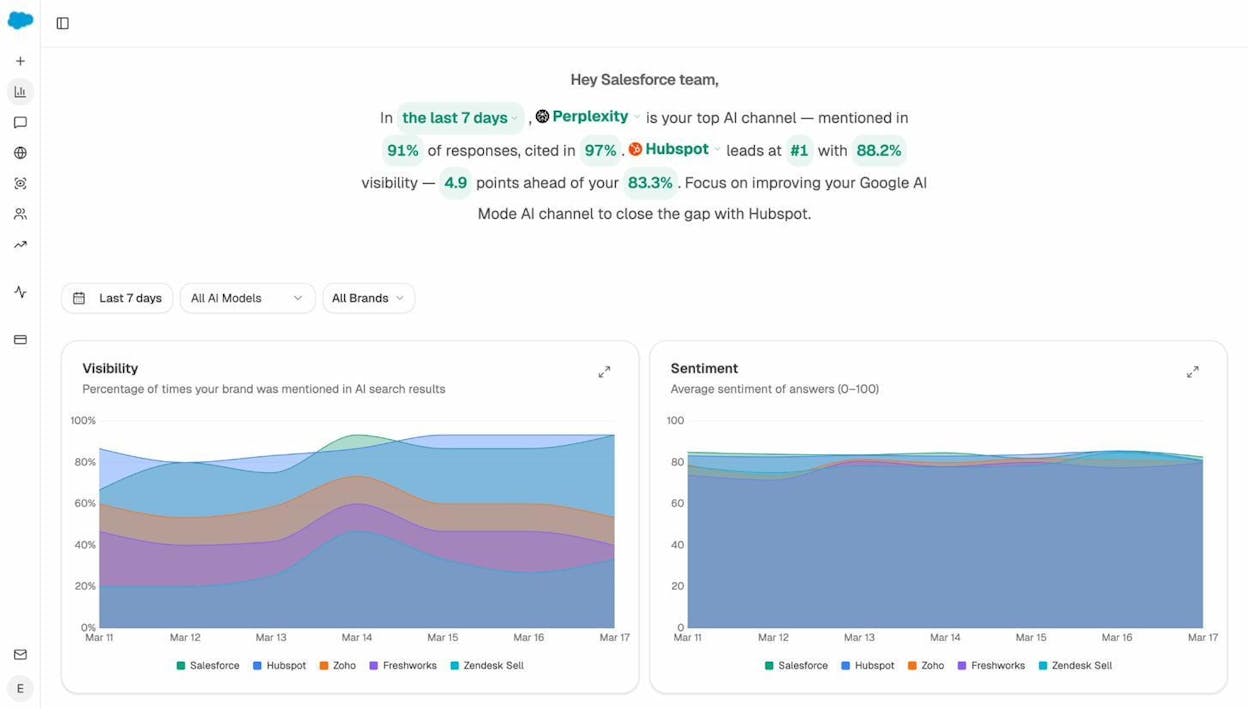
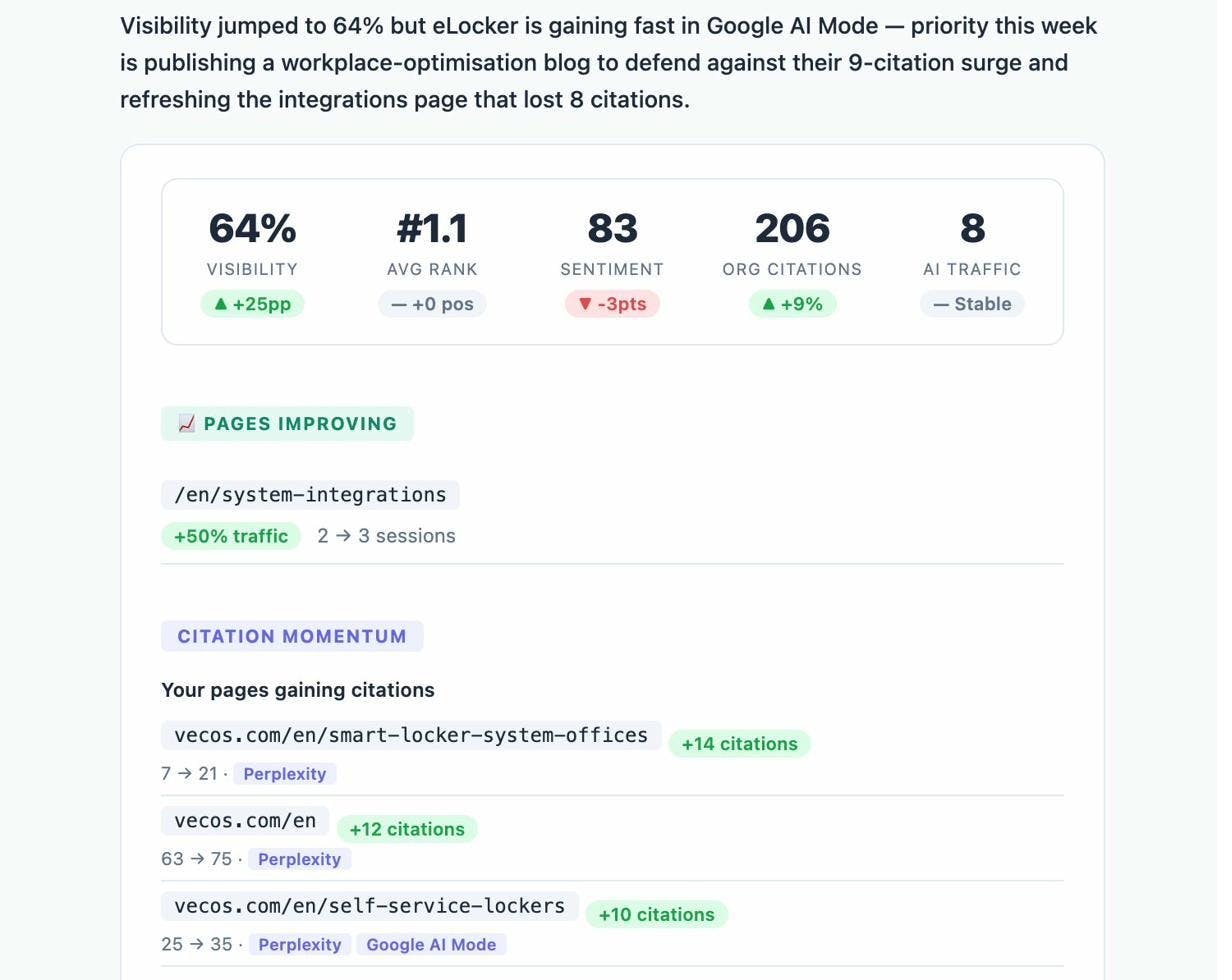
For AI search specifically, weekly digests catch patterns before they become problems. Analyze AI sends a weekly summary that surfaces what changed and why.
Red flags and how to diagnose each one
A lot of metric guides give you a list of red flags. Few give you the diagnosis. Here is the short version.
|
Red flag |
First thing to check |
Likely fix |
|---|---|---|
|
Organic traffic down 20%+ in a month |
GSC for impressions vs clicks |
If impressions held but clicks fell, an AI Overview displaced you. Refresh the page and add unique data points. |
|
AI citations dropped sharply |
Sources report for which domains replaced you |
Update the cited page with fresher info, then re-submit to GSC for re-indexing |
|
Bounce rate above 80% on key landing pages |
Page speed and intent match |
Fix LCP under 2.5s, or rewrite the H1 to match query intent |
|
Conversion rate falling while traffic grows |
Channel breakdown |
One source is sending lower-intent visitors. Pause or refine that channel. |
|
One traffic source above 60% of total |
Diversification gap |
Build at least one other channel before the dominant one shifts |
|
Engagement time under 30 seconds on long content |
Above-the-fold problem |
Rewrite the first 100 words to deliver the promise of the title |
How often should you check?
Daily check-ins create anxiety and rarely create insight. Use this cadence instead.
|
Cadence |
What to look at |
Time |
|---|---|---|
|
Real-time |
Automated alerts only |
0 minutes (set once) |
|
Weekly |
Traffic by channel, top movers, AI prompt rankings |
30 minutes |
|
Monthly |
Conversion by channel, citation trends, content audit pulls |
90 minutes |
|
Quarterly |
KPI vs OKR, competitive share of voice, content portfolio review |
Half a day |
Set alerts in GA4 for any drop above 20% week over week, and in Analyze AI for any visibility drop above 10 points.
How do you stack up against competitors?
Internal numbers tell you how you are doing. Competitive numbers tell you whether “doing well” actually means anything in your market.
Organic share of voice. What percentage of total search traffic in your category does your domain capture? If you sit at 5% and the category leader is at 40%, the gap is the size of your opportunity.
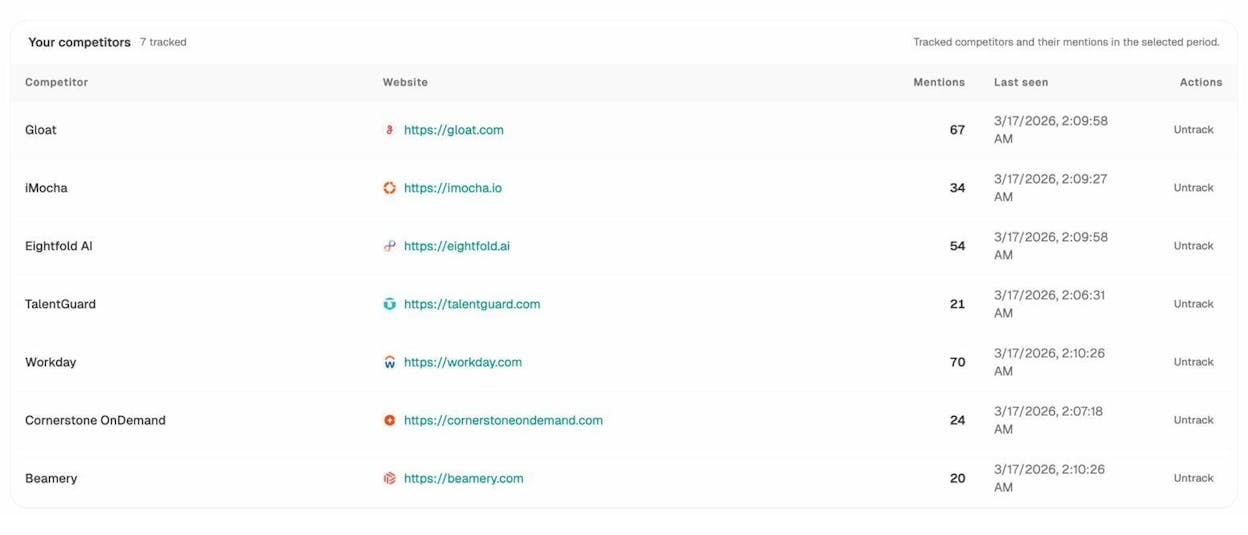
AI share of voice. Same idea, applied to AI answers. Across the prompts that matter in your category, how often do you appear vs your top three competitors?
The Competitors view in Analyze AI tracks this directly.
Opportunity prompts. This is the actionable competitive metric. The Opportunities report shows you the exact prompts where competitors get cited and you do not.
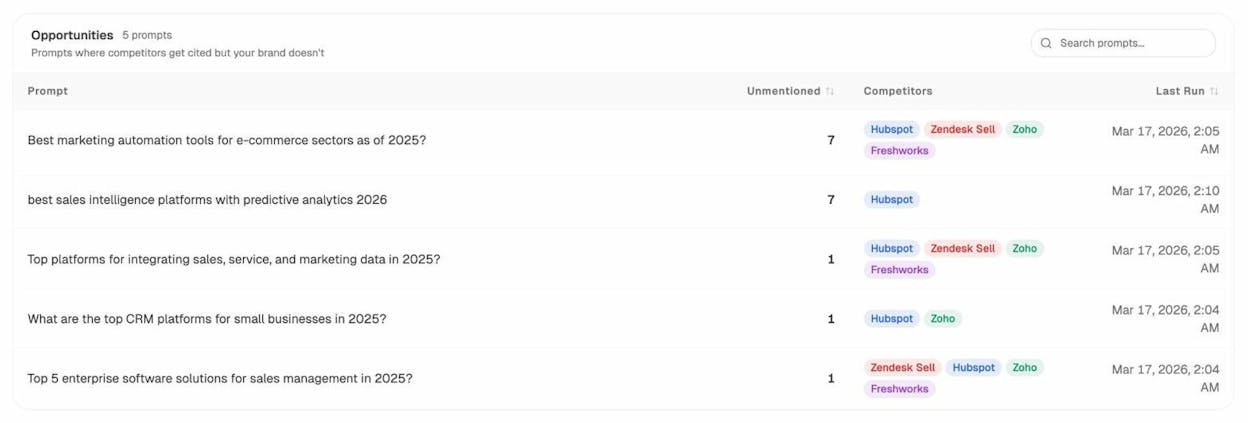
Each row is a content brief. You know the prompt, you know who is winning, and you know the gap. From there, the AI Content Writer can help you produce the page that closes it. For traditional SEO competitive analysis, our SEO competitor analysis guide walks through the full workflow.
How to report all of this without putting people to sleep
A lot of internal analytics reports fail because they list numbers without saying what to do about them. A useful report has five things per metric.
-
The number (“Organic traffic was 18,400 this month”)
-
The change (“up 12% vs last month”)
-
The cause (“driven by the refreshed pricing page now ranking #3 for two new queries”)
-
The implication (“we are likely to hold this through Q3 unless the page slips”)
-
The next step (“refresh the next two pages on the same template”)
Tailor the depth to the audience. A CEO needs the implication and the next step. A content lead needs the cause. Anyone reading the report should know what changed, why, and what to do about it within five minutes.
For a deeper template, our SEO reporting tools post covers the formats that work for different team sizes, and our content marketing reporting tools post does the same on the content side.
A short closing thought
Pick four metrics, one from each category, and ignore everything else for a quarter. A lot of teams spend more energy hunting for new metrics than acting on the ones they already have. The team that watches conversion rate every Monday and ships a fix every Tuesday will outperform the team with the prettier dashboard.
For AI search, this gets easier the earlier you start. Brands tracking visibility, citations, and AI traffic now will have a year of data when their competitors are still figuring out which assistant is sending visitors. That head start compounds.
When you are ready to instrument the AI side of all four categories in one dashboard, that is what Analyze AI was built to do.
Ernest
Ibrahim


