


Summarize this blog post with:
According to a study by Ahrefs that analyzed one month of data across 146,741 websites and nearly 9 billion total clicks, anonymous queries account for 46.08% of all clicks. That means for almost every click GSC does attribute to a keyword, there’s another click it doesn’t attribute to anything at all.
If you’re making content decisions based on GSC data alone, you’re working with roughly half the picture.
In this article, you’ll learn why Google Search Console hides the queries behind nearly half of all clicks, how to measure exactly how much data your site is missing, and what practical steps you can take to fill in those gaps. You’ll also learn why AI search traffic creates an even larger blind spot than GSC’s hidden queries, and how to close it.
Table of Contents
What counts as a “hidden” query in Google Search Console?
When you open the Performance report in GSC, you see a list of queries alongside their clicks, impressions, CTR, and average position. But the total clicks at the top of the report almost never match the sum of clicks across all listed queries.
The difference is the hidden data.
![[Screenshot description: Google Search Console Performance report showing the total clicks number at the top vs. the sum of individual query clicks below, highlighting the gap]](https://www.datocms-assets.com/164164/1777550777-blobid1.png?auto=format,compress&w=1248&fit=max)
Google labels these as “anonymized queries.” They appear in your total traffic numbers, but GSC won’t tell you what the actual search terms were. The clicks happened. The visits happened. You just can’t see what triggered them.
This isn’t a display bug or an export limitation. Even when you pull data through the GSC API, the missing data persists. The API gives you access to more rows than the interface (the interface caps at 1,000 rows per query), but the underlying anonymization still applies.
How much data is actually missing?
The scale varies wildly from site to site. In the Ahrefs study, some sites had nearly zero missing data while others were missing over 90% of their query clicks. There’s no single number that applies to everyone.
Here’s what the data shows across different traffic ranges.
Low-traffic sites (under 1,000 clicks/month) tend to have the most missing data. This makes sense. When a site only gets a handful of clicks, many of those clicks come from queries searched only once or twice. Google is more aggressive about hiding low-volume queries.
Mid-traffic sites (1,000 to 1 million clicks/month) generally have the least missing data. They get enough volume that more queries cross Google’s anonymization threshold.
High-traffic sites (over 10 million clicks/month) see the problem get worse again. At massive scale, even a huge absolute number of queries end up in the hidden bucket because they represent a tiny fraction of the site’s total query diversity.
![[Screenshot description: Box plot chart showing percentage of missing clicks by traffic range, with low and high traffic sites having more missing data than mid-range sites]](https://www.datocms-assets.com/164164/1777550784-blobid2.png?auto=format,compress&w=1248&fit=max)
The distribution across all sites in the study shows that most fall somewhere around 40-60% missing. But there’s also a large cluster of sites at 95-100% missing. If your site is in that bucket, GSC is telling you almost nothing about what queries drive your traffic.
Why Google hides search query data
Google gives two official reasons for anonymizing queries in the Performance report. They hide queries that contain personal or sensitive information, and they hide queries that are made a very small number of times.
Let’s be honest about what this means in practice.
Privacy filtering
Google strips queries that might contain personally identifiable information. Think names, addresses, phone numbers, medical conditions, or financial details. If someone searches “Dr. Sarah Chen orthodontist reviews near 90210,” that query might get anonymized because it contains a name and a zip code.
This is a reasonable policy. But it doesn’t explain 46% of all clicks being hidden. Most commercial and informational queries don’t contain personal data.
Long-tail query suppression
This is where the bulk of the hidden data comes from. Google suppresses queries that are searched very few times. The exact threshold isn’t public, but the pattern is clear. If a query generates only one or two impressions for your site, it’s likely to be anonymized.
And this is a bigger deal than it sounds. Google has confirmed that 15% of all searches have never been seen before. Those are entirely new queries that no one has ever typed into Google. They won’t appear in GSC because they’re below the volume threshold.
But “never seen before” doesn’t mean “not valuable.” A query like “best CRM for veterinary clinics with HIPAA compliance” might only be searched five times a month. But every single person who searches it is deep in a buying cycle. That’s a high-intent, high-value query that GSC will never show you.
Sampling and processing limits
There’s a third reason Google doesn’t advertise. GSC has processing constraints. Storing and serving query-level data for every single search across every single website in the index requires enormous infrastructure. At some point, Google makes tradeoffs about what data to store and expose.
The GSC API documentation confirms that the tool uses sampling for large datasets. When your site has millions of impressions, the query-level data you see is a sample of the full picture, not the complete dataset.
This means that even the queries GSC does show you might have slightly inaccurate click and impression counts. The data is directionally correct, but it’s not exact.
How to check how much data your site is missing
You can measure the gap in about five minutes using Google Looker Studio (formerly Data Studio).
Step 1: Open Looker Studio and connect GSC
Go to lookerstudio.google.com and create a new report. Add Google Search Console as a data source. Select “Site Impression” and “Web” when prompted.
![[Screenshot description: Looker Studio data source selection screen showing Google Search Console connector with Site Impression and Web options highlighted]](https://www.datocms-assets.com/164164/1777550784-blobid3.png?auto=format,compress&w=1248&fit=max)
Step 2: Create two scorecards
Add two scorecard widgets to your report.
The first scorecard should show Total Clicks with no dimension filter. This gives you the grand total of all clicks GSC recorded for your site.
The second scorecard should show Total Clicks with a Query dimension filter. This gives you only the clicks that GSC has associated with a specific query.
![[Screenshot description: Looker Studio report with two scorecards side by side showing total clicks vs. clicks with query attribution, with the percentage difference calculated]](https://www.datocms-assets.com/164164/1777550790-blobid4.jpg?auto=format,compress&w=1248&fit=max)
Step 3: Calculate the gap
Subtract the second number from the first. Divide by the first number. Multiply by 100. That’s the percentage of your clicks going to hidden queries.
If your total clicks are 10,000 and your query-attributed clicks are 5,500, you’re missing data on 45% of your search traffic.
Step 4: Break it down by page
The page-level view is where this gets really useful. Some pages might have 80% of their clicks attributed to known queries while others have 90% hidden. Pages with a high percentage of hidden queries are the ones where you have the least visibility into what’s driving traffic.
Add a table to your Looker Studio report with Page as the dimension and both click metrics as columns. Sort by the gap percentage to find your biggest blind spots.
![[Screenshot description: Looker Studio table showing individual pages with their total clicks, attributed clicks, and percentage of missing data, sorted by gap size]](https://www.datocms-assets.com/164164/1777550790-blobid5.png?auto=format,compress&w=1248&fit=max)
What can you do about hidden GSC queries?
Knowing the problem exists is step one. Doing something about it is where most guides stop. Here are four practical approaches to recover some of that missing data.
1. Cross-reference GSC with third-party keyword data
Third-party tools like keyword rank trackers maintain their own databases of keyword rankings. They crawl Google’s SERPs independently and record which pages rank for which queries.
This means they often surface keywords that GSC hides. If your page ranks #8 for a query that only gets searched 20 times a month, GSC might anonymize it. But a rank tracking tool that checks that keyword’s SERP will see your page there.
The overlap between GSC and third-party data is never perfect. In the Ahrefs study example, their post on keyword research showed 327 terms in GSC and 426 terms in a third-party tool. Only 178 appeared in both. That means each data source contains unique information the other doesn’t have.
The practical takeaway: use GSC data AND third-party keyword data together. Neither one gives you the full picture on its own.
![[Screenshot description: Side-by-side comparison of keyword lists from GSC and a third-party SEO tool, showing overlapping and unique keywords in each dataset]](https://www.datocms-assets.com/164164/1777550796-blobid6.png?auto=format,compress&w=1248&fit=max)
2. Use Google Ads search terms reports
If you run Google Ads, the Search Terms report shows the actual queries that triggered your ads. Many of those same queries also drive organic clicks to the same pages.
This won’t give you exact organic click data. But it will reveal the types of queries people use to find content like yours. And because Google Ads doesn’t anonymize query data the same way GSC does, you’ll see long-tail variations that GSC hides.
Even a small test campaign with a few hundred dollars in budget can surface dozens of query variations you’d never see in GSC.
3. Mine your server logs
Server logs record every visit to your site, including the referring URL. For Google organic traffic, the referring URL is google.com/ and it doesn’t include the query. Google stripped query strings from referral URLs back in 2011 with the shift to HTTPS search.
But server logs still help in other ways. You can cross-reference the landing pages that receive high volumes of organic traffic with the pages that have the most hidden query data in GSC. If a page gets 500 organic visits in your server logs but GSC only attributes 200 clicks to known queries, you know 300 visits came from hidden terms.
You can then look at the page’s content, its headings, and its on-page targeting to infer what those hidden queries might be. Pages about broad topics tend to attract more long-tail variations. Pages about narrow topics tend to have more concentrated query distributions.
4. Analyze your internal site search data
If your site has a search function, your internal search data is a goldmine for understanding what visitors are looking for. Many of the queries people type into your site search bar are similar to the queries they used to find your site on Google in the first place.
Set up internal site search tracking in Google Analytics (if you haven’t already) and compare those internal queries against your GSC data. The queries that appear in internal search but not in GSC might be the hidden terms driving some of your anonymous clicks.
The blind spot that’s growing faster than GSC’s hidden queries
GSC’s anonymization problem has existed for years. But there’s a newer and arguably bigger data gap that most SEO reporting tools aren’t built to handle.
AI search traffic has no query data at all.
When someone asks ChatGPT, Perplexity, or Gemini a question and clicks through to your site, that visit shows up in Google Analytics as a referral from chatgpt.com, perplexity.ai, or gemini.google.com. But unlike Google organic traffic (where you at least get partial query data from GSC), AI referrals come with zero query attribution by default.
There is no “AI Search Console” built by OpenAI or Perplexity that tells you which prompts drove traffic to your site. The referral URL doesn’t include the user’s prompt. Your analytics tool records the visit but can’t tell you what question led to it.
This means AI search traffic is 100% anonymous by nature. Every single AI-referred visit is a “hidden query” from the start.
And this traffic is growing fast. A study of 3,000 websites found that 63% of sites now receive AI search traffic. For some sites, AI referrals already account for 3-5% of total traffic, and that share is compounding month over month.
If you’re worried about 46% of your GSC data being hidden, you should be equally concerned about a traffic channel where 100% of query data is invisible. At least GSC gives you half the picture. AI search gives you none.
How to see the prompts that drive AI search traffic
This is where AI search analytics fills a gap that GSC and traditional SEO tools can’t.
Analyze AI connects to your GA4 account and isolates traffic from AI engines like ChatGPT, Claude, Gemini, Perplexity, and Copilot. But it goes beyond just counting visits. It maps those visits back to the prompts that generated them.
Here’s what that looks like in practice.
See which AI engines send you traffic (and how much)
The AI Traffic Analytics dashboard breaks down your AI-referred visitors by source. You can see how many sessions came from ChatGPT vs. Perplexity vs. Gemini, how engaged those visitors were, and which ones converted.
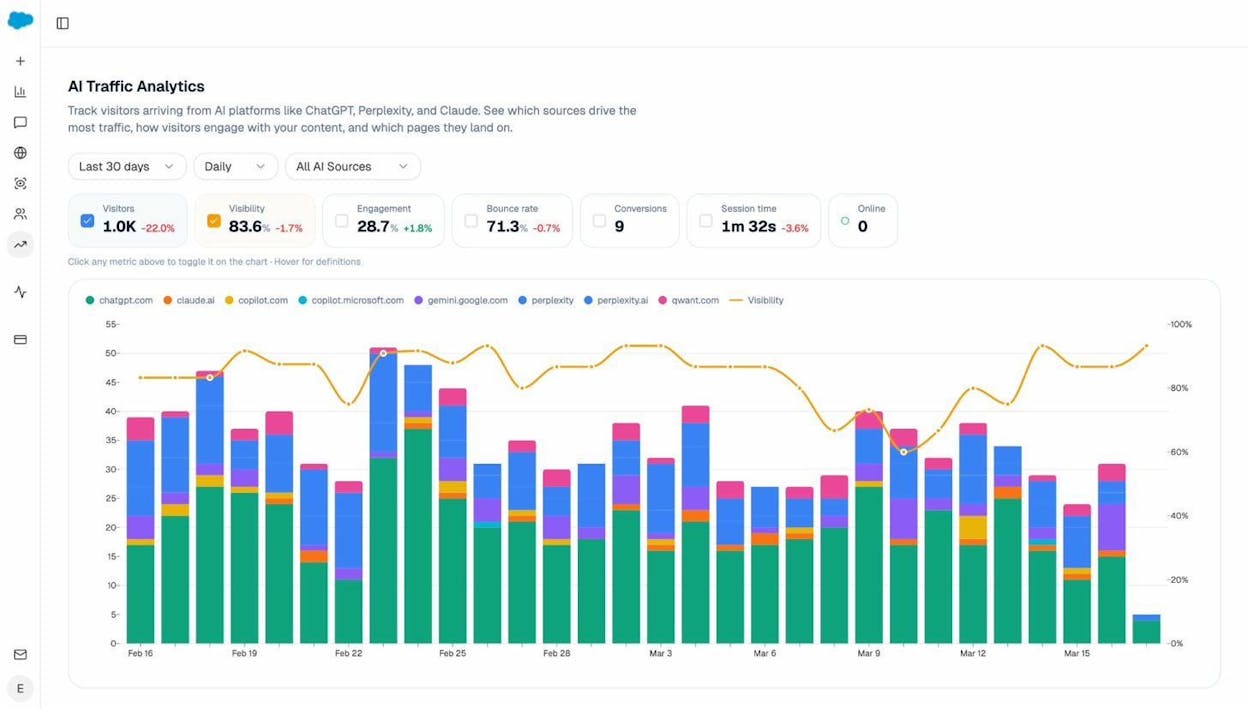
This is the equivalent of the “source” dimension in GSC, but for AI search. Instead of just seeing “AI referral” as one bucket in your analytics, you get engine-level granularity.
See which pages receive AI traffic (and which prompts cite them)
The Landing Pages report shows every page on your site that received at least one AI-referred visit. For each page, you can see the referrer engines, session count, engagement rate, bounce rate, and session duration.
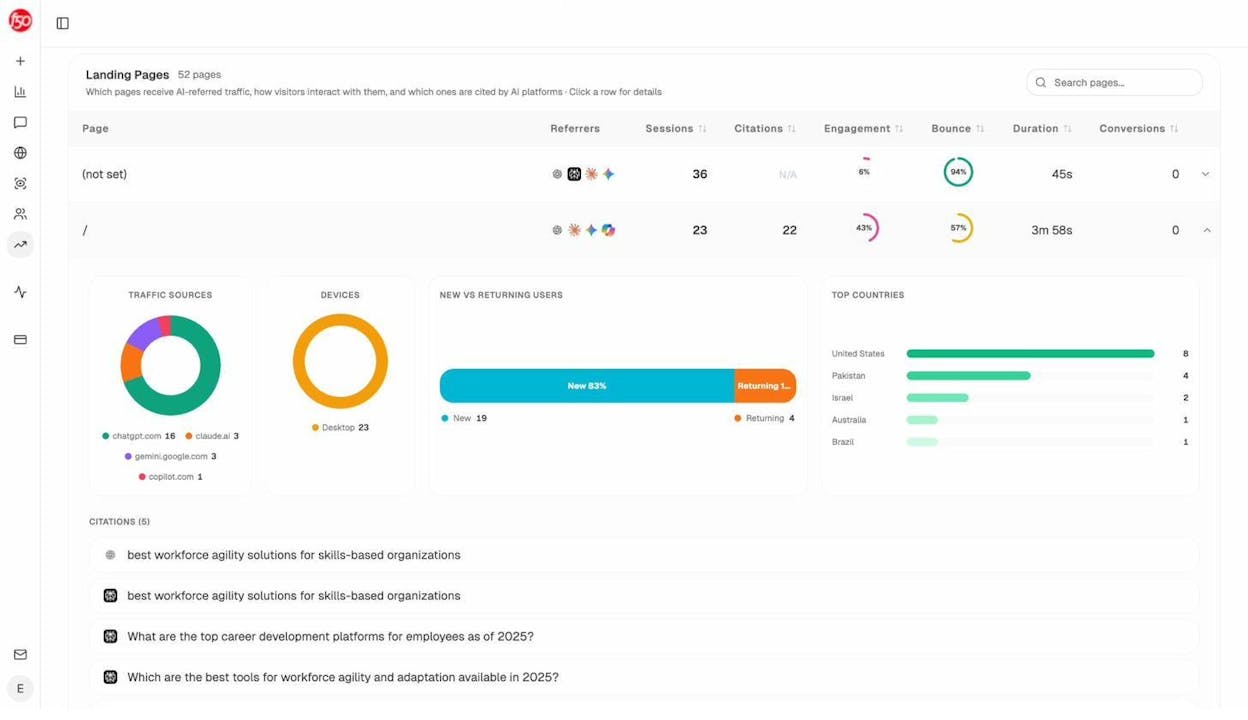
Click into any row and you’ll see the citations tied to that page. These are the specific prompts where an AI engine cited your URL. This is the data that closes the gap. Instead of seeing “50 visits from chatgpt.com” and wondering why, you can see the actual prompts that mentioned your site and sent users your way.
This is like having a GSC Performance report for AI search. Instead of anonymous referrals with no context, you get prompt-level attribution.
Track which prompts mention you (and which don’t)
Beyond traffic attribution, you can proactively track specific prompts across AI engines. Set up the queries that matter to your business and monitor whether AI engines mention your brand, what position you appear in, and how sentiment trends over time.
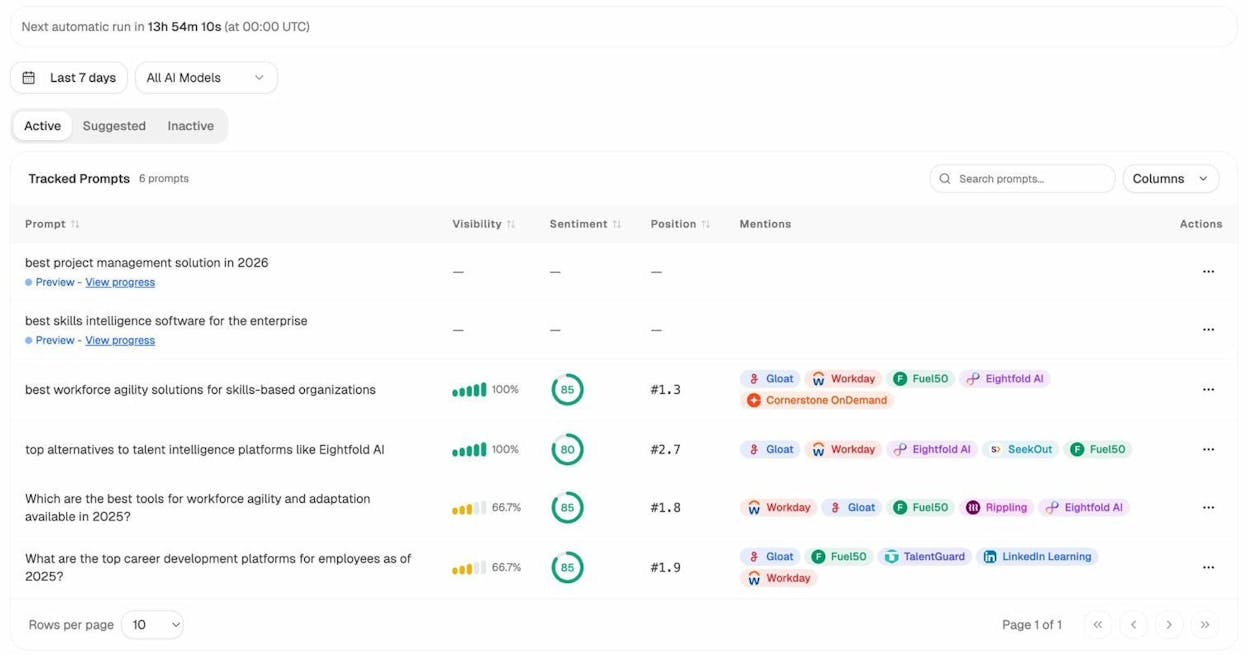
Think of this as rank tracking for AI search. In traditional SEO, you track your Google rankings for target keywords. In AI search, you track your brand’s visibility for target prompts. Both tell you where you stand and where you need to improve.
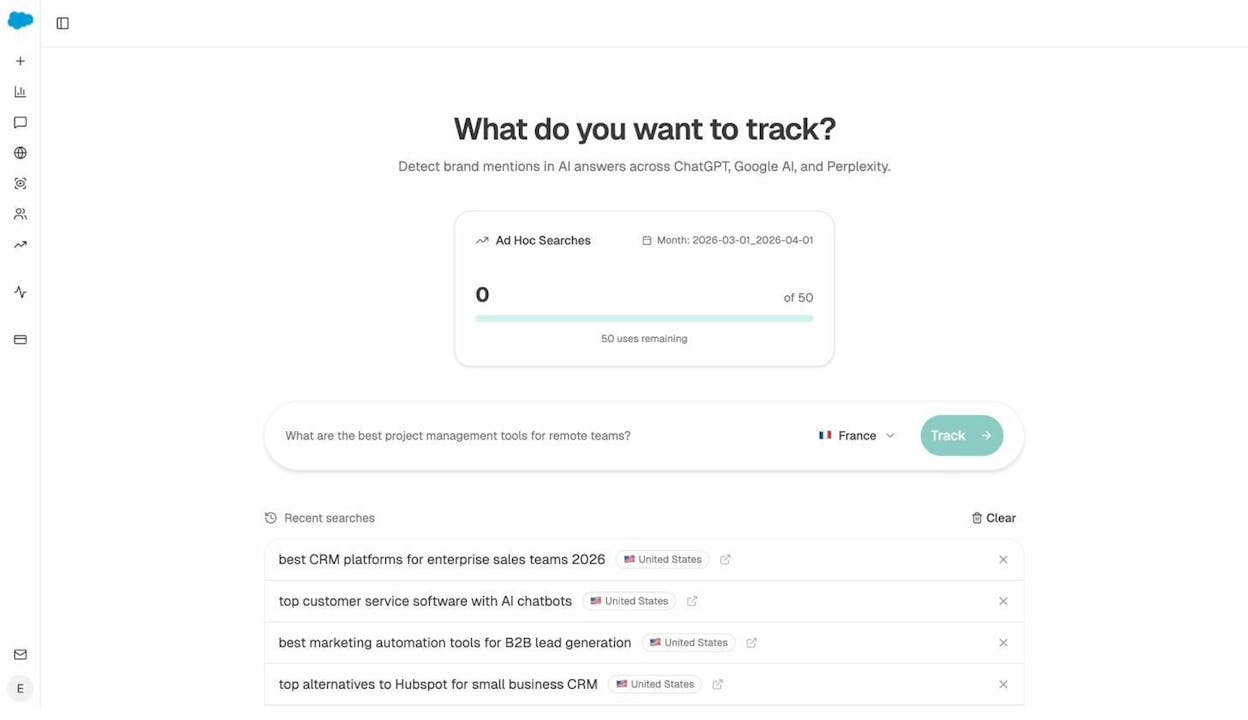
You can also run ad hoc searches to test any prompt across ChatGPT, Gemini, and Perplexity in real time. This is useful for quick research before committing to a full tracking campaign.
See what sources AI engines trust in your space
The Sources dashboard reveals every URL and domain that AI engines cite when answering questions about your industry. You can see the content type breakdown (blogs, product pages, reviews, social) and which domains get cited most often.
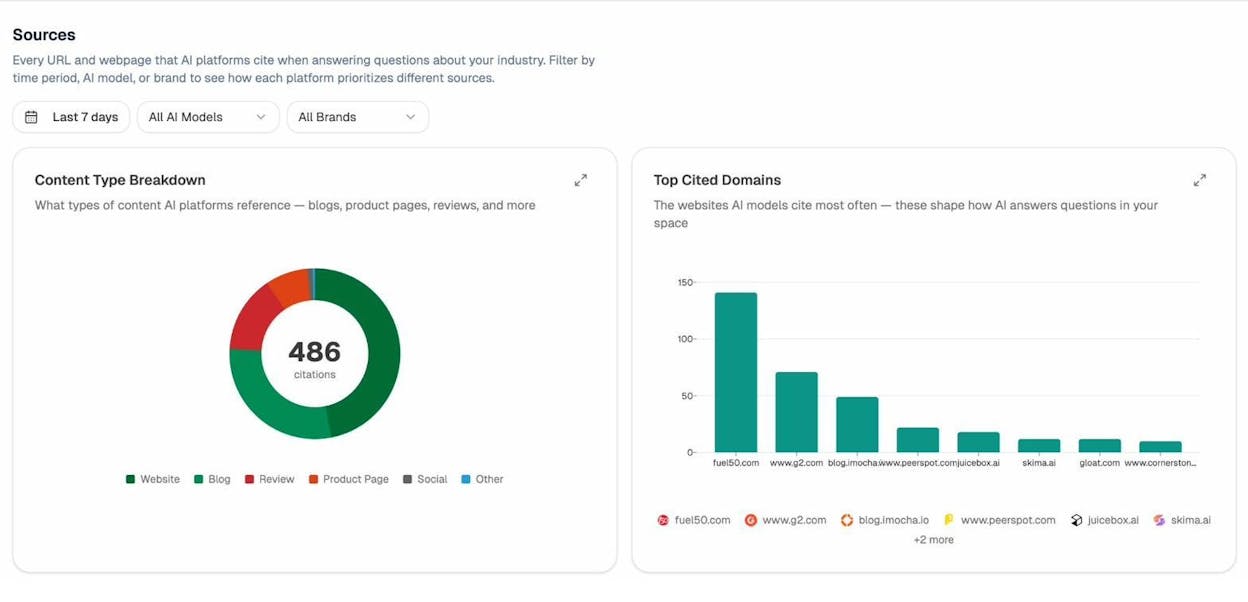
This is strategic intelligence you can’t get from GSC at all. GSC tells you what queries people used to find you on Google. The Sources dashboard tells you what content AI engines consider authoritative in your space, and whether your content is among it.
If a competitor’s blog gets cited 150 times while yours gets cited 12 times, you know exactly where the gap is. You can then use that insight to improve your content, earn more citations, and grow your AI search traffic.
What this means for your SEO and content strategy
GSC’s hidden query problem and AI search’s zero-attribution problem both point to the same strategic reality. Your search traffic data has always been incomplete, and the gaps are getting wider.
Here’s how to adjust.
Stop treating GSC data as the complete picture
GSC is still valuable. It’s still the best source of Google-specific query data. But you should always assume that for every query GSC shows you, there are others it doesn’t. Build your content strategy around the topics and intents you can observe, not just the specific keyword strings GSC reports.
If a page ranks well and gets traffic, it’s likely attracting dozens of long-tail variations that GSC anonymizes. Instead of fixating on the exact keywords GSC shows, focus on covering the broader topic thoroughly. The hidden queries will follow.
Treat AI search as another organic channel (not a replacement for SEO)
The biggest mistake marketers make right now is treating AI search as either a threat to SEO or a complete replacement for it. It’s neither. AI search is a new organic channel that works alongside Google, not instead of it.
The fundamentals that make content rank well in Google search (depth, accuracy, original insight, clear structure) are the same fundamentals that get content cited by AI engines. A strong SEO content strategy naturally positions you for AI visibility too.
But you need measurement in both channels to know what’s working. Use GSC for Google query data (incomplete as it is) and use AI search analytics for prompt-level visibility data across AI engines.
Audit your AI search blind spots the same way you’d audit GSC
If you checked your GSC data and found that 60% of your clicks go to hidden queries, you wouldn’t ignore the problem. You’d take steps to infer what those queries are and make sure your content covers them.
Apply the same thinking to AI search. Use the competitor intelligence features to see which brands AI engines recommend instead of yours. Check which prompts your competitors win on and where you’re absent.
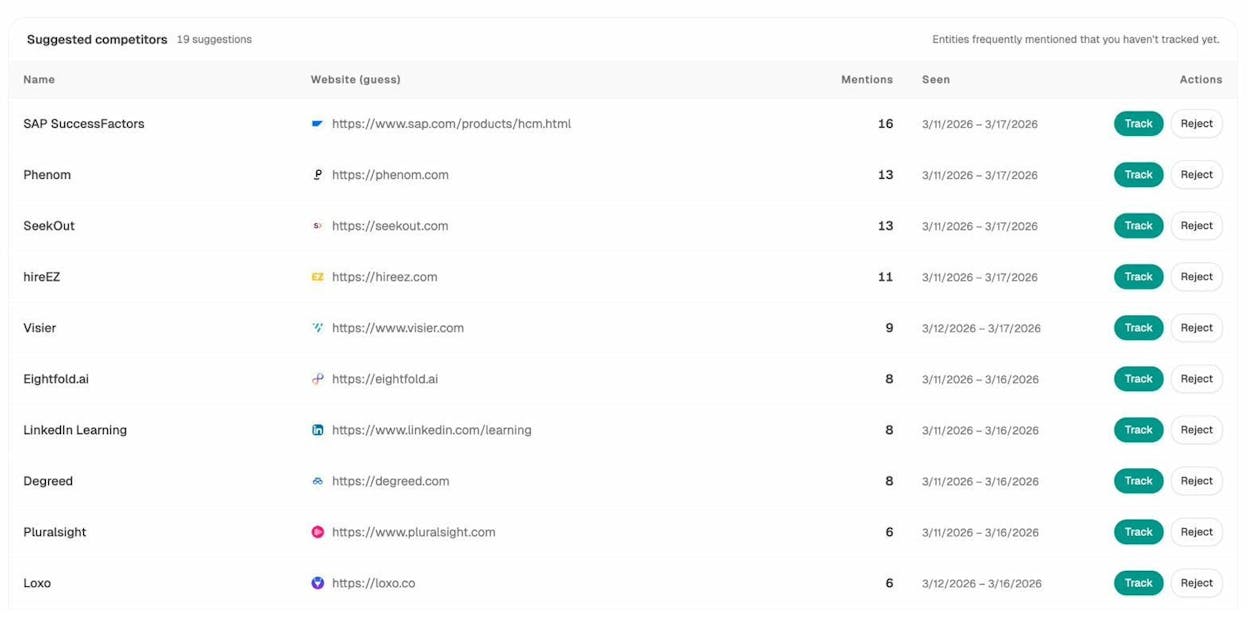
Then use that data to prioritize content improvements. If three competitors appear in AI answers for your core topics and you don’t, that’s a content gap worth closing.
Monitor both channels with the same rigor
Set up a weekly review rhythm where you check both your GSC data and your AI visibility data. Look for trends in both channels.
Analyze AI’s weekly email digests automate part of this. You’ll get a prioritized summary of citation changes, competitor shifts, and AI traffic trends delivered to your inbox every Monday. No dashboard login required.
The brands that win in the next two years will be the ones that treat their data gaps as solvable problems, not as reasons to give up on measurement. GSC gives you half the picture for Google search. AI search analytics gives you the picture for AI engines. Together, they get you closer to the full story than either one alone.
Key takeaways
Google Search Console hides the query data behind roughly 46% of all organic clicks. The exact percentage for your site depends on your traffic volume, the diversity of queries you attract, and the share of long-tail searches in your mix. You can measure your own gap using Looker Studio in under five minutes.
But GSC’s blind spot is just one part of a larger data problem. AI search traffic, which is growing across the majority of websites, arrives with zero query data by default. No prompt. No context. Just a referral from chatgpt.com or perplexity.ai.
The fix isn’t to abandon GSC or panic about AI search. The fix is to layer your data sources. Use GSC for the Google search data it does provide. Cross-reference with keyword research tools for what GSC hides. And use AI search analytics tools like Analyze AI to see the prompts, citations, and traffic that AI engines send your way.
You can start by checking your own hidden query percentage in Looker Studio. Then check whether your site is receiving AI traffic you’re not measuring. The answer to both questions will change how you think about your search data.
Ernest
Ibrahim


