


Summarize this blog post with:
In this article, you’ll get seven concrete marketing objective examples, the exact metrics and tools to measure each one, and a simple framework for choosing the right ones for your business in 2026, when buyers no longer rely on Google alone to find you.
Table of Contents
What are marketing objectives?
Marketing objectives are the specific, measurable outcomes you want your marketing to produce in a defined window. They sit between your business strategy and your tactical campaigns. Strategy tells you who you are competing for. Objectives tell you what winning looks like this year. Tactics are how you get there.
Good objectives focus the team on a small number of bets, give you a way to evaluate whether those bets are working, and make trade-offs explicit. If you cannot say “this is on track” or “it is not” by looking at a number, it is not an objective. It is a wish.
One thing to flag before the examples. The way buyers find you has changed. A growing share now starts research inside ChatGPT, Perplexity, Google AI Mode, or Claude. That shift does not kill any objective below, but it changes how you measure a few, so we cover both methods for each.
Seven marketing objective examples and how to measure them
1. Increase share of voice (SOV)
Example objective: Increase organic share of voice from 11% to 16% across our top 200 tracked keywords by Q4 2026.
Share of voice is how visible your brand is in the market relative to competitors. It started as an advertising metric (your ad spend as a percentage of total category spend), but the definition has stretched to cover any channel where attention is fought over, including search, social, podcasts, and now AI answers.
SOV matters because it is one of the few leading indicators of market share growth. Once your SOV outpaces your market share, you build excess share of voice, and market share follows over time.
Break it down by the channels that matter most to your buyer:
Increase organic search visibility in the U.S. from 6% to 8% by Q4 2026.
Increase AI search visibility on ChatGPT and Perplexity from 22% to 35% across our top 50 buyer-intent prompts by Q4 2026.
How to measure it on search
Track your primary keyword set in a rank tracker, add your direct competitors, and pull the SOV view. The percentage represents the share of total available clicks across that keyword set going to your domain.
![[Screenshot: Ahrefs Rank Tracker Competitors overview tab showing SOV percentages for tracked keywords with competitor domains compared.]](https://www.datocms-assets.com/164164/1777807893-blobid1.jpg?auto=format,compress&w=1248&fit=max)
You can spot-check rankings on individual terms with our keyword rank checker, and pull a fresh SERP snapshot using the SERP checker.
How to measure it in AI search
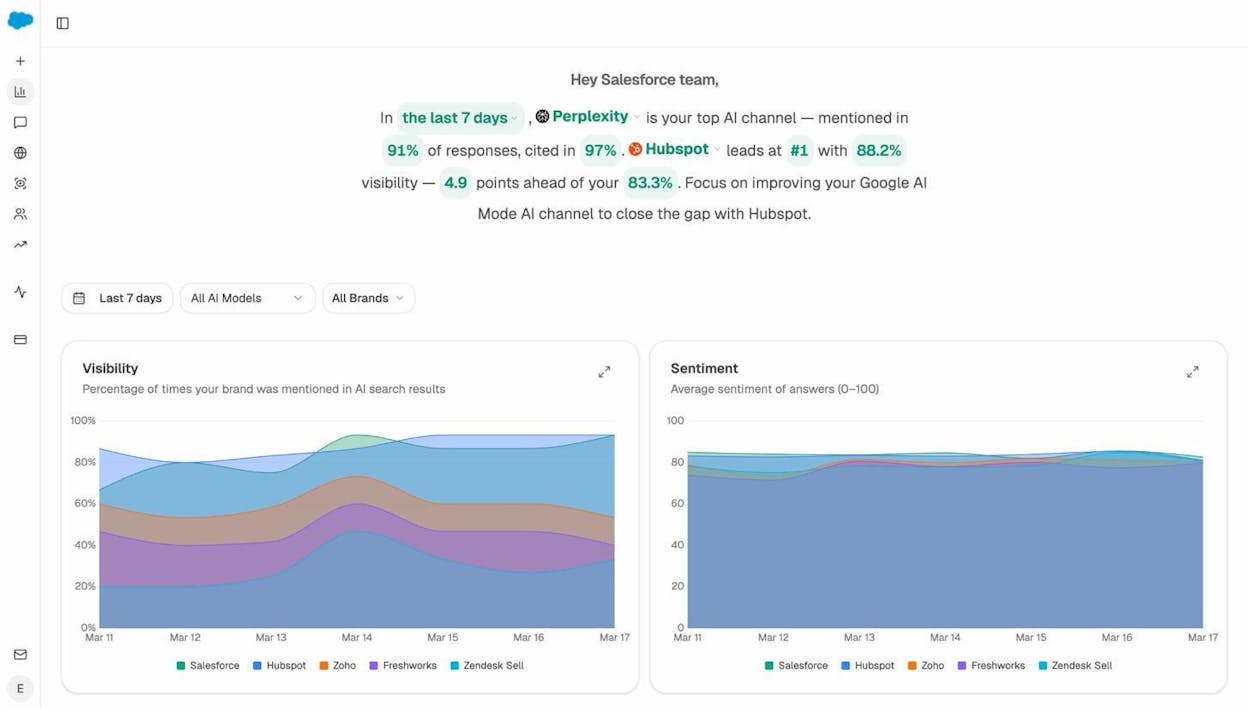
Traditional SOV captures rank in a list of blue links. AI search SOV captures something different. It measures the percentage of AI answers that mention your brand at all. If a buyer asks ChatGPT “what are the best [your category] tools” and your name is not in the response, you have zero SOV on that prompt no matter where you rank in Google.
Analyze AI’s AI Visibility Tracking measures this directly. You add the prompts your buyers actually use, then watch your visibility, sentiment, and competitor mentions across ChatGPT, Perplexity, Gemini, Claude, Copilot, and Google AI Mode.
|
What you measure |
Traditional SOV (search) |
AI search SOV |
|---|---|---|
|
Unit |
Click share across tracked keywords |
Mention share across tracked prompts |
|
Source |
SERP scrapes |
LLM responses sampled at intervals |
|
What “winning” looks like |
Higher position, more clicks |
Mentioned by name, near the top of the answer |
|
What you optimize |
Page rank, snippet, CTR |
Source authority, brand mentions, content clarity |
Track both. They move together more often than not, but the prompts where they diverge are where your biggest opportunities live.
2. Increase brand awareness
Example objective: Increase unaided brand awareness among the total addressable market of B2B marketers from 31% to 38% by the end of 2026.
Brand awareness is how familiar your audience is with your brand. The brand recalled first wins disproportionately because most buyers consider only a handful of options when they enter a buying cycle. Four metrics worth knowing:
-
Aided awareness: the percentage of respondents who recognize your brand when shown the name.
-
Unaided awareness (brand recall): the percentage who name your brand without any prompt when asked about your category.
-
Top-of-mind awareness: the percentage who name your brand first.
-
Brand recognition: the percentage who recognize your brand from a logo or visual asset.
How to measure it
Real awareness numbers come from market research surveys with representative samples. You either run them in-house with a tool like Pollfish or hire an agency. SOV is a useful proxy in between survey waves.
For a fast, cheap proxy that did not exist three years ago, ask the AI directly. If you fire 50 buyer-intent prompts at ChatGPT and your brand shows up in 4 of them, you have a measurable awareness gap.
Analyze AI’s ad hoc prompt searches let you do this. Type a prompt, pick a country, and see whether AI models mention you, your competitors, or neither.
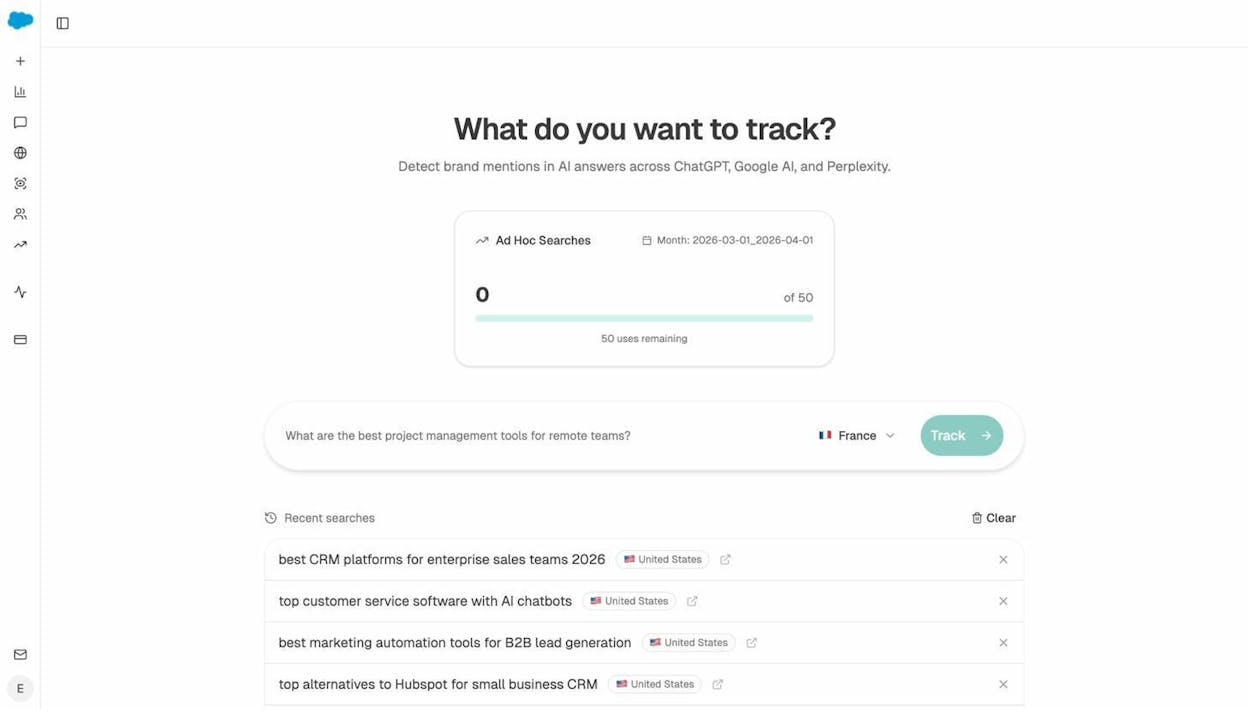
Run a batch of 30 to 50 prompts that mirror how buyers phrase their research questions, then count the percentage that include your brand. That number is not a substitute for unaided survey recall, but it is a sharp directional indicator that updates daily instead of quarterly.
3. Improve brand perception
Example objective: Increase the percentage of surveyed buyers who associate our brand with “easiest to implement” from 44% to 51% by Q4 2026.
Awareness tells you whether buyers know you. Perception tells you what they think when they do. If you want to be known as the most reliable, the most innovative, or the easiest to use, you need a way to measure whether that positioning is landing. This is where most strategies quietly fail. A team spends months crafting a positioning statement, then never checks whether the market has internalized it.
How to measure it
Same playbook as awareness: surveys, ideally twice a year so you can spot drift. Supplement with sentiment monitoring on social and review sites using a tool like Brandwatch. Sentiment data is noisier than surveys but gives you a daily pulse instead of a quarterly snapshot.
AI search adds a new perception surface. When ChatGPT describes your brand, what adjectives does it use? Are you positioned as the premium option, the simple option, the legacy option?
Analyze AI’s Perception Map plots your brand and competitors on two axes, how visible you are in AI answers, and how strong the narrative around you is.
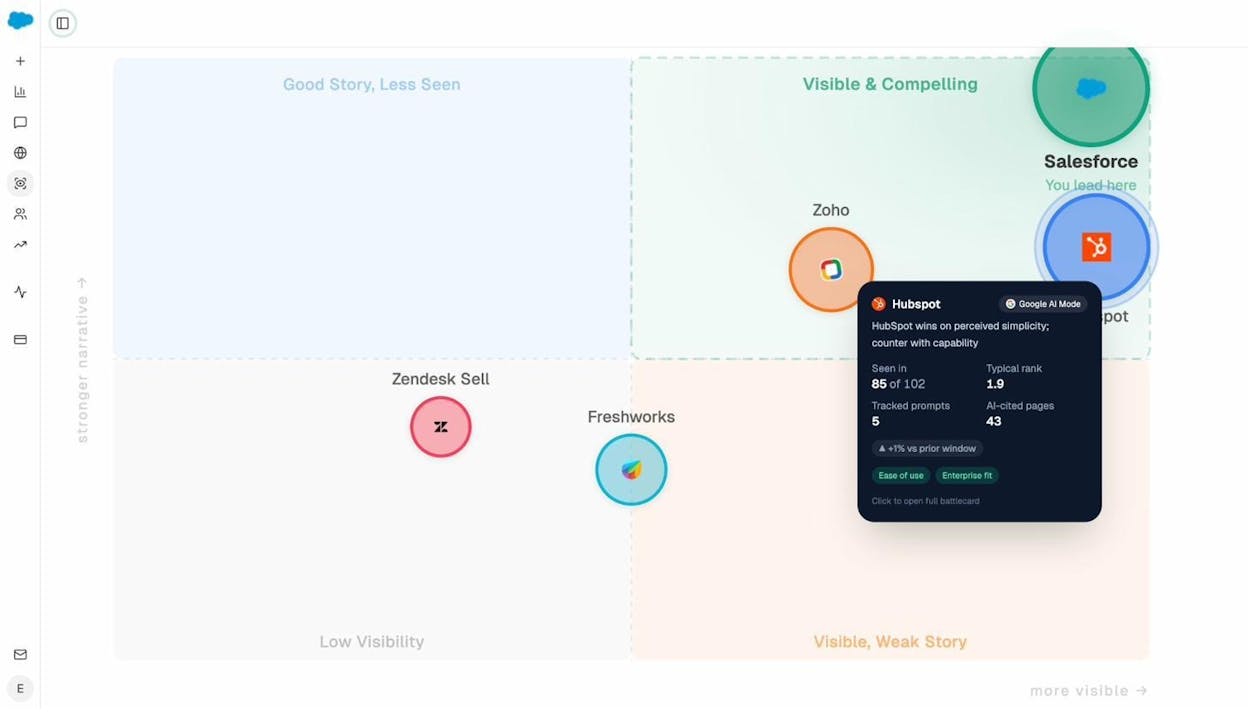
The quadrant tells you what to fix:
-
Visible and compelling: AI sees you and tells a good story. Defend it.
-
Good story, less seen: positioning works but you need more reach. Fix distribution and source authority.
-
Visible, weak story: you show up but the description undersells you. Fix the messaging on the pages AI is citing.
-
Low visibility: you are barely in the conversation. Start with the awareness work in objective #2.
AI Sentiment Monitoring layers on top with a 0–100 sentiment score per prompt, so you can see not just where you are described, but how positively.
4. Boost sales growth
Example objective: Grow annual recurring revenue from $104M to $120M by Q4 2026.
This is the first objective tied directly to revenue, and for many teams it is the only one leadership cares about. The risk is that revenue is a lagging indicator. By the time it moves, the underlying problem has been brewing for quarters. Pair it with one or two brand-side objectives so you do not optimize the short term at the cost of the long term.
You can scope it tightly to a product, segment, or region:
Grow self-serve ARR among teams of 10 to 50 employees from $12M to $18M by end of 2026.
How to measure it
Pull from your CRM or billing system. Do not rely on Google Analytics conversion data, because the attribution will be incomplete and the numbers will not match your finance team’s source of truth.
What AI search adds is attribution clarity for a channel that used to be invisible. Buyers arriving from ChatGPT or Perplexity show up as direct traffic or under a confusing referrer string, so it is hard to credit AI search for the revenue it drives.
AI Traffic Analytics breaks this open by isolating sessions that originated from AI search engines and surfacing the conversions tied to them.
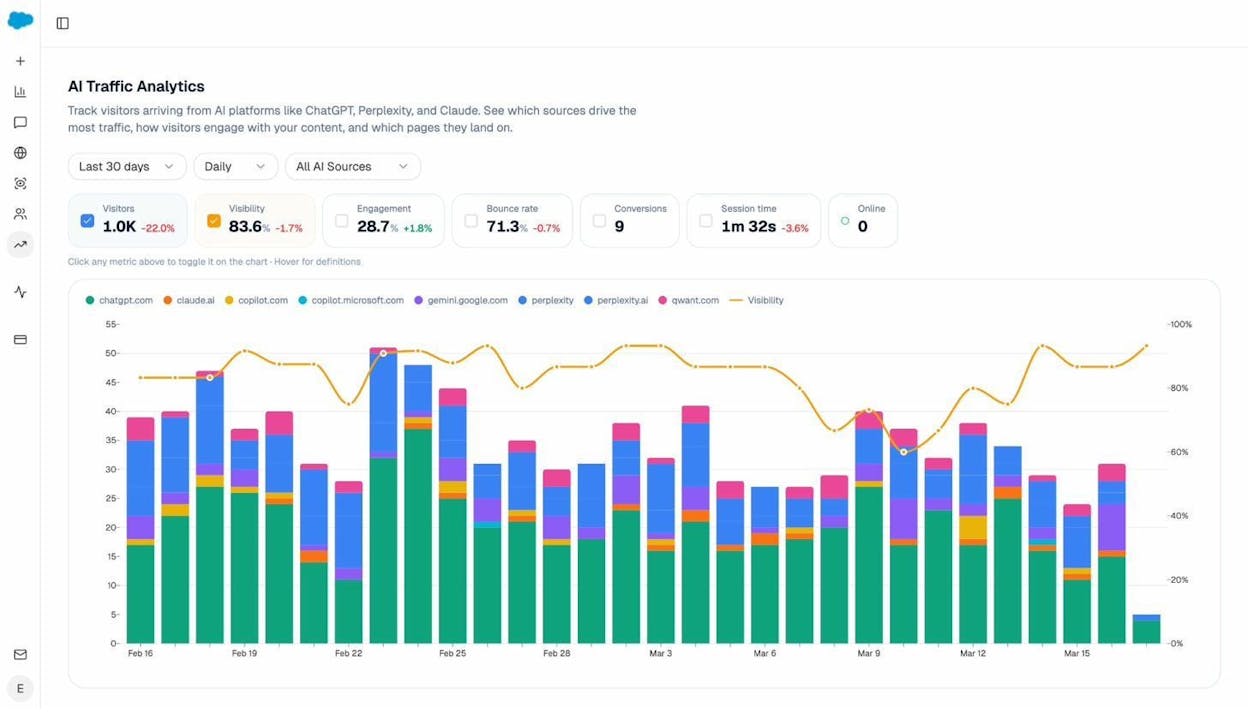
Once you can see AI-referred conversions next to the rest of your channels, you can finally answer the leadership question “what is AI search actually worth to us in dollars.”
5. Acquire more users or customers
Example objective: Grow monthly active users of our free tier from 750,000 to 1.2M by end of 2026.
User acquisition is its own goal because it does not always correlate cleanly with short-term revenue. A growing user base creates word-of-mouth, network effects, and a larger pool to convert into paid customers later. It fits when your business model depends on volume (freemium SaaS, marketplaces, ad-supported media). The best version of this objective specifies the type of user, not just the count.
How to measure it
Pull active user counts from your product analytics or CRM. The metric that matters depends on your product (DAU, WAU, MAU, signups, qualified signups). Define it carefully and stick with it.
For AI search, the question is which pages bring in users from AI answers, and how those users behave once they land. The Landing Pages view inside AI Traffic Analytics shows you exactly that.
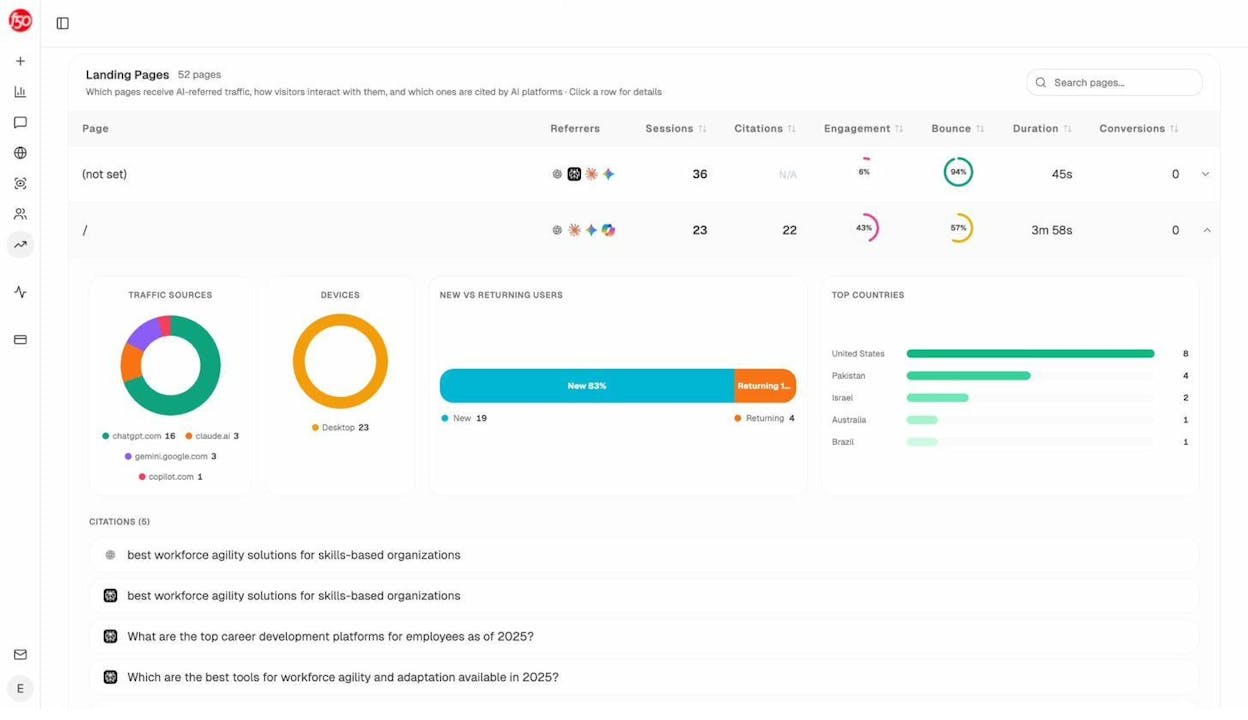
Click into any page to see which AI sources cite it, which prompts triggered the citation, and how the resulting visitors engage. The pattern usually tells a clear story. A small number of pages drive most of your AI-referred sign-ups. Once you find them, double down. Update them more often, expand the cluster around them, and replicate the structure on adjacent topics.
For more on what gets a page cited, see how to rank on ChatGPT and how to rank on Perplexity.
6. Generate more marketing qualified leads (MQLs)
Example objective: Grow MQLs from 5,676 in 2025 to 7,500 in 2026, with no decline in MQL-to-SQL conversion rate.
A marketing qualified lead is a contact who has shown enough interest to be worth a sales conversation. The threshold is yours to define. It might be a demo request, a high-intent content download, a free trial signup, or a lead-scoring threshold based on behavior. This objective fits any business where a sales team takes leads from marketing and converts them.
How to measure it
Set up lead scoring inside your CRM and track MQLs by source. The inputs that matter most are firmographic match to your ICP, behavioral signals (pages visited, demos watched, pricing page hits), intent data, and anything captured in forms or by sales reps. Most modern CRMs (HubSpot, Salesforce) have lead scoring built in, but the model is only as good as the inputs.
The AI search wrinkle is that MQLs from AI tend to convert at a higher rate than from other sources, because the AI has effectively pre-qualified the buyer. By the time someone arrives on your pricing page from a ChatGPT recommendation, they have already seen a comparison and self-selected toward you.
To find which prompts drive high-intent MQLs, use Prompt Tracking to monitor buying-intent queries in your category (“best [tool] for [use case],” “[competitor] alternative,” “[category] pricing”), then cross-reference against the conversions in AI Traffic Analytics. Prompts that show up in both views are your highest-leverage queries.
7. Increase customer lifetime value (CLV)
Example objective: Grow CLV among enterprise customers from $44,500 to $55,000 by end of 2026.
Customer lifetime value is the total revenue you expect from a single customer across the relationship. Every dollar you add to CLV gives you a dollar more to spend on acquisition without hurting unit economics. The basic formula:
CLV = Average Order Value × Average Annual Purchase Frequency × Average Customer Lifespan
If your AOV is $100, customers buy four times a year, and they stay for three years, your CLV is $1,200. To improve it, you can move any of the three inputs.
How to measure it
Pull the inputs from your billing system and customer success platform. Segment by plan, cohort, and acquisition channel so you can see which segments have the highest CLV and double down on acquiring more of them.
The marketing-side levers that improve CLV are mostly about brand strength and post-sale experience. Stronger brand perception drives lower churn and higher willingness to pay, which is why brand-building investment shows up in CLV trends six to twelve months later.
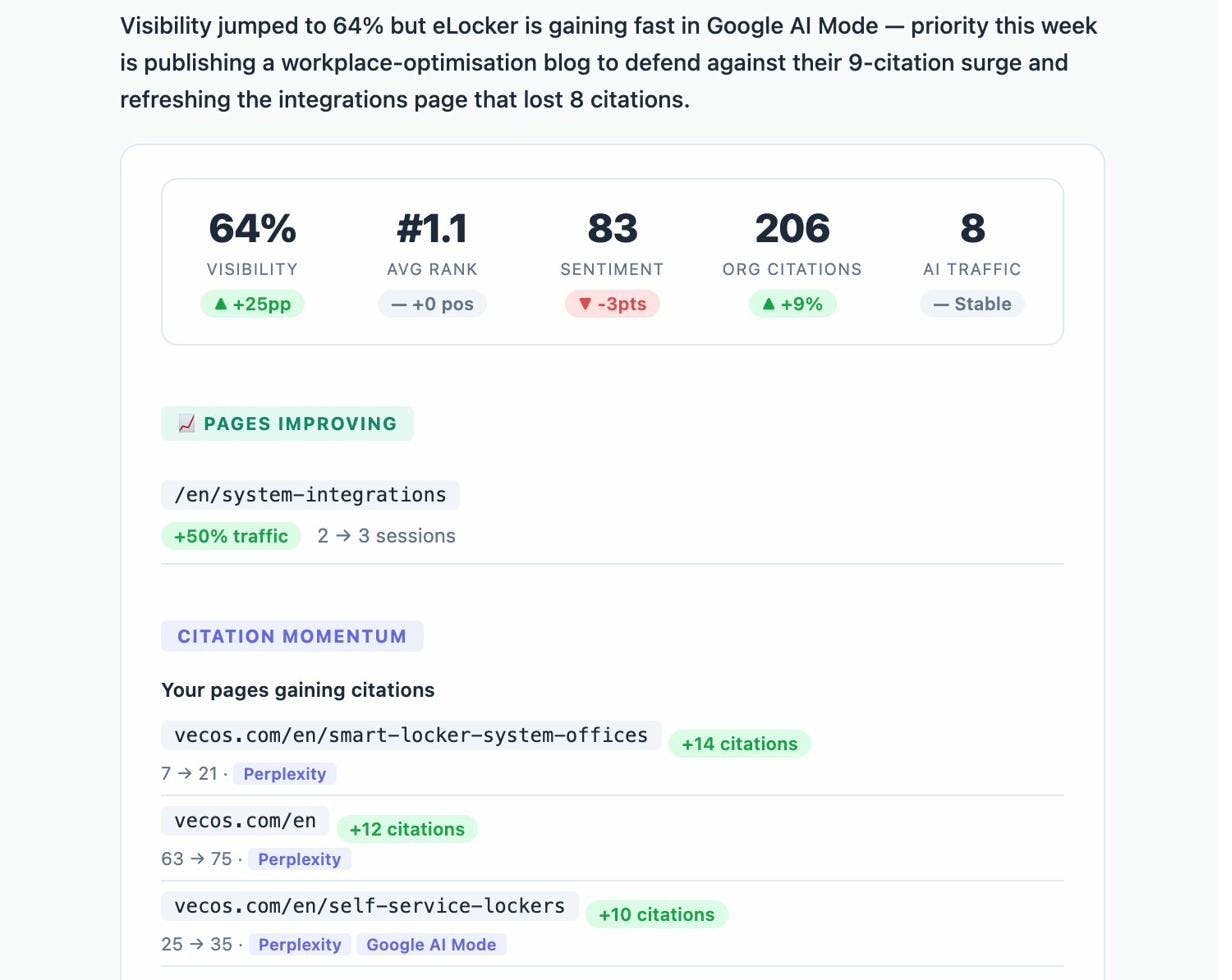
The Weekly Email Digests summarize the week’s movement in visibility, sentiment, citations, and AI-referred traffic in a single email, so you can spot a perception drift before it shows up in churn data.
How to set great marketing objectives for your business
You now have seven examples to draw from. Here is how to turn them into your own objectives without ending up with a bloated plan no one can execute.
Start from your most important marketing need
Strong objectives come from honest diagnosis. If only 3% of your target market knows your brand exists, an objective to lift conversion rate by 10% is solving the wrong problem. The fastest way to find your real bottleneck is to walk through your funnel and locate the biggest drop-off.
![[Screenshot: A simple marketing funnel diagram with the stages Awareness, Interest, Consideration, Conversion, and Retention stacked vertically.]](https://www.datocms-assets.com/164164/1777807941-blobid8.png?auto=format,compress&w=1248&fit=max)
Each stage has its own KPIs:
-
Awareness: SOV, brand recall, AI search visibility, branded search volume.
-
Interest: Email subscribers, returning visitors, time on site.
-
Consideration: Demo requests, comparison page visits, branded comparison searches.
-
Conversion: Conversion rate, MQLs, deal velocity, AOV.
-
Retention: Net revenue retention, NPS, churn rate, expansion ARR.
The stage with the worst conversion to the next, relative to your category benchmark, is the one your objectives should attack first.
Make every objective SMART
You may have noticed every example above follows the SMART format. SMART stands for Specific, Measurable, Achievable, Relevant, Time-bound.
|
Element |
Weak version |
SMART version |
|---|---|---|
|
Specific |
“Grow brand awareness.” |
“Grow unaided awareness among CMOs at 200–1,000 employee companies.” |
|
Measurable |
“Be more visible in AI search.” |
“Lift mention share on our top 50 buyer-intent prompts from 22% to 35%.” |
|
Achievable |
“10x revenue.” |
“Grow ARR from $104M to $120M (15%, in line with the last two years).” |
|
Time-bound |
“Improve sentiment.” |
“Improve average AI search sentiment from 72 to 80 by Q4 2026.” |
If your objective is missing any of the five, sharpen it before it goes in the plan.
Pick one or two strategic objectives, not seven
Strategy is choosing what not to do. Effies awards data has shown for years that campaigns with a single, focused objective outperform those with a long list. Spreading effort across seven objectives means none of them gets the resources to actually move.
Pick one or two strategic objectives at the company level, then let each marketing function build tactical objectives that ladder into them.
A useful balancing rule comes from Les Binet and Peter Field. The optimal split between brand-building and short-term sales activation is roughly 60/40. Most teams under-invest in the brand side because it is harder to measure, but cutting it weakens long-term growth. So when you pick your one or two objectives, balance one short-term (sales growth, MQLs, CLV) with one long-term (SOV, brand awareness, perception).
Account for both SEO and AI search as channels
This is the addition most marketing-objective frameworks have not caught up with yet. AI search is no longer a side experiment, but that does not mean SEO is dead. The two channels reinforce each other: pages that rank well on Google tend to also get cited in AI answers, and brands with strong AI search presence build branded search volume that feeds back into SEO. Our breakdown of GEO vs SEO goes deeper.
The simple fix is to add a parallel AI search KPI to any objective that touches a digital channel. SOV becomes SOV (search) and SOV (AI search). MQLs become MQLs (all sources) and MQLs (AI-referred). Sales growth gets an AI-attributed revenue line. None of this requires a separate plan. It just makes the plan honest about where your buyers actually are.
Final thoughts
Setting marketing objectives well is mostly about resisting the urge to set too many. One or two strategic objectives, broken into tactical KPIs by channel, will outperform seven competing priorities almost every time. Take the one or two that fix your real bottleneck, frame them with SMART criteria, and track them across both traditional search and AI search.
Once your objectives are set, the next step is execution. Our free toolkit can help you start measuring today: pull a competitor traffic snapshot with the website traffic checker, audit your domain authority with the website authority checker, and find high-intent keywords with the keyword generator. For full AI search visibility tracking, perception monitoring, and AI-attributed traffic analytics, Analyze AI is built for exactly this.
Ernest
Ibrahim


