


Summarize this blog post with:
In this article, you’ll learn two ways to build a content map. The first is the traditional persona-and-funnel approach you have probably seen before. The second is the way we map content at Analyze AI, which adds two layers most maps miss, organic search potential and AI search visibility. By the end, you’ll have a workable template, a working framework, and a clear view of where your next ten articles should come from.
Table of Contents
What is a content map?
A content map is a single document that lists every piece of content you have, and every piece you plan to make, against the people you write for and the moments they meet your brand.
![[Screenshot: a simple traditional content map laid out as a grid, with buyer personas as rows and funnel stages as columns, populated with article titles in each cell]](https://www.datocms-assets.com/164164/1777676071-blobid1.png?auto=format,compress&w=1248&fit=max)
In its most common form, the rows are buyer personas, the columns are stages of the buyer’s journey, and every cell holds a piece of content built for that combination. That is the traditional view. We will come back to a more useful version later.
Why create a content map
A content map makes your content do work for your business instead of accumulating posts that go nowhere. Three things fall out of the exercise.
You spot the gaps. Most teams discover they have ten awareness posts and almost nothing for prospects who are actively comparing solutions.
You see the duplicates. The four “what is X” articles you wrote across two years tend to surface, and you can decide whether to merge, refresh, or kill them.
You find the leverage. A content map is also an inventory, and an inventory is the starting point for content refreshing, repurposing, and internal linking.
How to create a traditional content map
Three steps, none of them complicated.
Step 1: Build buyer personas
A buyer persona is a short profile of one type of customer you serve. A useful persona names the role, the goals, the pain points, the tools they use, and one or two phrases they say about the problem.
![[Screenshot: an example buyer persona card with sections for role, goals, challenges, current tools, and quotes]](https://www.datocms-assets.com/164164/1777676080-blobid3.png?auto=format,compress&w=1248&fit=max)
The accurate way is to talk to ten current customers for thirty minutes each and write down the patterns. If you cannot get the calls, use sales call recordings, support tickets, and review sites like G2. The phrases customers use will become the keywords your content targets.
The faster way is to draft personas from secondary research and validate them as customer interviews trickle in. Industry reports, competitor case studies, and Reddit threads all work. Whatever you do, do not invent personas in a vacuum. Most B2B companies need two to four. Anything more and the map becomes a project nobody finishes.
Step 2: Map your existing content to each persona’s journey
Take every piece of content you have published in the last two years and drop it into a four-column grid. The columns represent stages of the buyer’s journey. You can pull our Google Sheets template here to skip the setup.
The four columns:
-
Awareness. The reader knows they have a problem but has not searched for solutions yet. Educational content lives here.
-
Interest and desire. The reader is comparing approaches. Frameworks and how-to guides live here.
-
Consideration. The reader is comparing specific products, including yours. Comparison pages, case studies, and feature deep-dives live here.
-
Retention and advocacy. The reader is already a customer. Tutorials, advanced playbooks, and product update posts live here.
If a piece of content fits multiple stages, pick the dominant one. If it fits nowhere, rewrite it with a clearer purpose or note it for a future content audit.
Step 3: Find gaps and fill them with new content ideas
After Step 2, the empty cells in your grid are your content backlog. Four sources will give you more ideas than you can write in a year.
Do keyword research
Keyword research tells you what your audience actually types into search. Start with one seed keyword that describes your category, then expand outward. Two free routes work for almost everyone.
The first is Google itself. Type your seed into the search bar and watch the autocomplete suggestions populate. Scroll down the SERP and read the “People also ask” box and the “Related searches” footer. Both are pulled directly from real query data.
![[Screenshot: Google search bar showing autocomplete suggestions for the seed keyword “content map”]](https://www.datocms-assets.com/164164/1777676083-blobid4.png?auto=format,compress&w=1248&fit=max)
![[Screenshot: a Google SERP scrolled down to show the “People also ask” box for “content map” with four expanded questions]](https://www.datocms-assets.com/164164/1777676085-blobid5.png?auto=format,compress&w=1248&fit=max)
The second route is the Analyze AI Keyword Generator and Keyword Difficulty Checker. Drop in your seed keyword and you’ll get hundreds of related terms with volume estimates and a difficulty score. The Keyword Rank Checker tells you which terms you are already winning and which you are leaving on the table.
For paid tools, Ahrefs Keywords Explorer and the equivalents from Semrush and Moz do the same job at a deeper level. The Matching terms report is the report to live in.
![[Screenshot: Ahrefs Keywords Explorer Matching terms report for the seed “content marketing”, with filters set to KD under 30 and TP over 200]](https://www.datocms-assets.com/164164/1777676088-blobid6.png?auto=format,compress&w=1248&fit=max)
This gets you to a long list. Use one rule to cut it down. Would the article rank, and would the readers eventually become customers? Both have to be yes. There is more on this in our SEO content strategy guide and our piece on keyword clustering.
Analyze your competitors
The fastest way to find topics worth covering is to look at what your competitors are already winning on, then decide which of those topics belong on your map. For traditional search, the workflow is two reports.
First, find your real competitors. The companies you compete with for funding are not always the ones you compete with on the SERP. Plug your domain into Site Explorer (or the equivalent) and look at the Competing Domains report.
![[Screenshot: Competing Domains report showing five top competitors ranked by overlapping keywords]](https://www.datocms-assets.com/164164/1777676090-blobid7.jpg?auto=format,compress&w=1248&fit=max)
Second, run a content gap report against the top three to five competitors. This shows the keywords they rank for and you do not. Filter out branded terms and you have a clean list of opportunities.
![[Screenshot: Content Gap report results with three competitor domains entered, branded keywords filtered out]](https://www.datocms-assets.com/164164/1777676094-blobid8.png?auto=format,compress&w=1248&fit=max)
Our walkthrough on this is in SEO Competitor Analysis. You can run a quick first pass with our free Website Authority Checker and Website Traffic Checker.
For AI search, the same logic applies but the data lives somewhere else. Open Analyze AI’s Competitor Intelligence. It surfaces the brands AI models mention alongside (or instead of) yours when answering questions in your category.
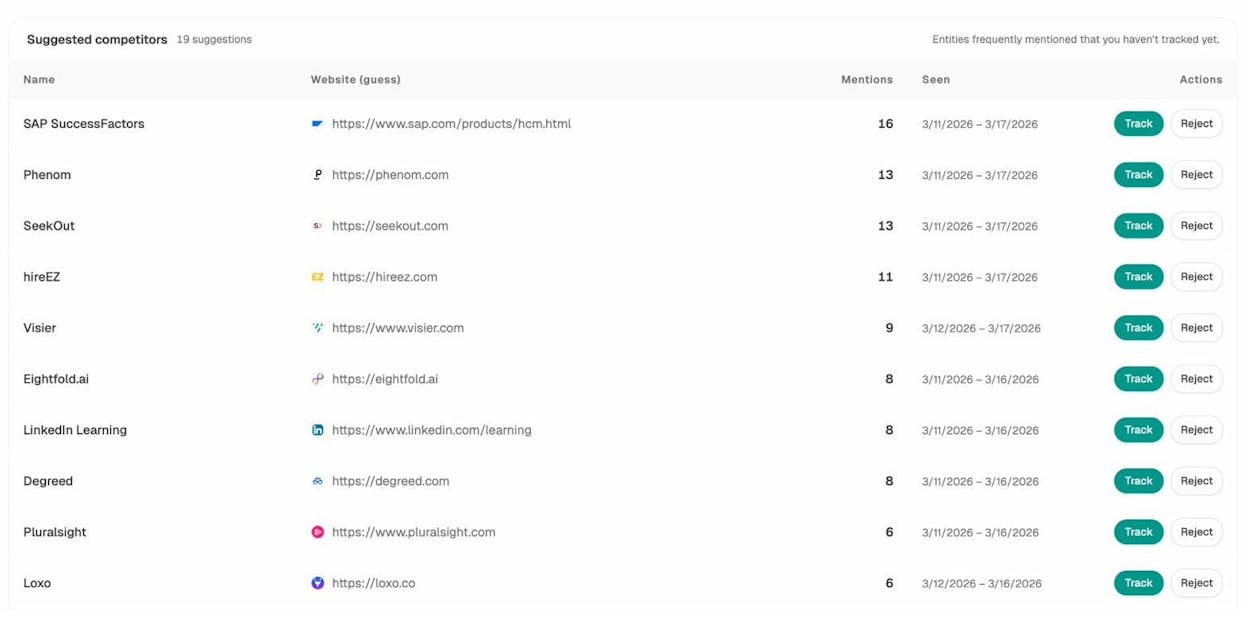
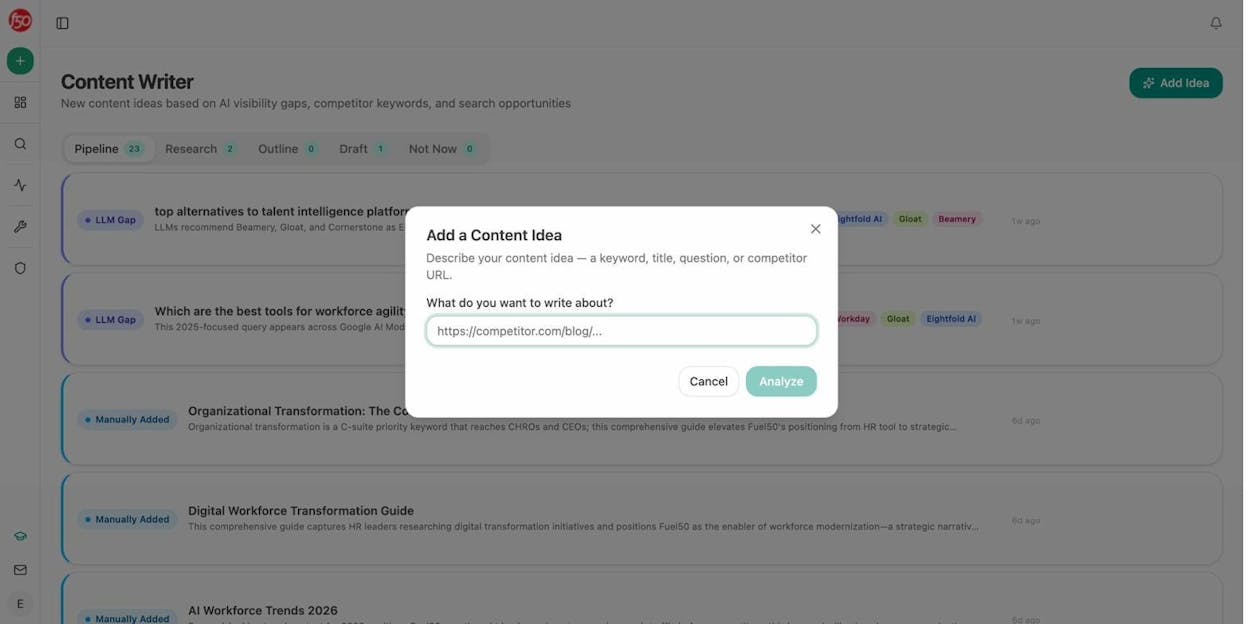
Each brand here is a clue about a topic gap. If a competitor gets cited for a question about “skills-based agility” and you are not, that is a content map entry waiting to happen.
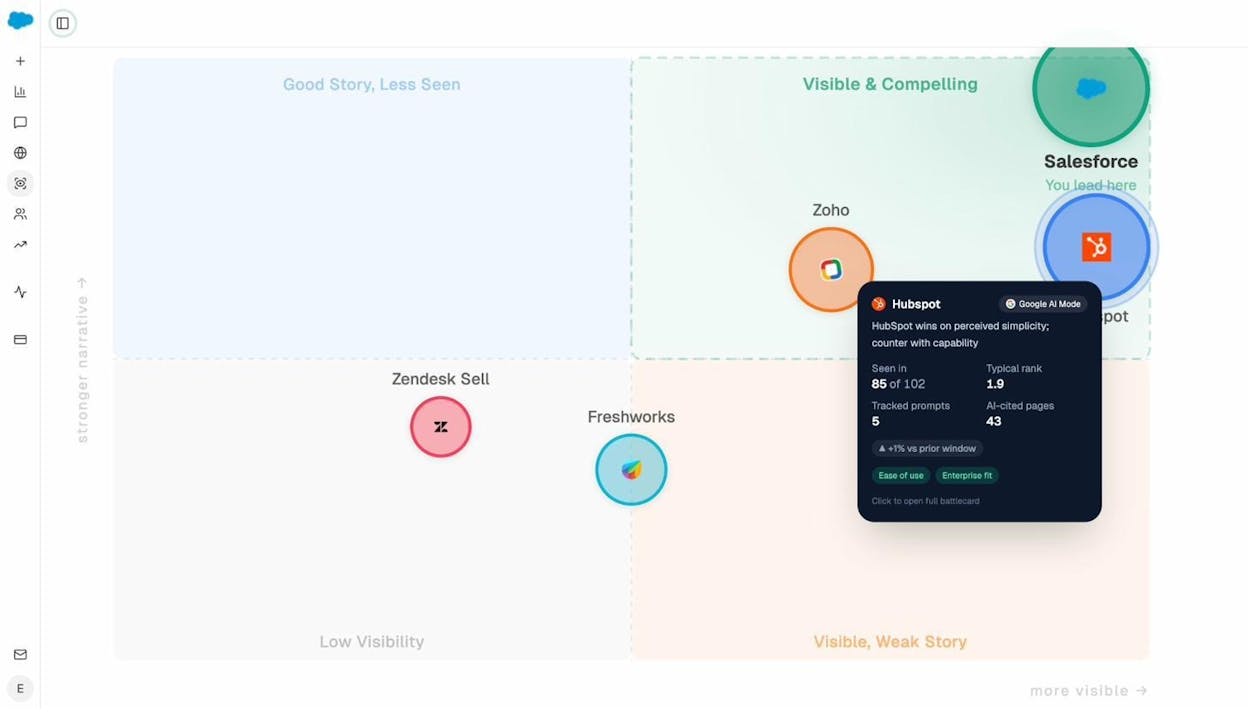
The Perception Map takes this further by plotting competitors on two axes, how often they show up in AI answers and how strong their narrative is when they do. “Good Story, Less Seen” is where attackers come from. “Visible & Compelling” is where the threats live.
Listen to your niche
Search data shows you what people ask when they already know what to ask. Communities show you what they say when they don’t. Spend fifteen minutes a week on the largest subreddit in your category, two LinkedIn groups your buyers belong to, and the comment sections of your competitors’ top posts. Write down every problem, every workaround, and every phrase that repeats.
A more systematic version uses SparkToro to surface the podcasts, hashtags, and accounts your audience already follows. Some of the strongest topics come from this work, not from keyword tools, because the topic is too new to have search volume yet.
Survey your audience
The fourth source is to ask. If you have a newsletter, send a four-question survey twice a year. If you don’t, run an exit-intent survey on your highest-traffic page. Four questions that have worked for us:
-
What is the biggest problem in your job right now?
-
Where do you go when you need to learn about [your category]?
-
What is one thing you wish [your category] writers would stop doing?
-
What guide would you want to read that does not exist yet?
Question four maps directly to articles. Question three saves you from writing a piece nobody wants to read.
Example of a traditional content map
Here is what the finished traditional map looks like for a single persona. The persona is “Sara, head of content at a Series B SaaS company”.
|
Awareness |
Interest and desire |
Consideration |
Retention and advocacy |
|---|---|---|---|
|
What Is a Content Map |
How to Build a Topical Map |
Analyze AI vs Other Content Tools |
How We Use Analyze AI to Spot Declining Pages |
|
10 Content Strategy Mistakes |
The Pain Point SEO Framework |
Case Study: B2B SaaS, +120% Traffic in 6 Months |
Refreshing 50 Posts a Quarter |
|
Why Most B2B Blogs Fail |
Building a Content Brief Template |
Pricing for Mid-Market Content Teams |
Monthly Product Updates Digest |
That works. It is also incomplete, because it forces every article into one cell, and the strongest articles work across multiple cells at once.
The Analyze AI way: business potential, organic traffic, and AI search visibility
The persona-and-funnel grid is a planning tool, not a prioritisation tool. Two articles in the same cell can have wildly different value to the business, and the grid does not show you that. So we map differently. Each topic gets three scores instead of one position.
Why one-to-one matching breaks
Most articles serve more than one cell. A guide on “how to rank on ChatGPT” is read by complete beginners (awareness), by SEOs evaluating tools (consideration), and by existing customers refining their workflow (retention), all at the same time. Forcing it into one cell hides what the article is actually doing. We score each topic on three axes and let the cells fall out of the data.
Score 1: Business potential
Business potential measures how naturally your product fits into the article. The scale is zero to three.
|
Score |
Meaning |
Example topic |
|---|---|---|
|
3 |
Your product is the obvious answer |
How to track brand mentions in ChatGPT |
|
2 |
Your product is one of several solutions |
How to do an SEO competitor analysis |
|
1 |
Your product touches the topic but is not central |
Building a content brief template |
|
0 |
The topic is relevant to your audience but your product cannot help |
Marketing leadership lessons from B2B founders |
A healthy portfolio is mostly 2s and 3s, with a smaller layer of 1s and 0s for brand and link-building. If every article is a zero, you have a magazine. If every article is a three, you are writing brochures.
Score 2: Organic traffic potential
The realistic monthly traffic the topic could earn you on Google, given your domain authority and the SERP competition. The free Analyze AI SERP Checker gives you a rough read in seconds. This score keeps you honest. A topic with a business potential of three but a traffic potential of zero is still worth writing if it converts ten readers a month into demos. You should know that going in.
Score 3: AI search visibility potential
This is the layer most maps miss. AI search visibility potential is your estimated chance of being cited in AI answers when someone asks the underlying question in ChatGPT, Perplexity, Gemini, or Google’s AI Mode. Score it on two inputs. Do AI engines currently answer this question (most informational queries get an AI answer now)? Does your existing content have a credible chance of being cited? Same zero-to-three scale.
What the Analyze AI content map looks like
When you put the three scores together, you get a map that doubles as a backlog. Sort by total score and you have your next quarter planned.
|
Topic |
Business potential |
Organic traffic potential |
AI search visibility potential |
|---|---|---|---|
|
How to rank on ChatGPT |
3 |
800 |
3 |
|
Content map (this article) |
3 |
1,200 |
2 |
|
25 marketing podcasts to follow |
0 |
400 |
0 |
|
Generative engine optimization tools |
3 |
600 |
3 |
|
Marketing leadership lessons |
0 |
300 |
0 |
We still use buyer personas, but as a voice and depth check, not as a sorting axis. Personas tell us how to write. Scores tell us what to write.
How to map content for AI search
The AI search column is the one most teams have no data for. Here is the workflow we use to fill it in.
Find the prompts you should be appearing for
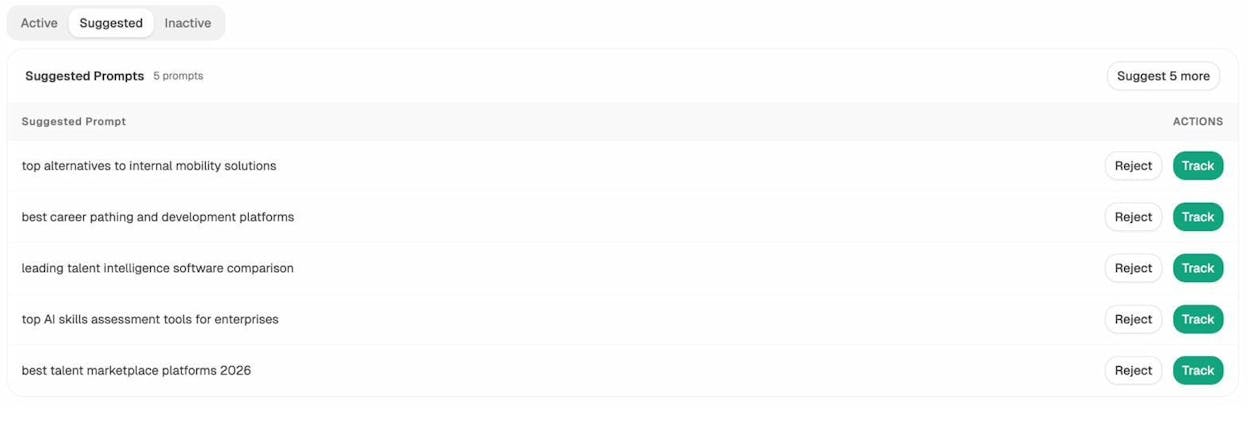
Before you can map content to AI search, you need a list of the prompts your buyers actually run. Brainstorm a first batch by sitting your sales and support teams in a room for thirty minutes and listing every question prospects ask. Then let Analyze AI suggest the rest. The Prompt Discovery feature scans your category and proposes prompts buyers in your space are running today.
You can run any prompt as a one-off check using Ad Hoc Prompt Searches before committing to track it.
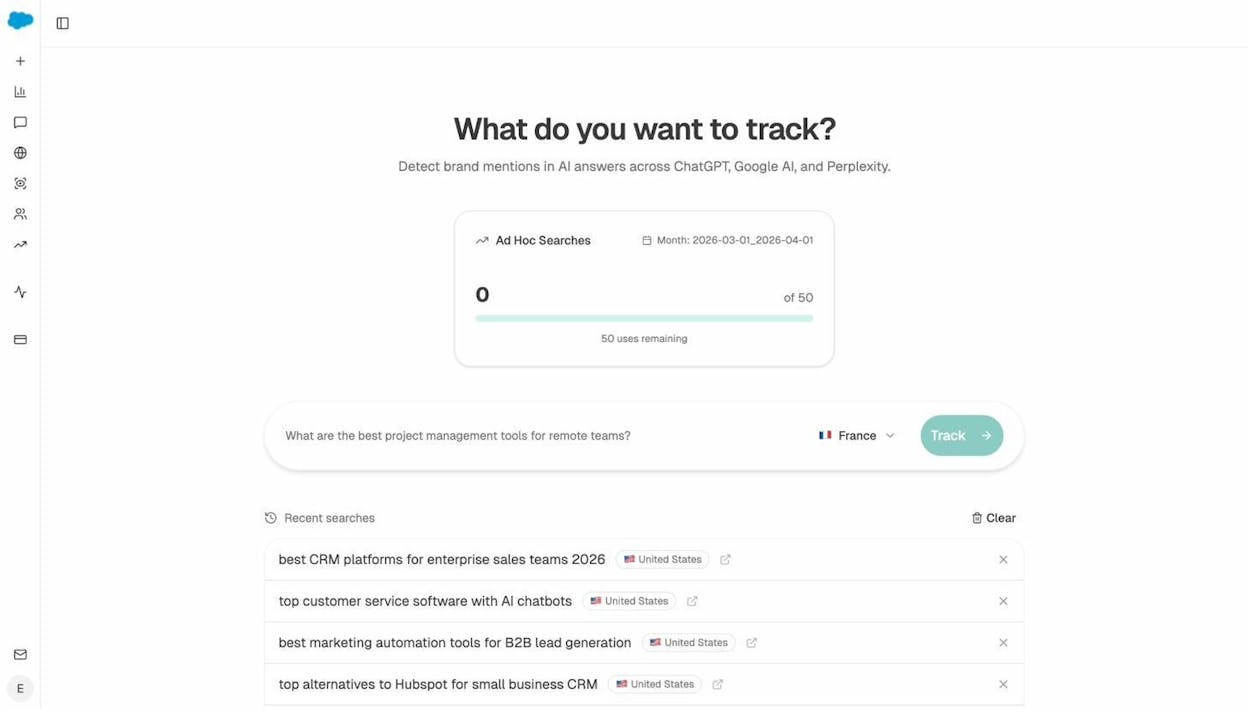
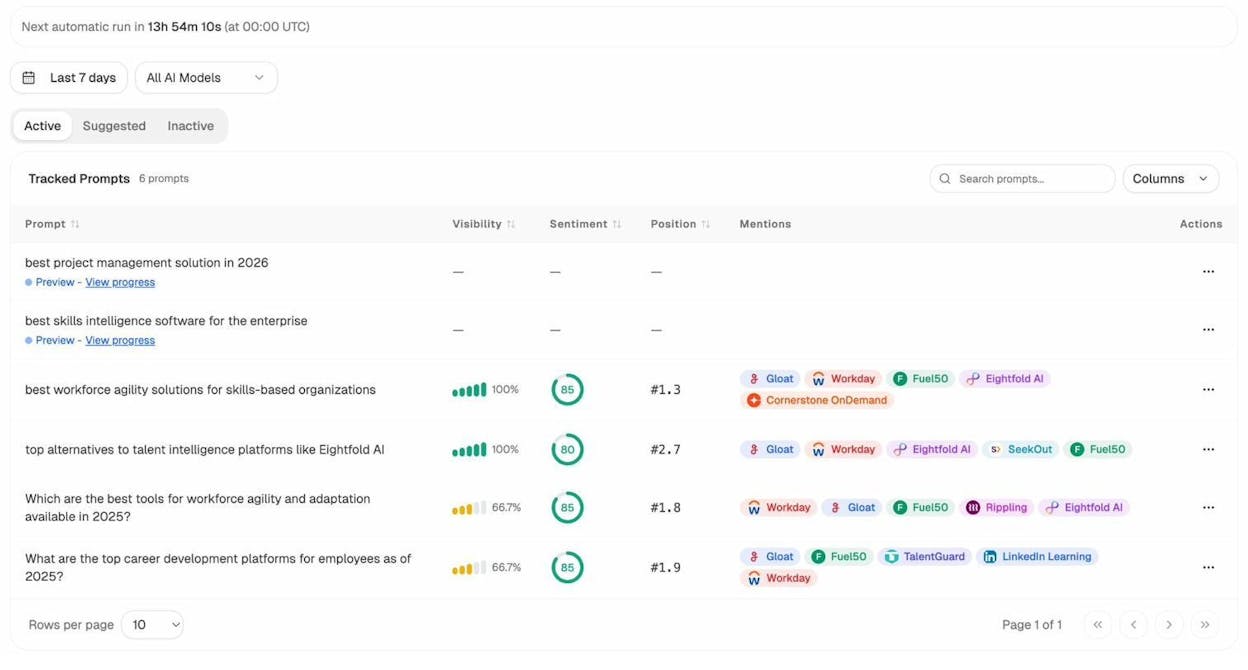
Add anything worth monitoring to your tracked list. Each tracked prompt becomes a row in your visibility report, with the AI engines, your share of voice, and the brands cited alongside you.
Find the topics where competitors win and you don’t
Once you have the prompts, look at which ones your tracked competitors win and you do not. Open the Competitor Intelligence view and sort by mention gap.
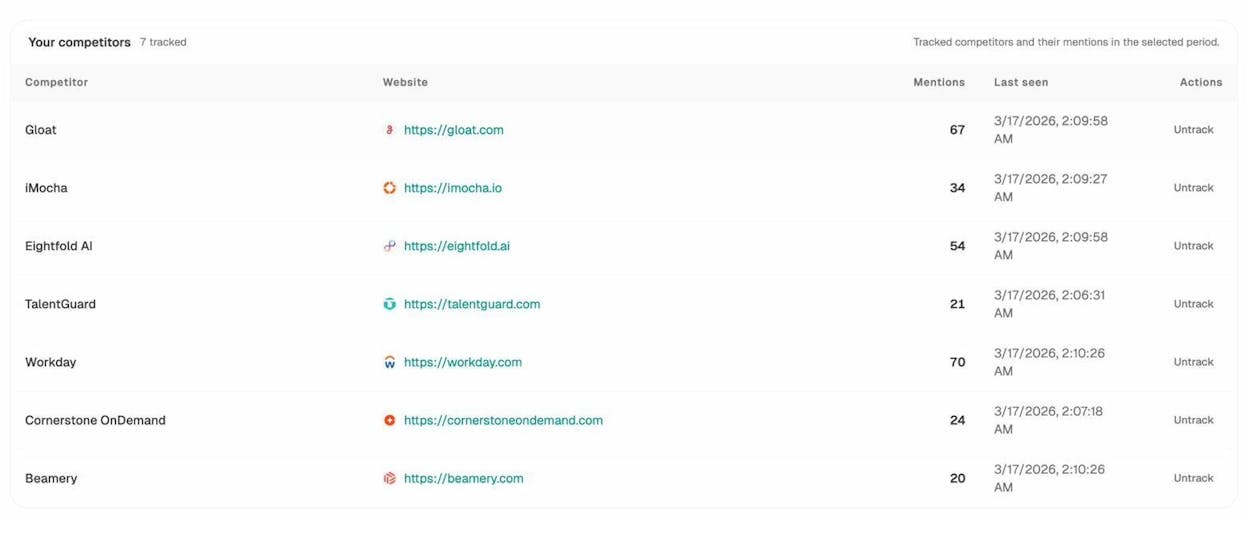
Each gap is a content map entry. If a competitor is cited 67 times in the last week for prompts in your category and you are cited 12, the prompts they win on are the topics to plan content around. There is more on this exact workflow in our piece on how to outrank competitors in AI search.
Find what already works for you, and what doesn’t
Some of your existing pages are quietly earning AI traffic right now, and most teams have no idea which ones. The AI Traffic Analytics view shows the landing pages that visitors arrive at from ChatGPT, Perplexity, Claude, Gemini, and Copilot, with citation counts and engagement.
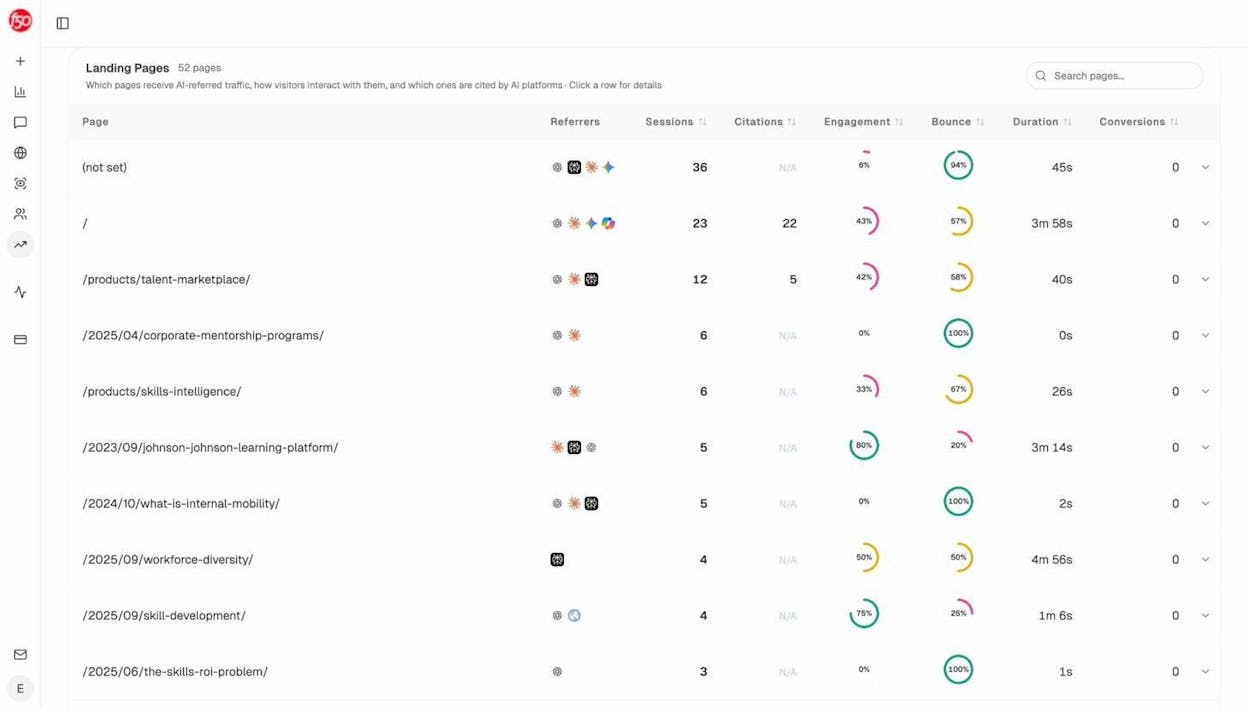
Read this list as a content map signal. The pages with the highest citations are the format the AI engines like, which means more topics in the same shape are likely to work.
For the inverse view, open Citation Analytics. It lists every URL the AI engines cite when answering questions in your category, plus the type of source (blog, product page, review, social).
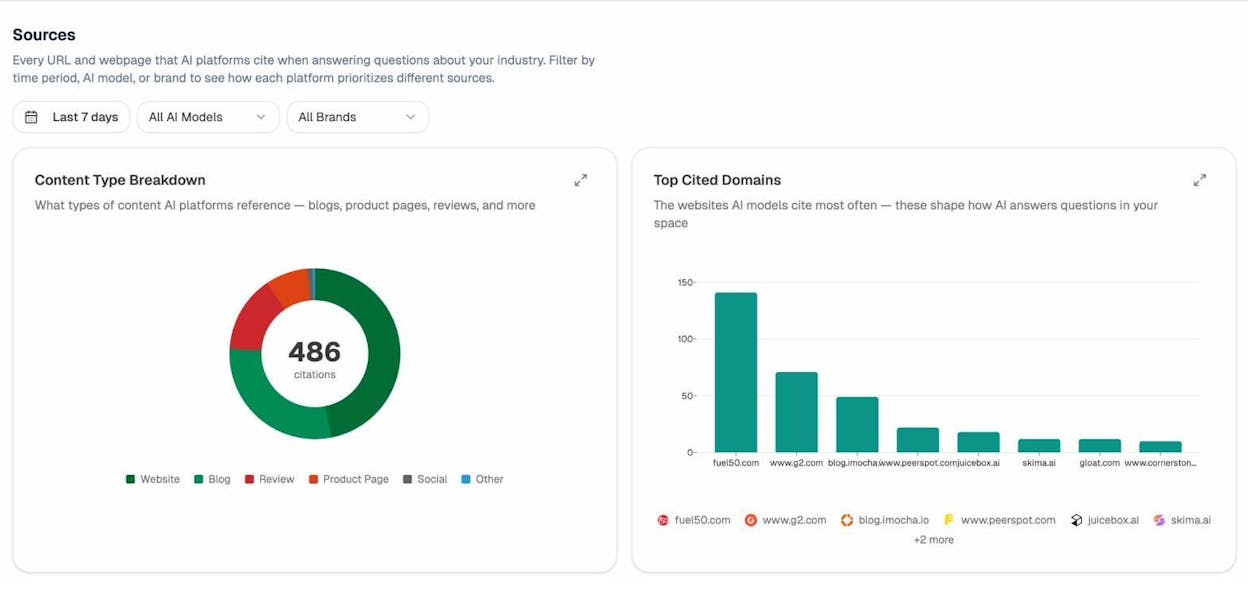
Two things to do with this. When a third-party domain (G2, Reddit, an industry blog) is cited often and you are not on it, that is a placement to chase. When one content type dominates citations (say, blog posts beat product pages 4 to 1), weight your map toward that format. Our analysis of 83,670 AI citations goes deeper on the patterns.
Content mapping tools
You can do all of this with five tools or fewer.
-
A spreadsheet. Google Sheets is enough. The template above is a starting point.
-
A keyword research tool. Our free Keyword Generator and Keyword Difficulty Checker cover the basics. Ahrefs, Semrush, or Moz do it at higher volume.
-
An audience listening tool. SparkToro is the cheapest reliable option for finding what your audience reads and listens to.
-
An AI visibility platform. Analyze AI is the one we built. Whatever you use, it needs tracked prompts, competitor citations, and landing-page-level AI traffic data.
-
A diagram tool. Lucidchart or Whimsical work for visualising buyer journey maps.
For ongoing prioritisation, the AI Content Writer takes the gaps you find and turns each one into a content brief, an outline, and a first draft, so the map flows directly into production.
Final thoughts
Both methods have their place. The question is not which is correct, but which is honest about what your content needs to do.
|
Approach |
Good at |
Misses |
|---|---|---|
|
Traditional (persona × funnel) |
Spotting awareness vs consideration gaps for each persona |
Forces every article into one cell, no prioritisation |
|
Analyze AI (BP + traffic + AI visibility) |
Prioritising topics by real business and traffic value |
Less useful for pure brand or thought leadership |
What we end up with is a hybrid. Build the persona grid once a quarter to spot funnel gaps. Score every new topic on the three axes (business potential, organic traffic, AI search visibility) before it enters production. Cross-check both views once a month against what is actually getting cited and clicked. The map is never finished. The work is in keeping it honest.
If you want to start mapping for AI visibility today, the Discover dashboard is where most teams begin.
Ernest
Ibrahim


