


Summarize this blog post with:
In this article, you’ll learn what share of search is, how to calculate it step by step, which supporting metrics make it more useful, and how to improve it across both traditional search and AI search engines. You’ll also see how share of search connects to market share, why it matters as a leading indicator of brand health, and how to extend this thinking to the new wave of AI-powered search where brands are recommended (or ignored) inside ChatGPT, Perplexity, and Gemini answers.
Table of Contents
What Is Share of Search?
Share of search (SoS) is the percentage of all branded searches in your market that mention your brand. It tells you how much of your category’s search demand belongs to you.
The formula is simple:
Share of Search (%) = (Your Brand’s Search Volume ÷ Total Branded Search Volume for All Competitors) × 100
For example, say your brand gets 20,000 searches in a month. Your three main competitors get 15,000, 10,000, and 5,000 searches respectively. The total branded search volume in your category is 50,000.
Your share of search = 20,000 ÷ 50,000 × 100 = 40%
That 40% tells you that four out of every ten people searching for a brand in your category are searching for yours.
Why share of search matters
Share of search isn’t just a vanity number. It’s a leading indicator of market share.
In 2020, marketing researcher Les Binet published data showing that share of search tracks closely with market share over time. Brands that gain share of search tend to gain market share in the months that follow. Brands that lose share of search tend to lose market share later.
This makes SoS one of the fastest, cheapest proxies for brand health you can track. Surveys take weeks to run. Sales data is a lagging indicator. But branded search volume updates monthly, reflects real consumer behavior, and costs nothing to pull from keyword research tools.
If your share of search rises, interest in your brand is growing and may soon convert into revenue. If it drops, competitors are gaining ground and you need to act before sales reflect it.
Share of Search vs. Share of Voice vs. Organic Share of Voice
These three metrics sound similar but measure very different things. Confusing them leads to bad decisions.
Classical share of voice (SoV) tells you how much paid media exposure you’re buying compared to competitors. It measures ad impressions, spend, or GRPs.
Organic share of voice shows how much of the organic search traffic you win on a set of tracked keywords. It measures SEO performance across specific terms.
Share of search measures how often people search for your brand name relative to competitors. It measures brand demand, not ad spend or keyword rankings.
Here’s a side-by-side comparison:
|
Aspect |
Classical Share of Voice |
Organic Share of Voice |
Share of Search |
|---|---|---|---|
|
Core question |
How loud is our paid media vs. competitors? |
How visible is our site in organic SERPs? |
How salient is our brand in search behavior? |
|
What it measures |
% of total ad impressions or spend your brand captures |
% of organic clicks/traffic across tracked keywords |
% of branded search queries in the category that mention your brand |
|
Primary data source |
Ad server reports, Nielsen, media buying logs |
Rank tracking tools (keyword positions + CTR models) |
Google Trends or keyword research tools |
|
Typical calculation |
Your ad impressions ÷ total market impressions |
Your estimated traffic ÷ sum of traffic across competitors for tracked keywords |
Your branded search volume ÷ total branded search volume for competitor set |
|
Update frequency |
Weekly to monthly |
Daily to weekly |
Monthly to quarterly |
|
Key strength |
Budget benchmarking and media planning |
Granular keyword-level diagnostics, captures SEO wins fast |
Leading indicator of market share shifts, tied to real demand |
|
Main limitation |
Exposure does not equal attention, often lagging |
Only covers organic Google results, needs well-chosen keyword basket |
Works best for distinctive brand names, doesn’t explain why demand changed |
|
Typical owners |
Brand and media planners |
SEO and content teams |
CMOs, brand and insights teams |
The takeaway: share of voice is about spend, organic share of voice is about keyword rankings, and share of search is about brand demand. They each answer different questions. The most effective teams track all three.
How to Calculate and Analyze Share of Search
Calculating share of search requires just two things: branded search volume data for your brand, and the same data for each competitor you want to compare against.
Here’s how to do it step by step.
Step 1: Get your branded search volume
Open a keyword research tool like Ahrefs Keywords Explorer, Semrush, or the Analyze AI Keyword Generator. Enter your brand name in the search box and select one country at a time.
Go to the matching terms report and note down the total search volume for all keywords containing your brand name.
![[Screenshot: Ahrefs Keywords Explorer showing branded search volume for a brand name, with the SV (search volume) column highlighted]](https://www.datocms-assets.com/164164/1777454749-blobid1.png?auto=format,compress&w=1248&fit=max)
If you’re working with a limited budget, Google Trends is a free alternative. It won’t give you absolute search volume numbers, but it will show relative interest over time. This is enough to calculate directional SoS trends.
![[Screenshot: Google Trends comparison showing relative search interest for 3-4 competing brands over 12 months]](https://www.datocms-assets.com/164164/1777454755-blobid2.jpg?auto=format,compress&w=1248&fit=max)
Step 2: Repeat for every competitor
Run the same search for each competitor in your market. Choose the same country and time period for every brand so the numbers are comparable.
If you’re in the project management space, for example, you’d search for “Asana,” “Monday.com,” “ClickUp,” “Notion,” and any other brands your buyers might consider.
Step 3: Calculate your share
Add up all branded search volumes, divide your brand’s volume by the total, and multiply by 100.
For example:
|
Brand |
Monthly Branded Search Volume |
|---|---|
|
Your Brand |
20,000 |
|
Competitor A |
15,000 |
|
Competitor B |
10,000 |
|
Competitor C |
5,000 |
|
Total |
50,000 |
Your share of search = 20,000 ÷ 50,000 × 100 = 40%
You can do this in a spreadsheet, or paste the numbers into ChatGPT and ask it to calculate the percentages and generate a chart. Either works.
Handling ambiguous brand names
If your brand name has a common meaning (like “Apple” or “Delta”), raw search volume will include unrelated queries. You’ll need to filter those out.
In keyword research tools, you can use features like parent topic filters to isolate queries that clearly relate to the brand. Export only the relevant keywords and sum their volumes for a cleaner SoS calculation.
For Google Trends, adding a category filter (like “Technology” for Apple the company) helps separate brand searches from generic ones.
How to Calculate Your Share of AI Search
Share of search tells you how often people search for your brand in Google. But it misses a growing channel: AI search engines like ChatGPT, Perplexity, Gemini, and Copilot.
When someone asks ChatGPT “What’s the best CRM for small businesses?” and it recommends three competitors but not you, that’s a share-of-search problem you won’t catch with keyword volume data. The buyer never typed your brand name into Google. They asked an AI, got an answer, and moved on.
This is why tracking your share of AI search matters alongside traditional SoS. It measures how often AI engines mention and recommend your brand compared to competitors across tracked prompts.
Here’s how to do it with Analyze AI.
Step 1: Set up your brand and competitors
In Analyze AI, create a project and add your brand name and website. Then add each competitor you want to track. The platform will start monitoring how often each brand gets mentioned and cited across AI engines.
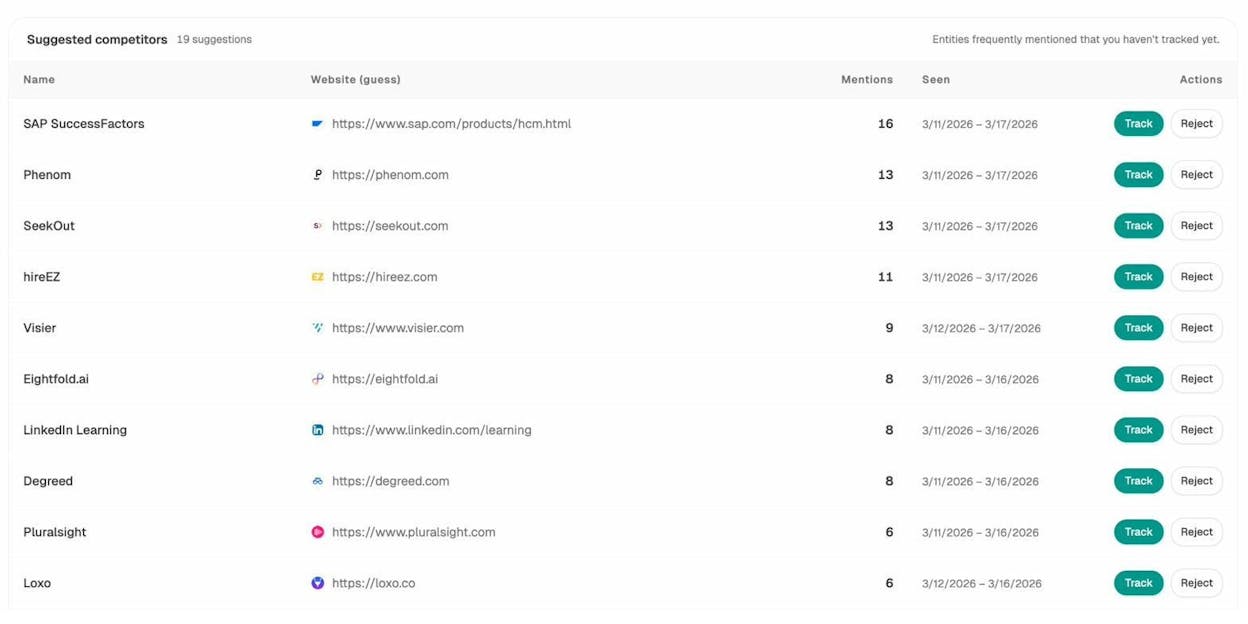
You can also let Analyze AI surface competitors you may have missed. The Suggested Competitors section shows entities that appear frequently in AI answers for your tracked prompts but aren’t on your list yet. This is a fast way to catch rising challengers you didn’t know about.
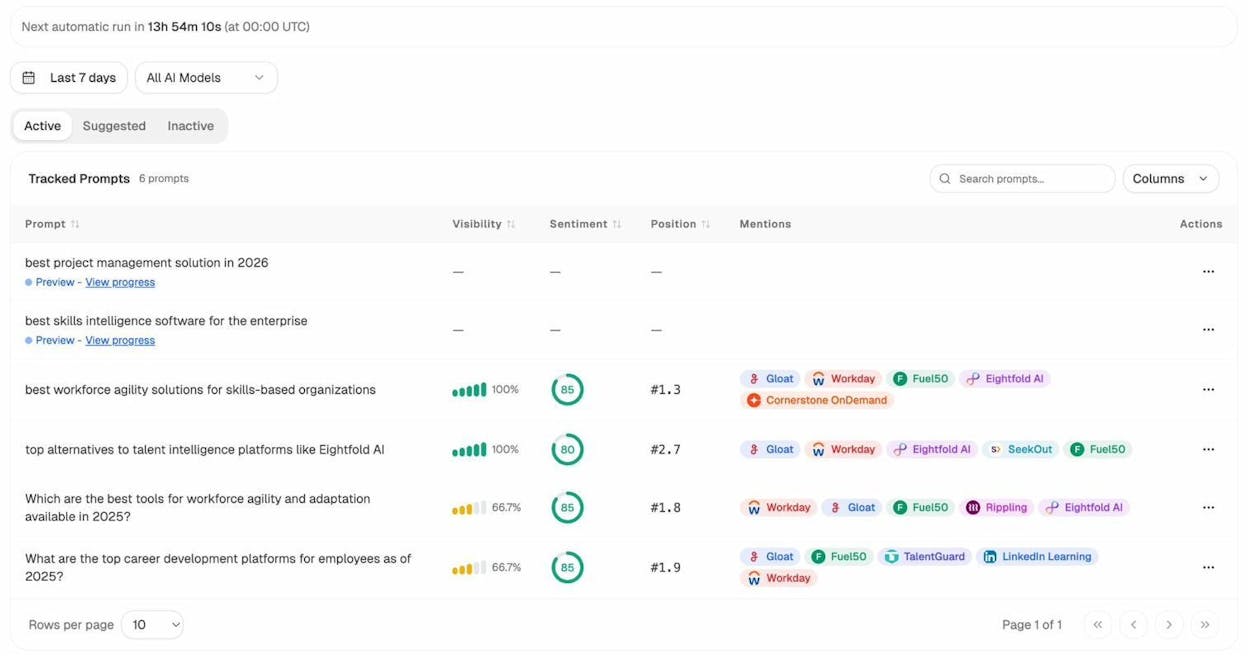
Step 2: Track prompts that represent your category
Add the prompts your buyers actually type into AI search engines. These are the AI equivalent of keywords.
For a CRM company, that might include prompts like “best CRM for enterprise sales teams,” “top alternatives to Salesforce,” or “which CRM has the best marketing automation.”
Analyze AI tracks each prompt across multiple AI engines automatically and shows you where your brand appears (or doesn’t) for each one.
Step 3: Read your AI visibility score
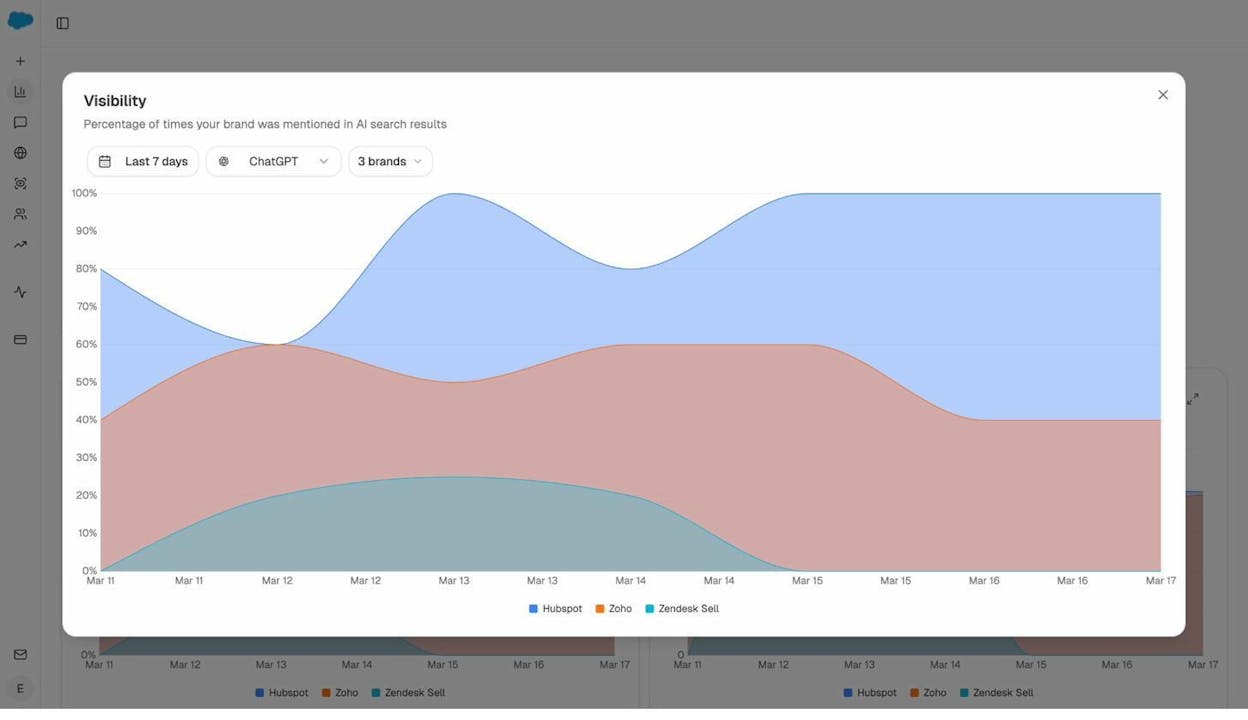
The Overview dashboard in Analyze AI shows your visibility percentage (the share of AI responses that mention your brand), sentiment, and how you stack up against each tracked competitor.
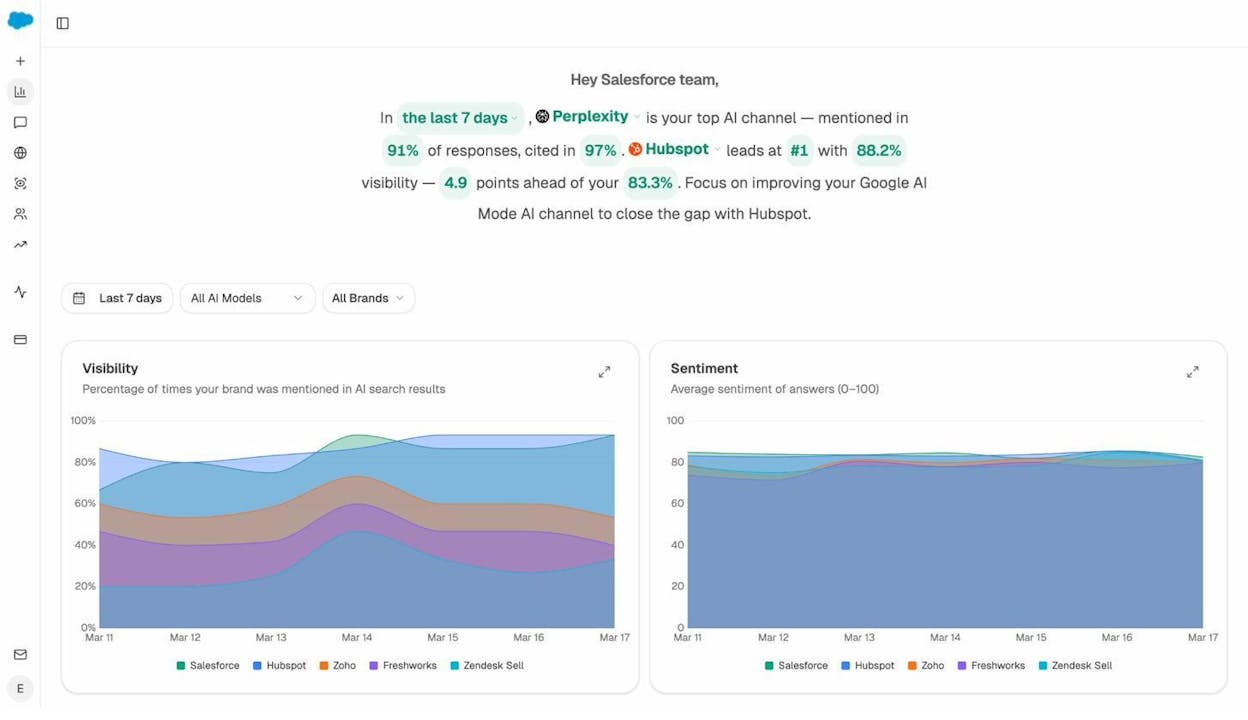
This is your share of AI search. If your visibility is 83% and your top competitor is at 88%, you know exactly how much ground you need to make up and on which engines.
You can drill into specific AI engines to see where you’re strongest and weakest.
Step 4: Monitor over time
Just like traditional share of search, AI share of search matters most as a trend. A single snapshot tells you where you stand today. Weekly or monthly tracking tells you whether you’re gaining or losing ground.
Analyze AI runs tracked prompts on a scheduled cadence (daily by default), so you can see movement without manual checks. The weekly email digests deliver prioritized actions, citation changes, and competitive shifts straight to your inbox every Monday.
Supporting Metrics for Deeper Analysis
The SoS percentage alone tells you how much search interest you capture. But pairing it with supporting metrics gives you a much sharper picture of brand strength and competitive position.
Category penetration
Category penetration compares your branded searches against total searches for the entire product category, including generic and non-branded terms.
Category penetration (%) = (Branded search volume ÷ Total category search volume) × 100
For example, if your brand gets 90,000 branded searches per month, and the total monthly search volume for all keywords in your category (including generic terms like “project management tools” and all competitor brand names) is 1.5 million, your category penetration is:
90,000 ÷ 1,500,000 × 100 = 6%
This tells you that 6% of all interest in your category goes to your brand. A high SoS with low category penetration means you’re well-known among people who are already aware of you, but invisible to the broader market. That points to a distribution or awareness problem, not a brand preference problem.
You can pull this data from SEO tools by comparing branded organic traffic across competitors and adding in generic keyword volumes for your category.
Momentum
Momentum tracks how fast your branded search volume is growing compared to competitors.
Momentum = % change in branded search volume over a period
Suppose your branded search traffic grew from 80,000 to 100,000 over six months. That’s 25% growth. But if a competitor grew from 50,000 to 90,000 in the same period, that’s 80% growth. Even though you have more total volume, they have more momentum.
Tracking momentum helps you identify rising challengers before they overtake you. A small competitor with high momentum deserves more attention than a large one that’s flat or declining.
Conversion-oriented intent
Not all branded searches are equal. Someone searching “YourBrand pricing” has very different intent than someone searching “YourBrand careers.”
Adding an intent layer to your share of search analysis helps you understand whether your brand is attracting potential buyers or just general interest.
High-intent traffic ratio = Traffic from commercial and transactional queries ÷ Total traffic
If your total organic traffic is 200,000 visits per month and 40,000 of those come from commercial or transactional keywords, your high-intent ratio is 20%.
A high ratio means you’re attracting people who are ready to buy, not just browse. You can compare this across competitors to see who’s capturing the most demand-stage traffic.
SEO tools break down keyword intent into informational, navigational, commercial, and transactional buckets. Use these filters to see how your brand’s intent mix compares to competitors.
![[Screenshot: SEO tool showing keyword intent breakdown — informational, navigational, commercial, transactional — for a brand and its competitors]](https://www.datocms-assets.com/164164/1777454772-blobid8.png?auto=format,compress&w=1248&fit=max)
AI visibility share
Traditional SoS tracks how often people search for your brand. AI visibility share tracks how often AI engines recommend your brand when answering category-relevant prompts.
This is a forward-looking metric. As more buyers use AI search engines to research products, the brands that appear consistently in AI answers will capture a growing slice of demand.
In Analyze AI, your AI visibility percentage is calculated automatically across every tracked prompt and engine. You can filter by engine (ChatGPT, Perplexity, Gemini, Copilot), by time period, or by competitor to see exactly where you stand.
The Perception Map adds another layer. It plots every tracked brand on two axes: visibility (how often they appear) and narrative strength (how positively AI frames them). This tells you whether a brand is both visible and well-positioned, or visible but poorly portrayed.
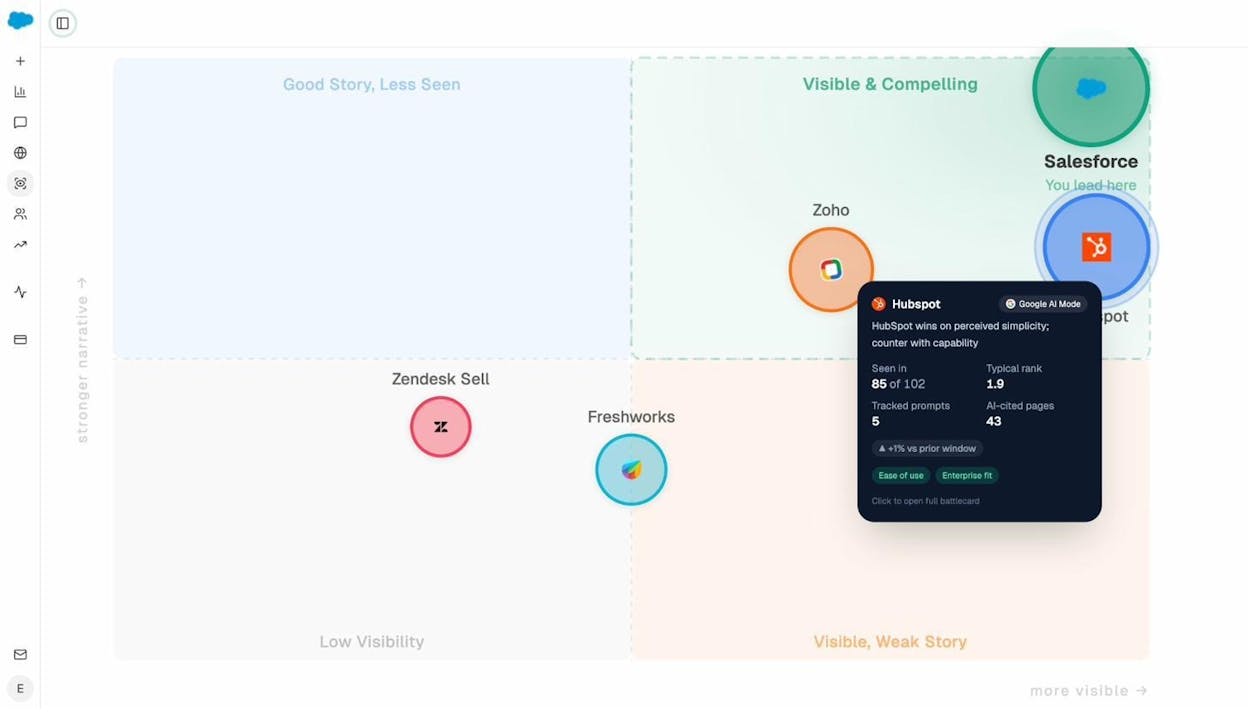
A brand in the “Visible & Compelling” quadrant has both high visibility and a strong narrative. A brand in “Visible, Weak Story” is appearing frequently but being portrayed in a mixed or negative light. Each quadrant suggests a different strategic response.
How to Use Share of Search in Your Marketing Strategy
Share of search data becomes powerful when you connect it to strategic decisions. Here are five ways to put it to work.
Validate strategic direction early
If you enter a new market or launch a repositioning effort, SoS tells you whether it’s working before sales data shows up. An uptick in branded searches means people are noticing. A flat line means your message isn’t landing.
This works for AI search too. If you’ve invested in content designed to get cited by AI engines, tracking your AI visibility share over time shows whether those efforts are translating into more recommendations.
Monitor campaign momentum
Big campaigns (product launches, viral content, PR pushes, influencer partnerships) should move branded search volume. If they don’t, something about the campaign isn’t sticking.
Track SoS weekly during and after a campaign. Compare your branded search trend to competitors over the same period. If your share rises while theirs holds steady, your campaign had a real impact. If the whole category rises equally, the lift was market-driven, not campaign-driven.
Spot competitive shifts early
Comparing your SoS trend against competitors reveals who’s gaining or losing ground. This is especially useful around seasonal events, funding announcements, or competitor product launches.
If a competitor’s share of search jumps 10 points in a quarter, find out what’s driving it. Did they launch a viral campaign? Get major press coverage? Release a new product? Understanding the cause helps you decide whether to respond and how.
Track long-term brand impact
Share of search is one of the best metrics for measuring brand-building campaigns that don’t have a direct click-to-purchase path. If your SoS rises while competitors stay flat, your brand work is moving the needle. If everyone rises together, the category is growing but your relative position hasn’t changed.
Inform AI search strategy
Your AI visibility share can reveal opportunities traditional SoS misses. For example, you might have a strong share of search in Google but appear in only 30% of relevant AI answers. That gap represents buyers you’re losing to competitors who’ve been optimized for AI search.
Use Analyze AI’s prompt tracking to see which category prompts mention your competitors but not you. These are the conversations where you’re being left out. Each one is a specific, actionable gap to close.
How to Improve Your Share of Search
If you want more people searching for your brand, you need to get in front of them before they even think to search. That means showing up in the right places, earning mentions, and creating content that makes people remember your name.
Run campaigns that spark branded searches
The most direct way to lift branded search volume is to run campaigns that stick in people’s minds. A creative product launch, a bold piece of content, a well-placed influencer collaboration, or a PR moment can all trigger the thought: “I should look that up.”
For example, when Duolingo staged the “death” of its mascot in a viral social media campaign in February 2025, branded searches for “Duolingo” hit an all-time high. The campaign was creative, shareable, and gave people a reason to search for the brand.
![[Screenshot: Google Trends chart showing Duolingo branded search volume spiking dramatically during the viral campaign period]](https://www.datocms-assets.com/164164/1777454777-blobid10.jpg?auto=format,compress&w=1248&fit=max)
Not every brand can go viral. But you can run campaigns designed to generate curiosity. Product comparisons, industry reports, original research, and interactive tools all give people a reason to search for your brand after they encounter your content elsewhere.
Find and fill competitor mention gaps
Look at where your competitors are being mentioned online and figure out how to get your brand into those same places.
In SEO tools, you can check competitor backlink profiles to find articles, listicles, and review pages that mention them but not you. Sort by traffic to focus on the highest-value pages first.
![[Screenshot: SEO tool backlinks report showing referring pages that mention a competitor, sorted by page traffic, with URL filter set to “tool”]](https://www.datocms-assets.com/164164/1777454777-blobid11.png?auto=format,compress&w=1248&fit=max)
Open the top referring pages and assess whether you have a good angle to pitch your product. If a page lists “10 best project management tools” and includes your competitor but not you, that’s a concrete opportunity.
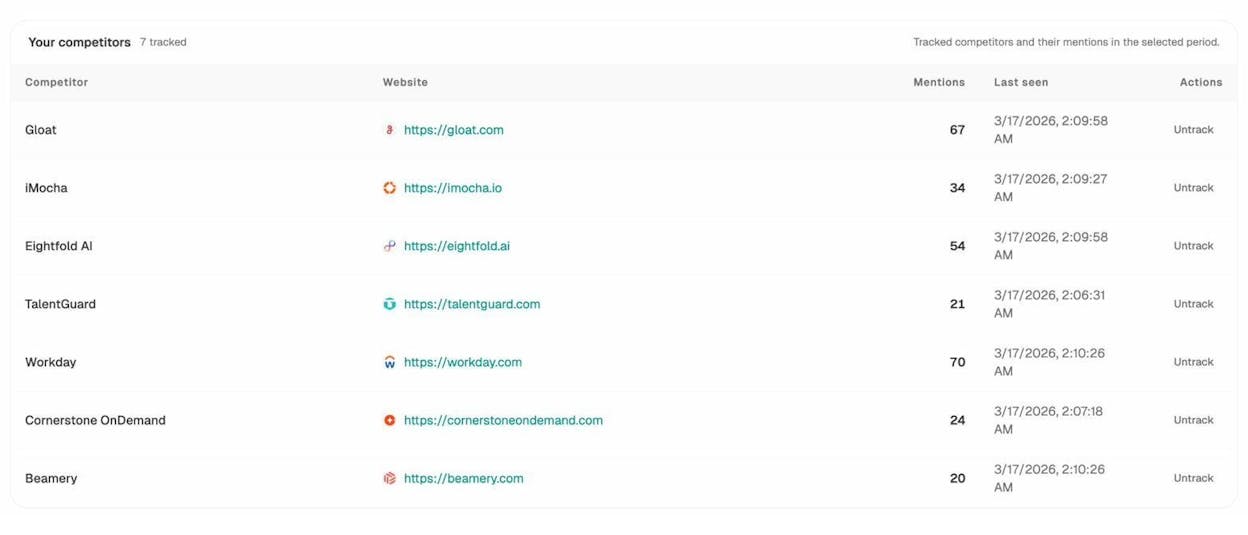
Do the same for AI search. In Analyze AI, the Competitors dashboard shows you exactly which brands appear in AI answers for each tracked prompt and how often they’re mentioned. If a competitor shows up in 70 prompts and you show up in 40, the 30-prompt gap tells you where to focus.
Earn the sources AI engines trust
AI engines don’t just make up their recommendations. They pull from sources: websites, review sites, blog posts, product pages, and documentation. Winning citations on these trusted sources is how you get recommended.
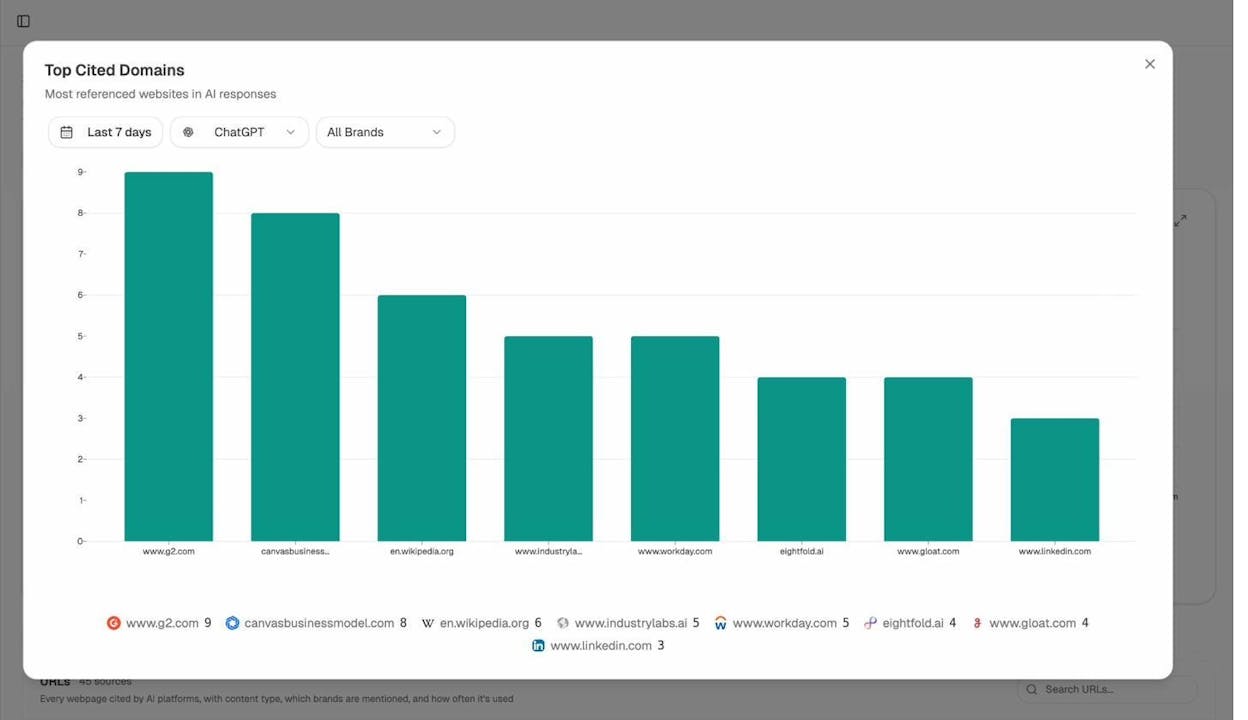
Analyze AI’s Sources dashboard shows you exactly which URLs and domains AI engines cite in your space. It breaks this down by content type (website, blog, review, product page, social) and shows the top cited domains.
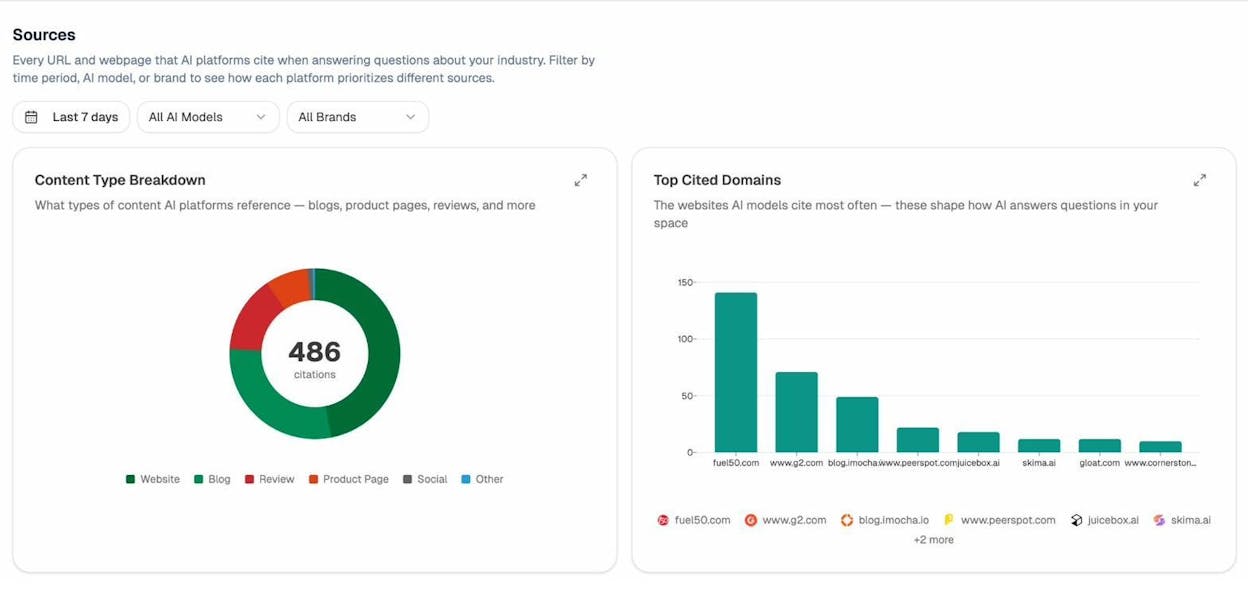
If G2.com is the most-cited domain in your category and you have a weak G2 profile, that’s a high-priority fix. If a competitor’s blog gets cited eight times and yours gets cited zero times, you know where to invest in content quality.
You can also filter by specific AI engine to see what ChatGPT trusts versus what Perplexity prefers.
Create content for non-branded searches
You don’t have to wait for others to mention your brand. You can take the lead by targeting non-branded keywords that relate to your audience’s problems. Then position your brand as the solution directly within the content.
This is standard content marketing, but it works. A well-written article that ranks for a high-volume non-branded keyword puts your brand in front of people who didn’t know about you. Some of those people will remember your name and search for it later.
The same principle applies to AI search. When you create content that AI engines consider authoritative enough to cite, you earn brand mentions in AI answers for non-branded prompts. Every time ChatGPT or Perplexity recommends your brand to answer a question like “best CRM for startups,” that’s a touchpoint that can drive a later branded search.
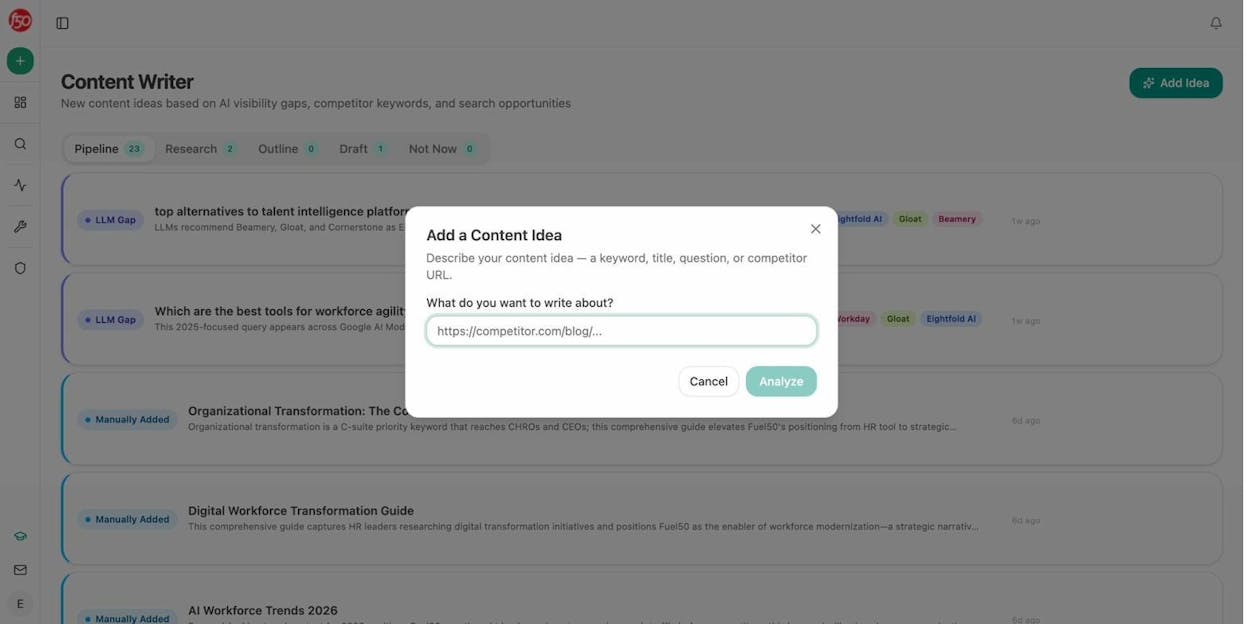
To find the right topics, start with keyword research. The Analyze AI Keyword Generator and Keyword Difficulty Checker can help you find terms with enough volume to be worth targeting and low enough competition to be realistic.
Then use the Analyze AI Content Writer to go from idea to research to outline to draft. The tool pulls in AI visibility gaps, competitor keywords, and editorial comments at each step so the content is built to perform in both traditional and AI search.
Optimize your branded search experience
When someone does search for your brand, make sure they find what they need. Clear pricing pages, easy-to-find support docs, and fast navigation all reduce bounce rates and improve the branded search experience.
Pull up your branded keyword list in an SEO tool and check whether the right pages rank for the right queries. If someone searches “YourBrand pricing” and lands on a blog post instead of your pricing page, that’s a problem.
![[Screenshot: SEO tool showing organic keywords filtered by brand name, with the ranking URL visible to verify the right page ranks for each branded query]](https://www.datocms-assets.com/164164/1777454789-blobid15.png?auto=format,compress&w=1248&fit=max)
Monitor missed mention opportunities
Set up alerts to catch pages that mention your competitors but not your brand. SEO tools like Ahrefs Alerts let you monitor the web for new pages that mention competitors, filtered by domain authority and traffic thresholds.
For AI search, Analyze AI’s weekly email digests flag competitive shifts and new prompt gaps automatically. If a competitor overtakes you on three prompts in a week, you’ll know Monday morning without logging in.
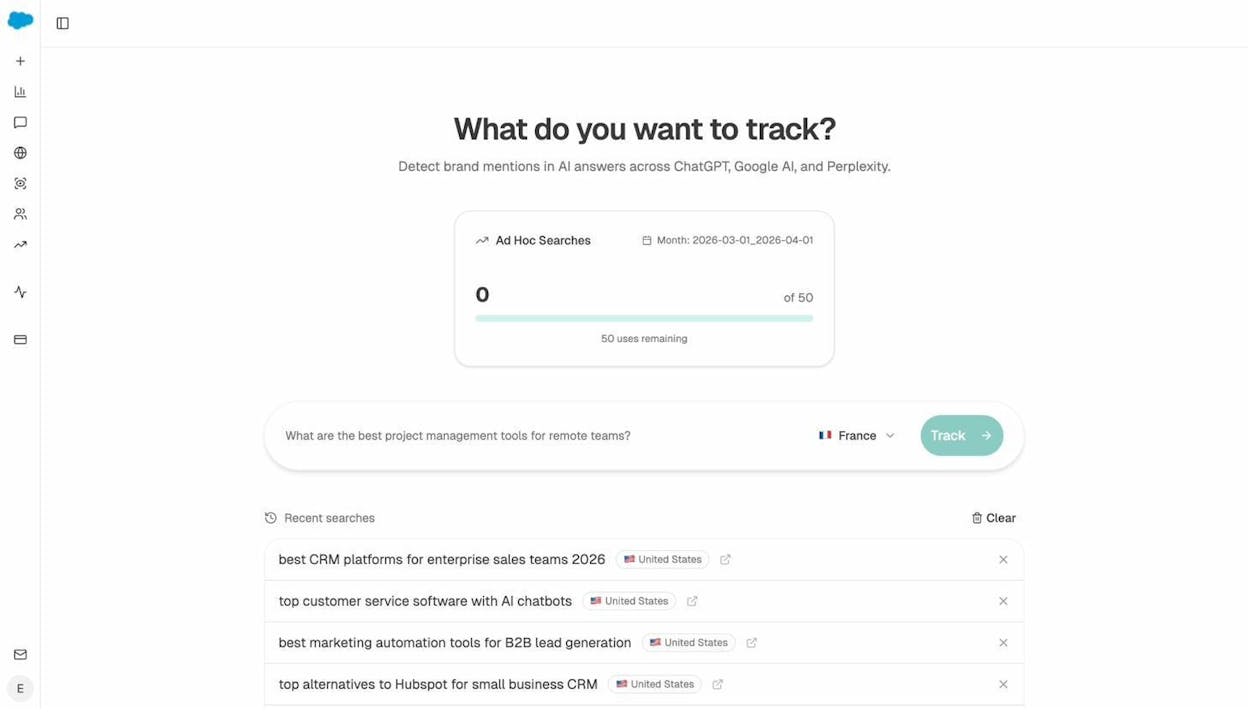
Test and validate with ad hoc AI searches
Before committing resources to a new topic or content strategy, you can run a one-off search across multiple AI engines to see who currently shows up.
In Analyze AI, the AI Search Explorer lets you type any prompt and instantly see which brands appear across ChatGPT, Perplexity, and Google AI. This helps you validate whether a gap is real before investing in closing it.
Tracking AI Traffic That Comes from Your Share of AI Search
The connection between AI visibility and actual website traffic is something most teams struggle to prove. Share of search in traditional Google is easy to track because you can see branded keyword volume. But AI search is different. When ChatGPT recommends your brand, there’s no keyword volume to count. Instead, you track the visitors who actually arrive on your site from AI engines.
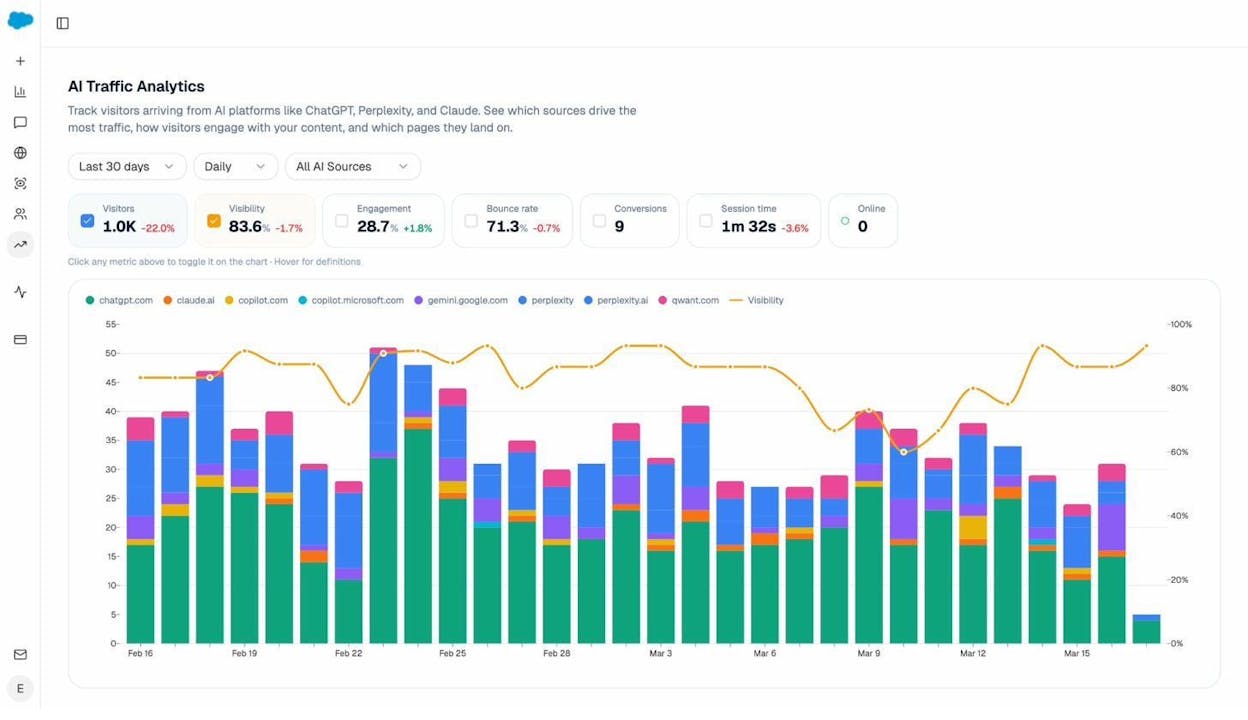
Analyze AI’s AI Traffic Analytics connects your GA4 data to show exactly how many visitors arrive from ChatGPT, Perplexity, Claude, Gemini, and Copilot. You can see which pages they land on, how long they stay, and whether they convert.
The Landing Pages report drills deeper. It shows which specific pages receive AI-referred traffic, which AI engines sent visitors, and which prompts triggered the citation. This closes the loop from “AI mentioned our brand” to “a visitor arrived, engaged, and converted.”
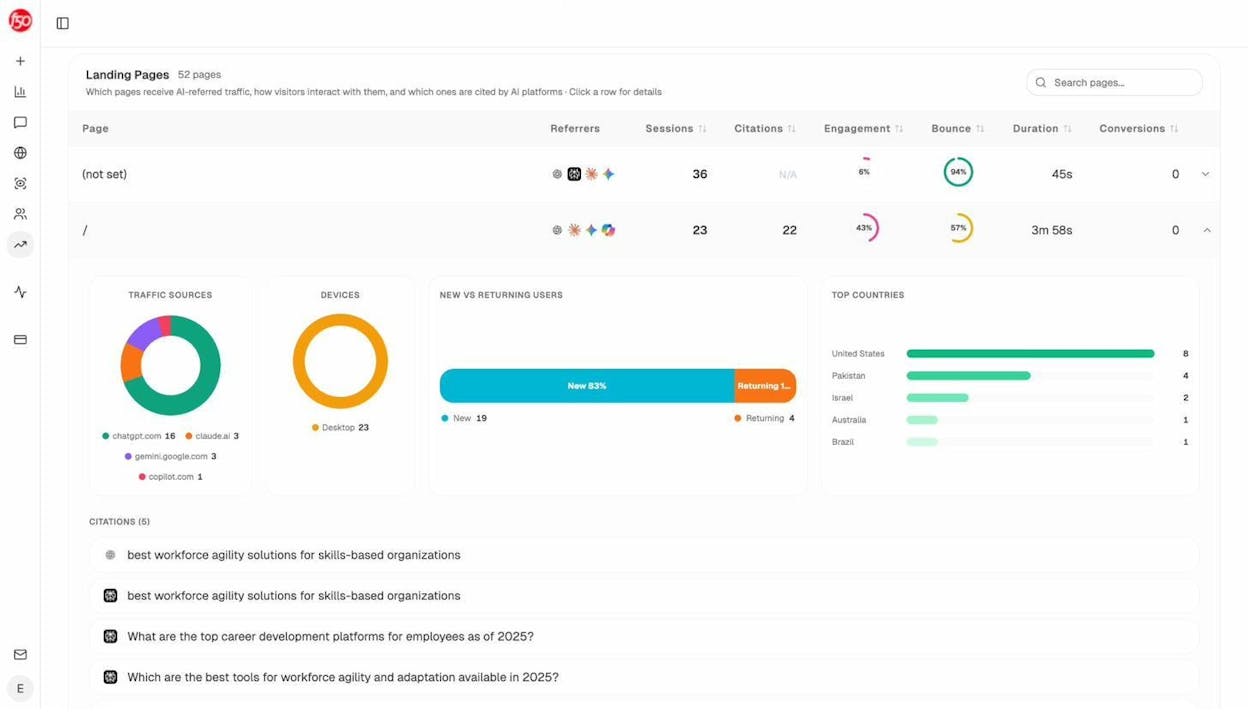
This is the data that turns share of AI search from an abstract metric into something you can tie to pipeline and revenue.
Limitations of Share of Search
Share of search is useful, but it has real limitations. Knowing these helps you use it wisely.
It’s directional, not precise. Search volume data from third-party tools is estimated, not exact. Different tools will give you different numbers for the same brand. Use SoS for trends and relative comparisons, not as an absolute truth.
Ambiguous brand names skew results. If your brand shares a name with a common word (like “Notion” or “Notion the concept”), raw search data will include unrelated queries. You’ll need to filter carefully or your SoS will be inflated.
Not every branded search signals purchase intent. Someone searching “YourBrand login” or “YourBrand customer support” is an existing user, not a new prospect. Segmenting by intent helps, but the raw SoS number doesn’t distinguish between buyers and existing customers.
Small brands may lack volume. If your brand gets 500 searches a month, the data will be noisy. Small changes in absolute volume can swing your SoS dramatically. For early-stage brands, the metric becomes more useful over time as volume grows.
External factors cause noise. A news story, a viral meme, or even a celebrity sharing your name can spike or crash branded search volume. These events distort SoS but don’t reflect actual brand health. Always investigate sudden changes before drawing conclusions.
SoS doesn’t explain why demand changed. It tells you that branded search went up or down, but not what caused the shift. You’ll need to pair it with campaign data, competitive analysis, and qualitative research to understand the drivers.
It shouldn’t be used in isolation. SoS is most powerful when combined with other metrics like direct traffic, social mentions, AI visibility share, sales data, and brand surveys. No single metric gives you the full picture.
These same limitations apply to AI visibility share, with one addition: AI engine behavior is less transparent than Google’s. The models can change how they cite and recommend brands without notice, so monitoring trends over longer time periods helps smooth out short-term noise.
Final Thoughts
Share of search gives you a fast, affordable read on brand health. It tells you how much of your market’s attention belongs to you, and whether that’s growing or shrinking relative to competitors.
But search behavior is changing. More buyers are using ChatGPT, Perplexity, and Gemini to research products, compare options, and make purchase decisions. If your share of search strategy only tracks Google, you’re missing a growing share of the conversation.
The most effective approach is to track both. Use traditional share of search to monitor branded demand in Google. Use AI visibility tracking to monitor how often AI engines recommend your brand. And connect the two to your actual website traffic and conversions so you know what’s driving results.
Neither SEO nor AI search is going away. They’re two organic channels that compound when you invest in both. The brands that understand this and measure both will be the ones that capture the most demand in the years ahead.
Ernest
Ibrahim


