


Summarize this blog post with:
In this article, you’ll learn what share of voice (SOV) is, why it correlates directly with market share, and how to measure it across six marketing channels—including organic search, paid search, social media, earned media, and the newest channel every marketer needs to track: AI search. You’ll get step-by-step instructions, formulas, tool recommendations, and real screenshots so you can start measuring your SOV today.
Table of Contents
What is share of voice?
Share of voice (SOV) is a measure of how visible your brand is compared to competitors within a specific market or channel.
The original definition was narrow: SOV measured the percentage of total advertising spend or impressions your brand captured in a given market. If your industry spent $10 million on TV ads and your brand spent $1 million, your SOV was 10%.
That definition still holds for paid media. But brands now compete for attention across many more channels—organic search, social media, AI-generated answers, earned media. So the modern definition of SOV is broader: it measures how much of the total visibility in a market belongs to your brand, across whatever channel you’re looking at.
The formula stays the same regardless of channel:
SOV = Your Brand’s Visibility Metric / Total Market Visibility Metric × 100
The “visibility metric” changes depending on the channel. For organic search, it’s traffic or keyword rankings. For social media, it’s mentions. For AI search, it’s how often AI engines cite or mention your brand in their answers. For paid search, it’s impression share.
The common thread is comparison. SOV is always relative—your brand’s share versus all the brands competing in your space.
Why Is Share of Voice Important?
There is a well-documented relationship between share of voice and market share. Research published in Harvard Business Review found that brands with a higher SOV than their current market share tend to grow, while brands with a lower SOV than their market share tend to shrink.
This relationship is called excess share of voice (eSOV). If your market share is 10% but your SOV is 15%, you have 5 percentage points of eSOV. That excess is a growth engine. According to data from the IPA, every ten percentage points of eSOV produce roughly a 0.7% annual increase in market share. That sounds modest, but in multi-billion-dollar industries, it translates to millions in revenue.
The reverse also holds. If your SOV drops below your market share, you’re likely to lose ground. You’re spending less to be visible, and competitors are filling the gap.
There’s an important nuance here: bigger brands get more efficiency from their marketing spend. A small brand typically needs to overspend relative to market share just to maintain position, while a large brand can sustain its market share even with a slightly lower SOV. This is why the SOV-market share curve isn’t perfectly linear—and why smaller brands need to be especially strategic about where they invest.
Lidl in the UK is a practical example. In 2013, Lidl held roughly 3% of the UK grocery market with a similar SOV. Starting in 2014, they aggressively increased their media presence and doubled their market share within five years. That trajectory followed the eSOV principle almost exactly.
The takeaway is simple: if you want to grow market share, you need to grow share of voice. And to grow share of voice, you first need to measure it.
The challenge for most marketing teams is that SOV isn’t a single number. It’s a composite across channels. You likely can’t measure overall SOV the way a multinational with a research department can. But you can measure it channel by channel, and those channel-level measurements are what drive tactical decisions.
That’s exactly what we’ll walk through below.
How to Measure SOV in Organic Search
Organic search is the largest traffic driver for most businesses, which makes it one of the most important channels to measure SOV for. There are two practical methods, each with different tradeoffs.
Method 1: Compare Overall Organic Traffic Against Competitors
This is the fastest approach. It gives you a rough directional view of where you stand.
Step 1: List your direct business competitors. Focus only on companies that sell to the same audience. Blogs, media publications, and informational sites that rank for your keywords but don’t compete for your customers should be excluded—they don’t represent market share.
Step 2: Use a batch analysis tool like Ahrefs’ Batch Analysis, Semrush’s Bulk Analysis, or similar. Paste in your domain and your competitors’ domains to pull estimated organic traffic and the number of ranking keywords for each site.
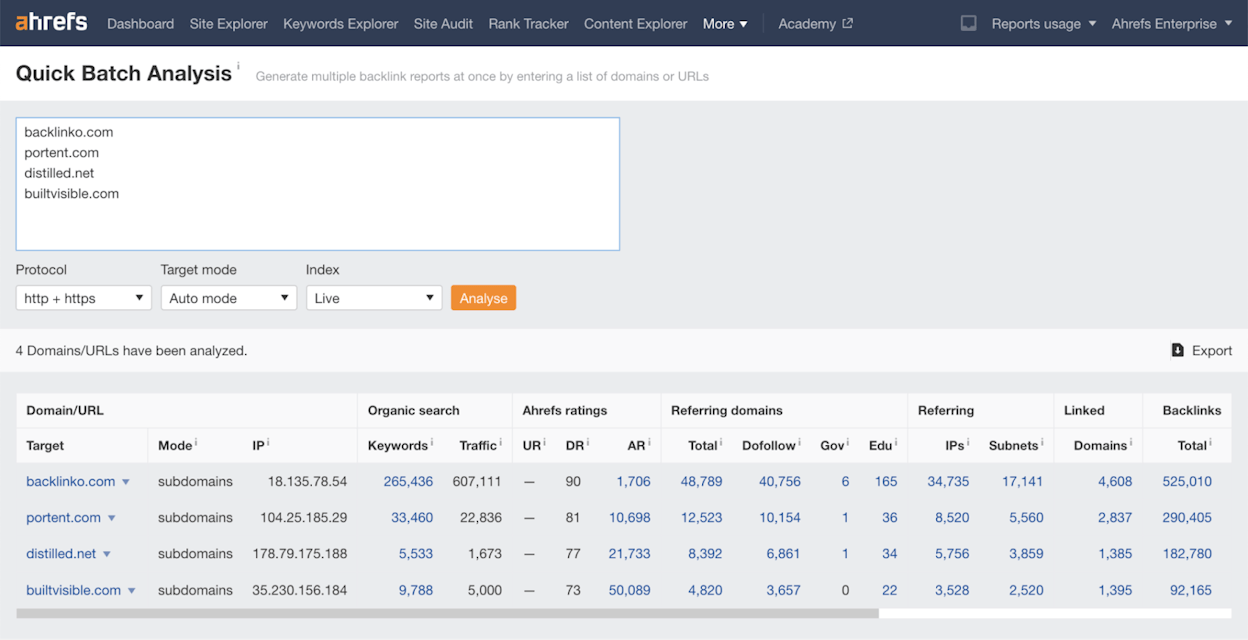
Step 3: Export the data to a spreadsheet. Keep only three columns: Domain, Keywords, and Traffic.
Step 4: Create two new columns: Keyword Share and Traffic Share. Use these formulas (Google Sheets):
For Keyword Share in the first new column: =iferror(arrayformula(if(row(B$1:B)=1,"Keyword share",if(B1:B="","",B1:B/sum($B$2:B)))))
For Traffic Share: =iferror(arrayformula(if(row(C$1:C)=1,"Traffic share",if(C1:C="","",C1:C/sum($C$2:C)))))
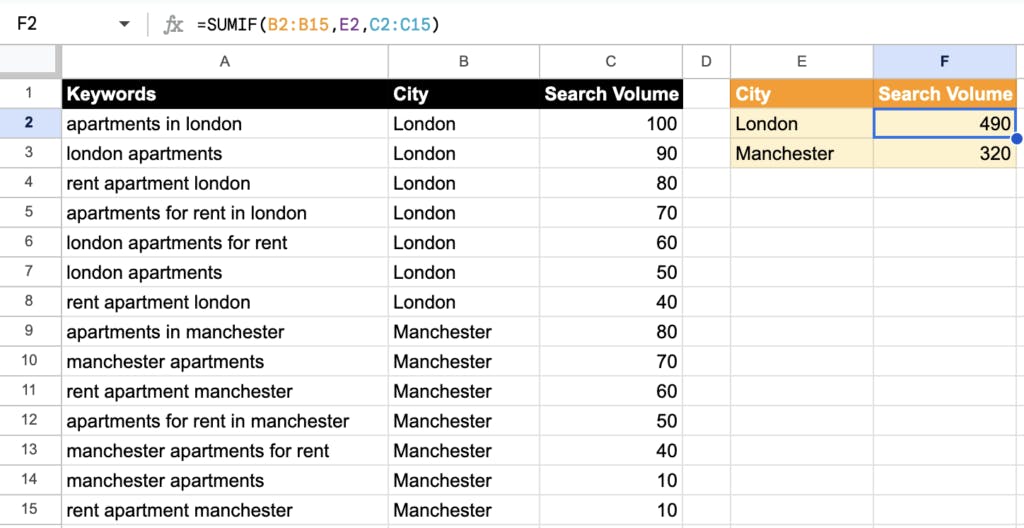
Your traffic share column now shows each brand’s SOV in organic search.
The drawback: This method counts all organic traffic, including pages with zero business relevance. A competitor might rank for high-volume keywords that have nothing to do with their product—like a SaaS company ranking for “what is a CEO”—and that inflates their share artificially. Treat these numbers as directional, not definitive.
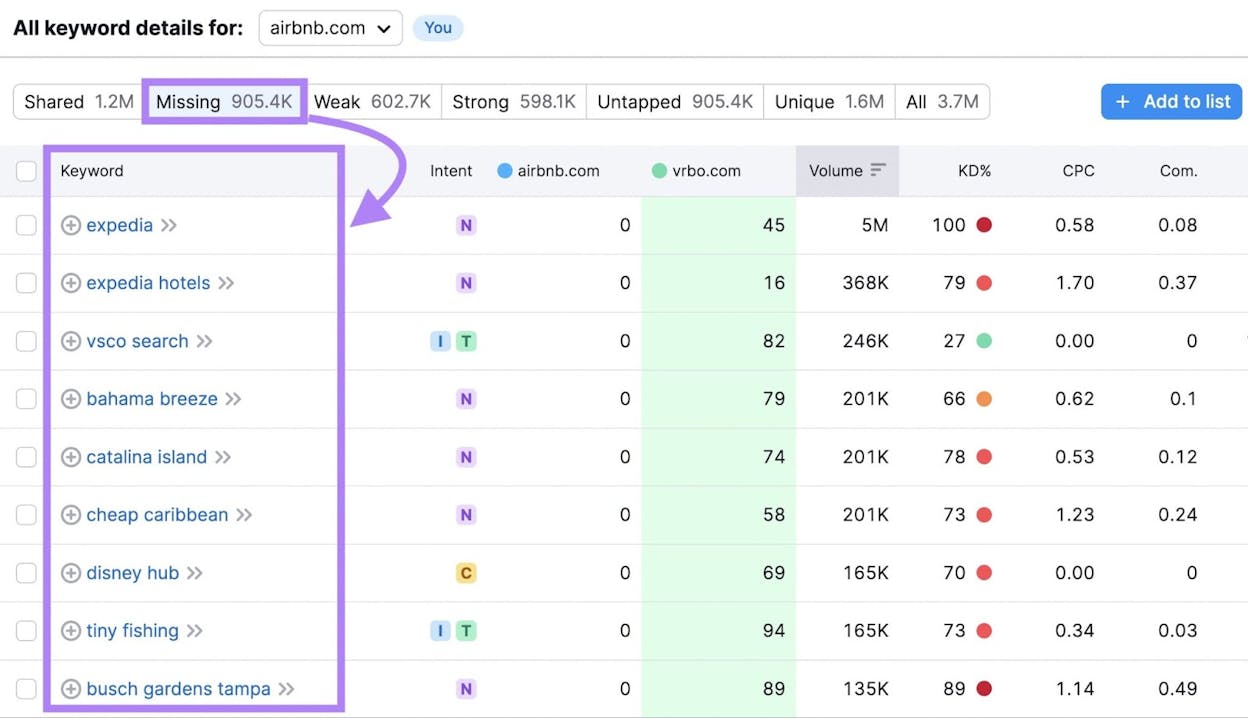
Method 2: Track a Representative Sample of Industry Keywords
This method solves the accuracy problem by letting you choose which keywords count toward SOV.
Step 1: Pull your keyword research master list. Identify the “fat head” keywords—the primary keyword for each topic you’re targeting. If your keyword research spreadsheet has 5,000 entries, you might narrow that to 200–400 main keywords. Exclude branded keywords for both you and your competitors.
Step 2: Paste those keywords into a rank tracking tool. Ahrefs Rank Tracker, Semrush Position Tracking, and similar tools all work. If your business is location-specific, make sure you’re tracking the right geographic market.
Step 3: Tag the keyword list (for example, “SOV keywords”) so you can filter them from any other keywords you’re already tracking.
Step 4: Switch to the Competitors Overview tab (or equivalent in your tool). Look at the visibility metric—this shows the percentage of all possible clicks from your tracked keywords that each domain captures.
Step 5: Check the Traffic Share report for a percentage breakdown of how the pie is split.
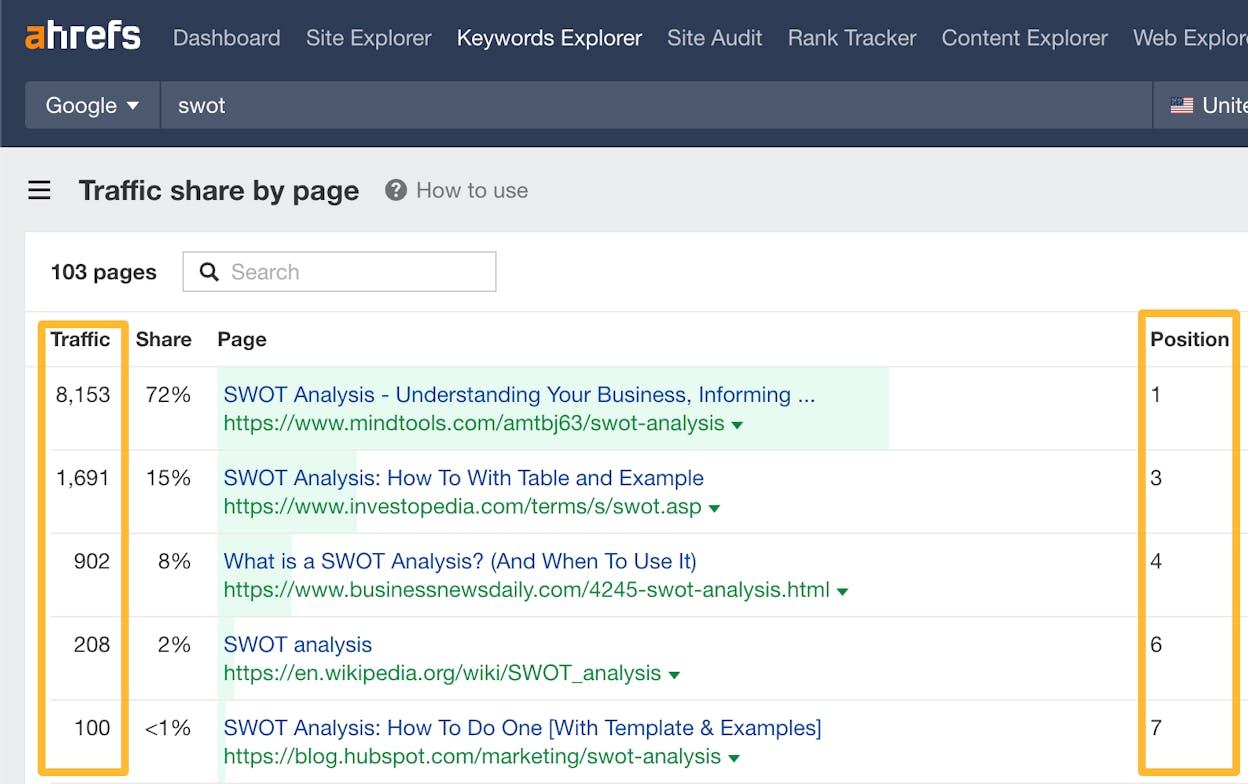
This method is more work upfront, but it gives you a much more accurate picture of SOV in organic search. It also lets you track progress over time since you can rerun the same keyword set monthly or quarterly.
A few things to keep in mind: this is only one channel. Organic search SOV doesn’t equal overall SOV, and it won’t correlate perfectly with market share on its own. The SOV-market share relationship works when you account for all major channels together.
How to Measure SOV in AI Search
Organic search is still the dominant discovery channel for most businesses. But a growing slice of how people find information has shifted to AI-powered engines—ChatGPT, Perplexity, Claude, Gemini, Microsoft Copilot, and Google’s AI Mode.
When someone asks ChatGPT “What’s the best CRM for small businesses?” and your competitor gets mentioned but you don’t, that’s a share of voice problem. It’s the same dynamic as organic search: visibility drives awareness, awareness drives consideration, consideration drives market share. The channel is different. The principle is identical.
The challenge is that traditional SEO tools can’t measure AI search visibility. Google Search Console doesn’t track ChatGPT answers. Ahrefs doesn’t crawl Perplexity citations. You need a purpose-built tool for this.
Analyze AI is designed specifically for this. Here’s how to measure your SOV in AI search step by step.
Step 1: Set Up Competitor Tracking
Start by adding your direct competitors in Analyze AI’s Competitor Overview. The platform tracks how often each competitor is mentioned across AI engines relative to your brand, so you get a rolling view of who’s winning share of voice in AI-generated answers.
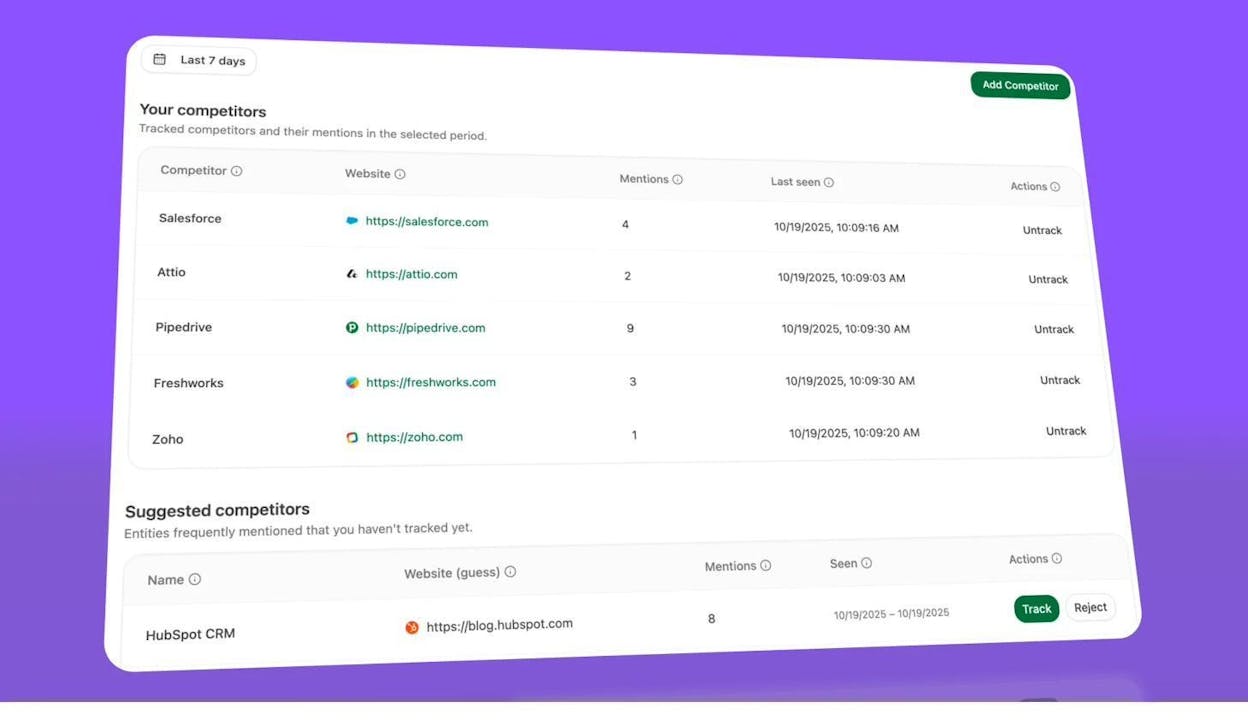
The “Suggested competitors” section automatically surfaces brands that frequently appear alongside yours in AI answers—even ones you might not have thought of as competitors. You can track or reject each suggestion with one click.
Step 2: Track the Prompts That Matter
In traditional SEO, you track keywords. In AI search, you track prompts—the questions people actually type into ChatGPT, Perplexity, or Claude.
Analyze AI lets you add prompts manually, or you can use the Prompt Suggestion feature. The platform analyzes your industry cluster and suggests relevant prompts you should be monitoring. Click “Track” to add them to your daily automated runs.
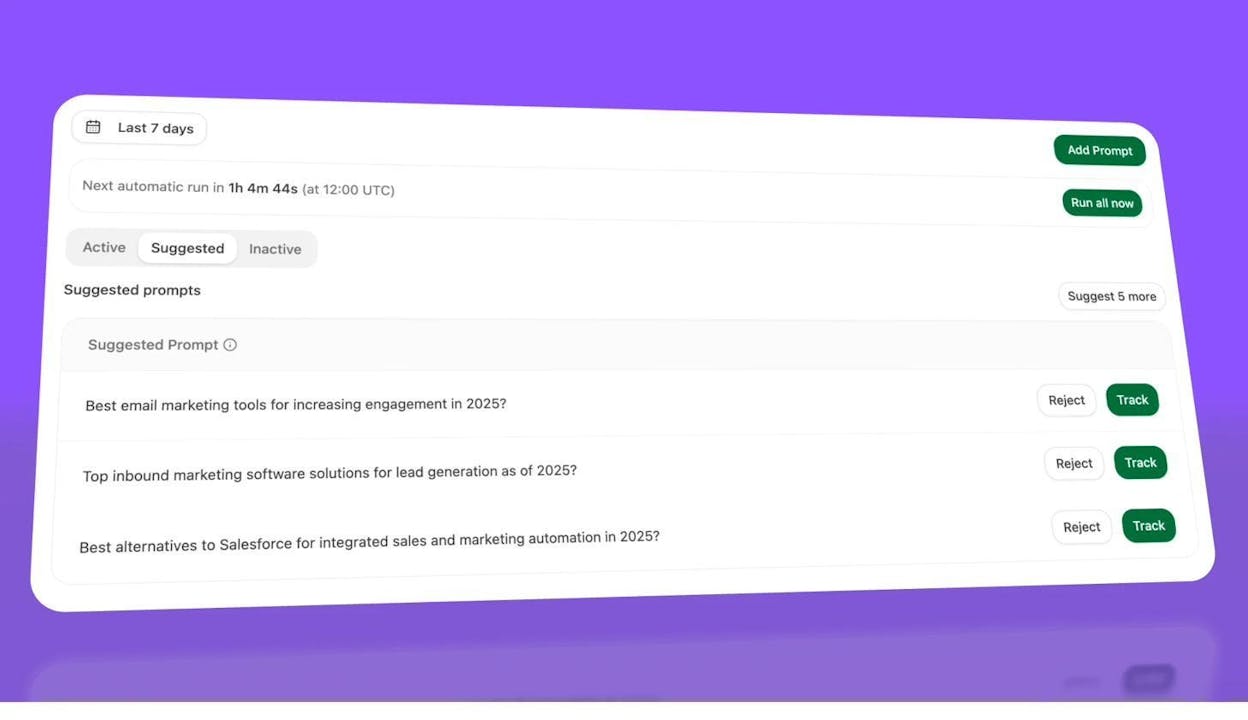
Once tracked, prompts run automatically every day across multiple AI engines. Each prompt gets scored for visibility (whether you appear), sentiment (how positively you’re described), and position (where you rank in the answer).
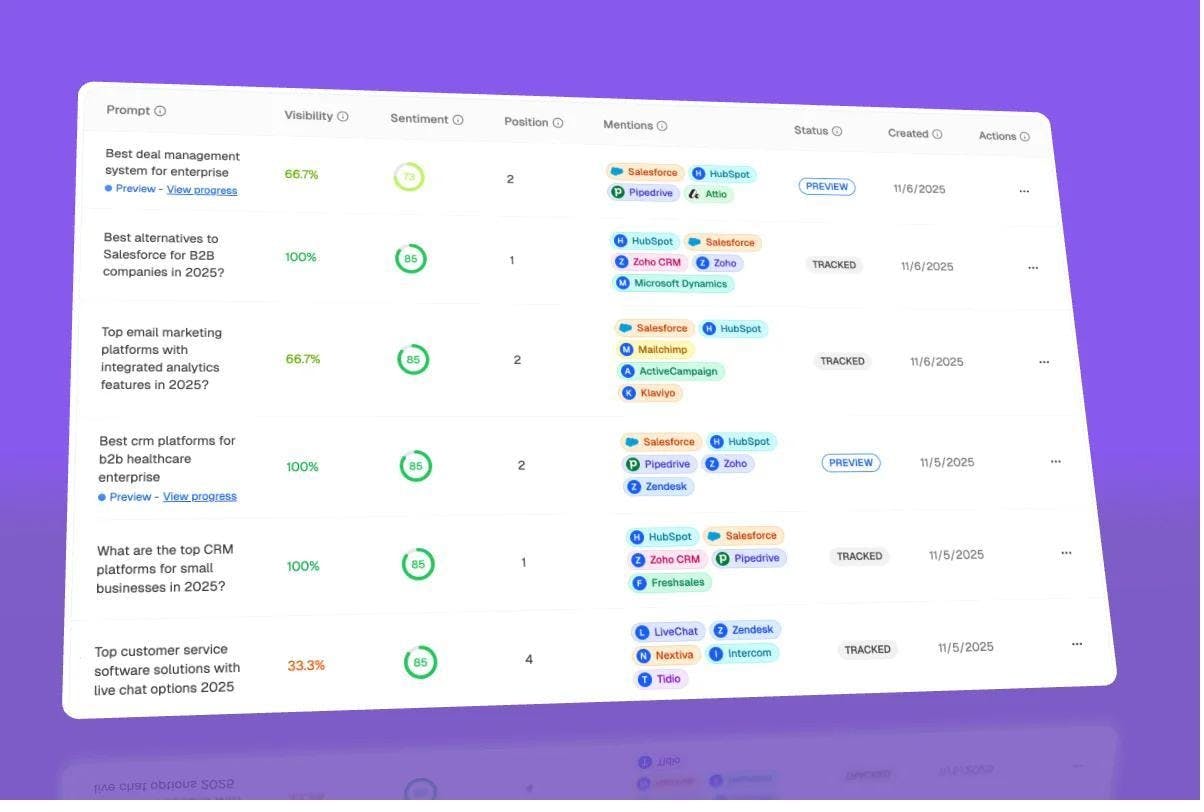
Step 3: Drill Into Prompt-Level Analytics
Click any prompt to see its full analytics. You’ll get a visibility trend over time, presence breakdown by LLM (which engines mention you), and a response timeline showing how AI answers have changed.
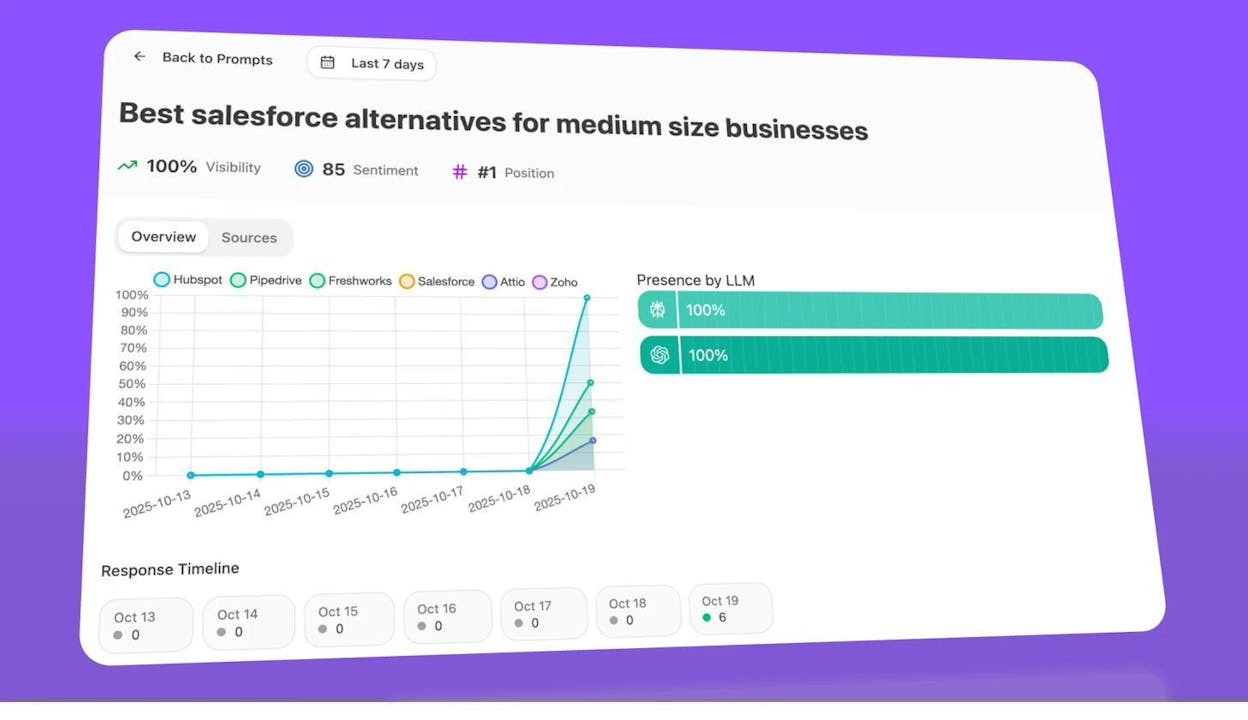
This is where you find the gaps. If your brand appears in Perplexity’s answer for “best CRM alternatives” but not in ChatGPT’s, you know exactly where to focus. Switch to the Sources tab to see which URLs AI engines are citing—and whether your content is among them.
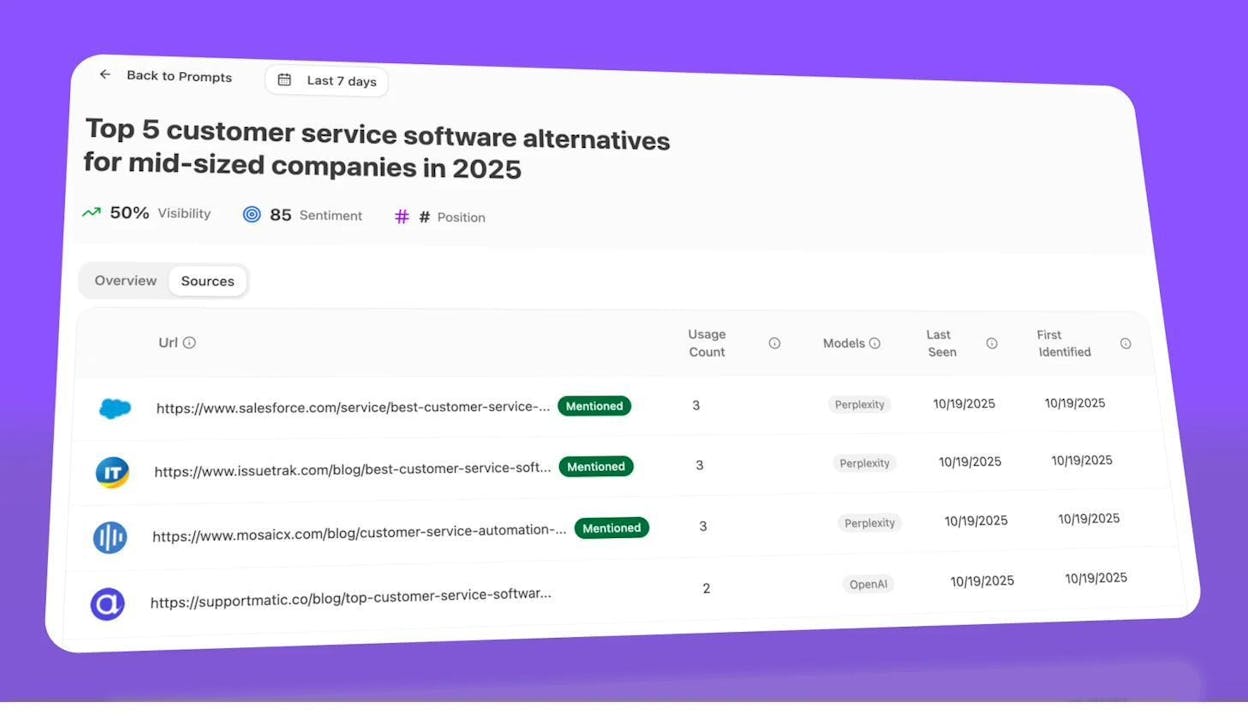
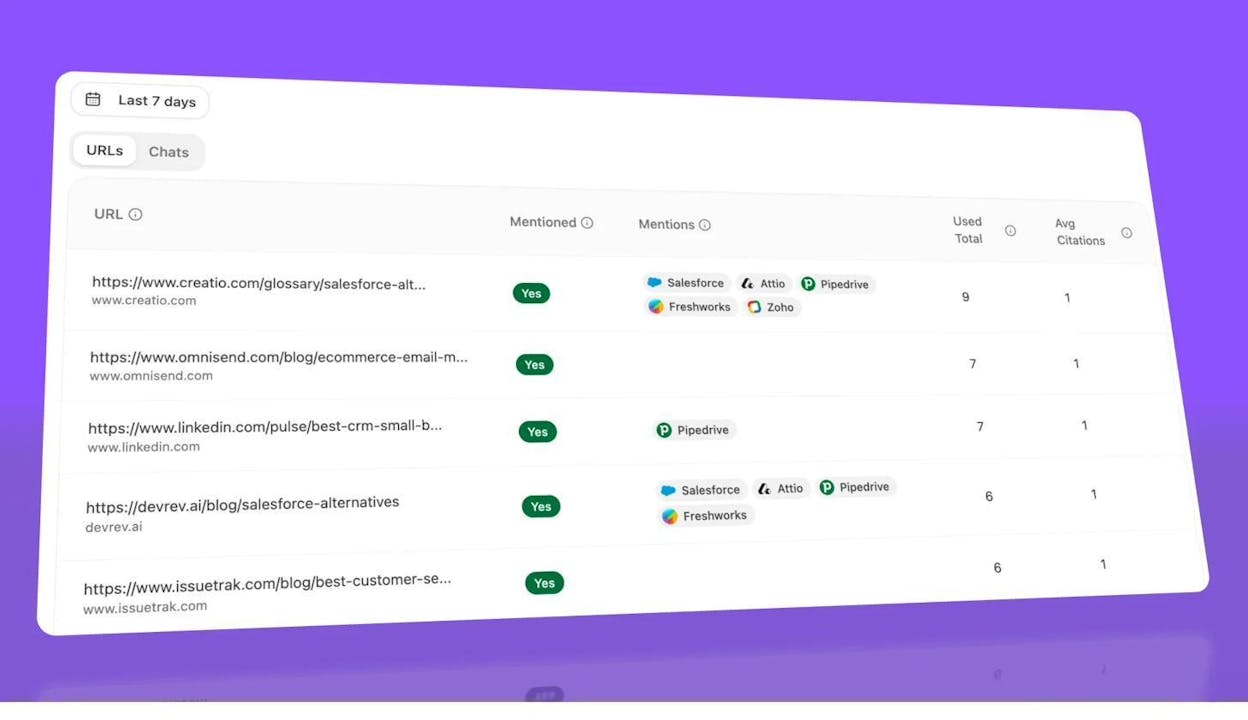
Step 4: Analyze Citation Patterns
The Citation Analytics dashboard shows which of your URLs are being cited by AI engines, how often, and alongside which competitors. This is the AI search equivalent of backlink analysis—it tells you which content is doing the heavy lifting for your visibility.
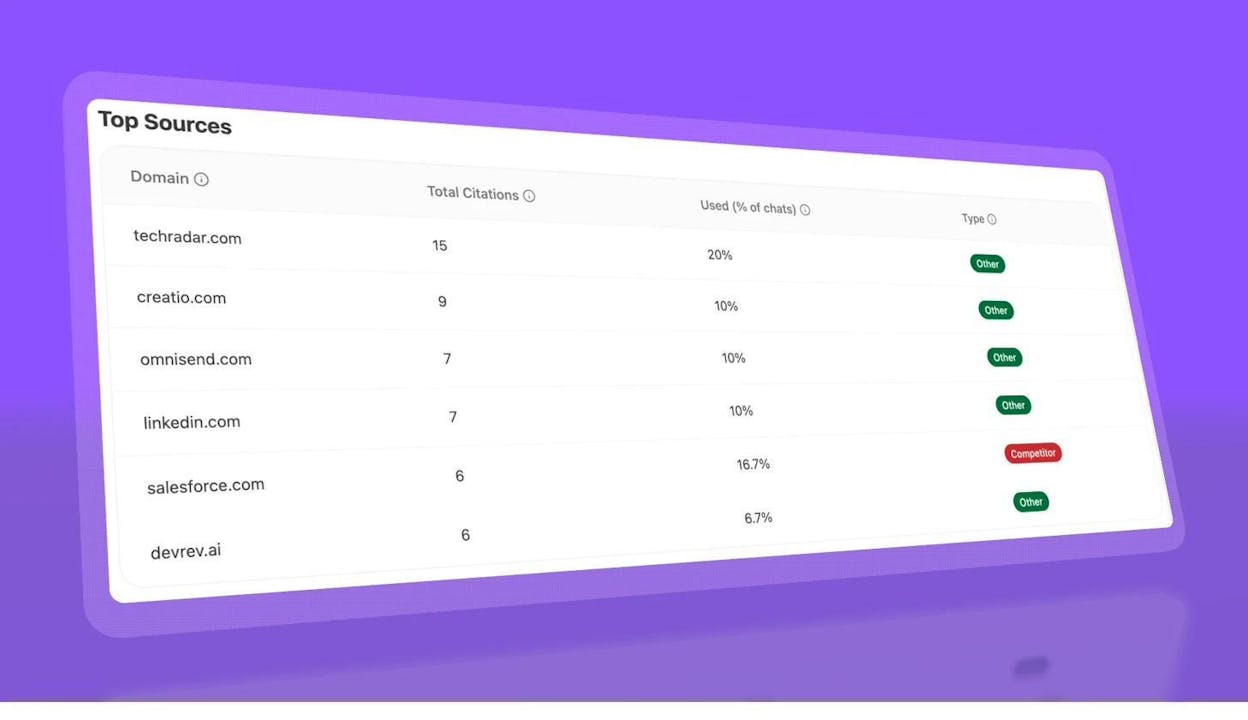
You can also see the Top Sources view, which reveals the most-cited domains across all your tracked prompts. If a competitor’s domain shows up with 15 citations and yours shows up with 2, you have a clear picture of the gap.
Step 5: Measure Actual AI Referral Traffic
Visibility in AI answers is one metric. Actual traffic from AI engines is another—and it’s the one that ties directly to business outcomes. Analyze AI connects to your GA4 data to show total AI referral sessions, their trend over time, and what percentage of your total traffic comes from AI search.
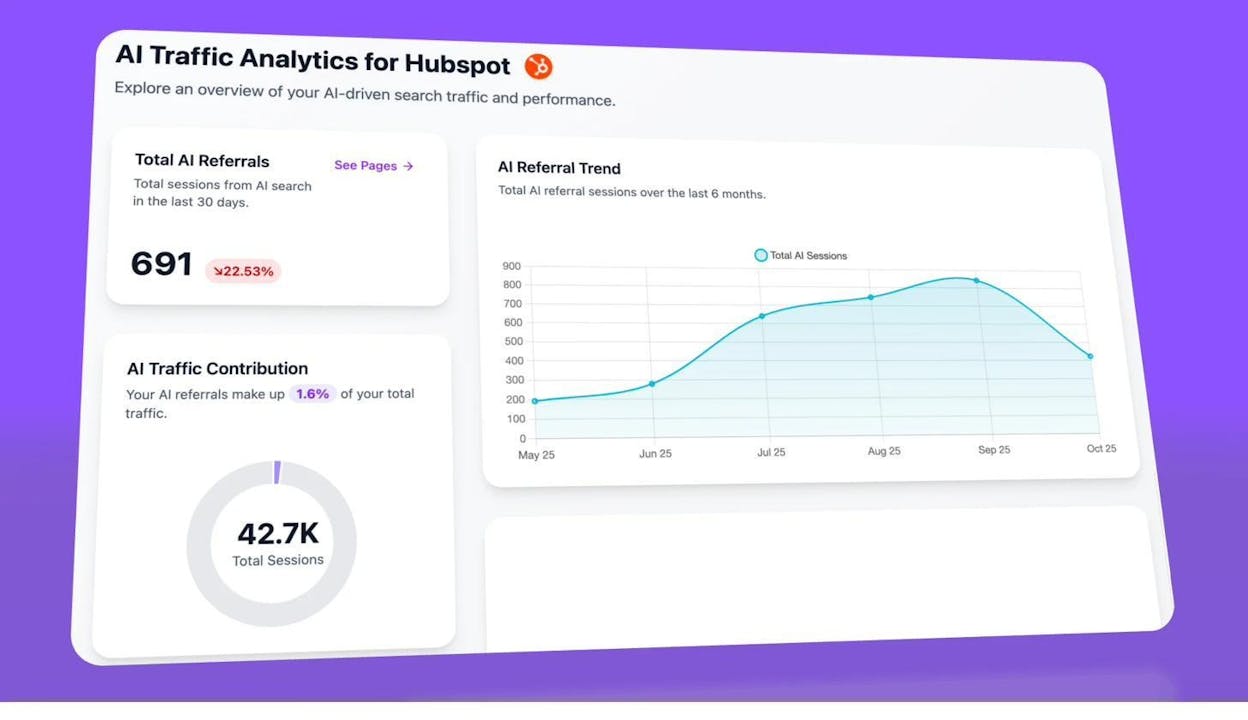
Click “See Pages” to drill into which specific landing pages receive AI traffic, broken down by referring engine and session count.
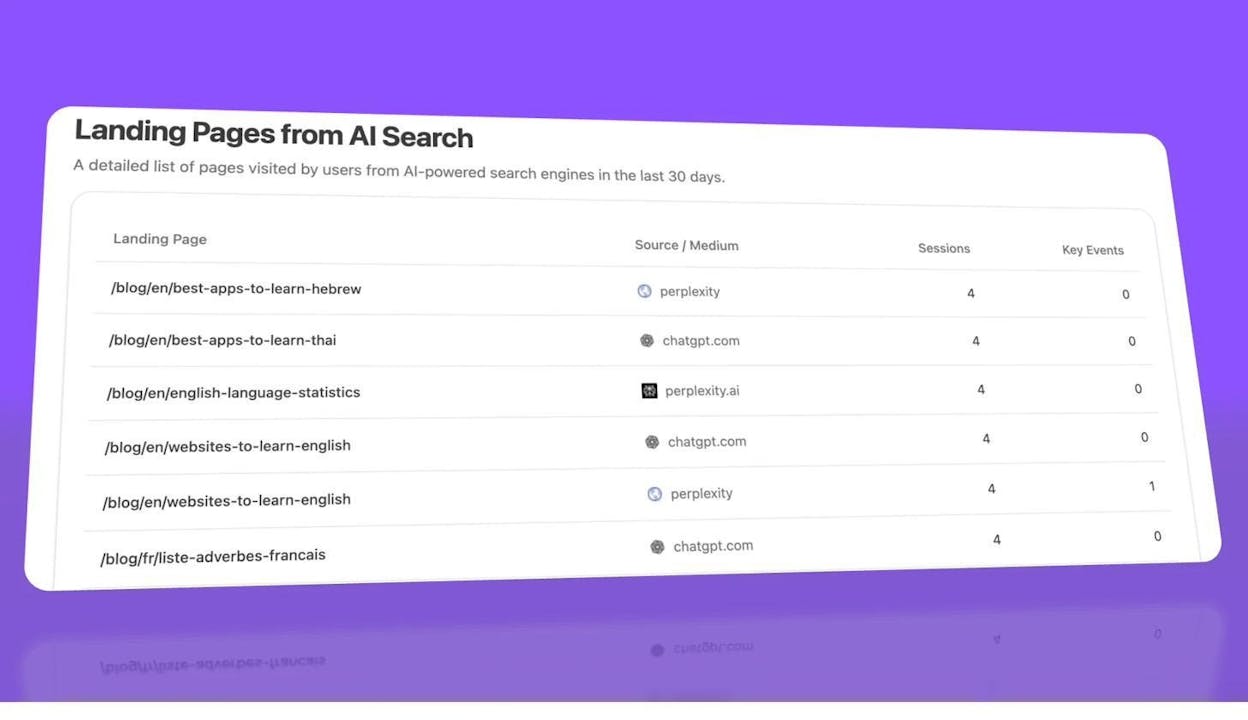
This is where measurement meets action. If your guide on “best project management tools” drives 40 sessions per month from ChatGPT but your “pricing comparison” page drives zero, you know which content format AI engines prefer—and you can create more of what works.
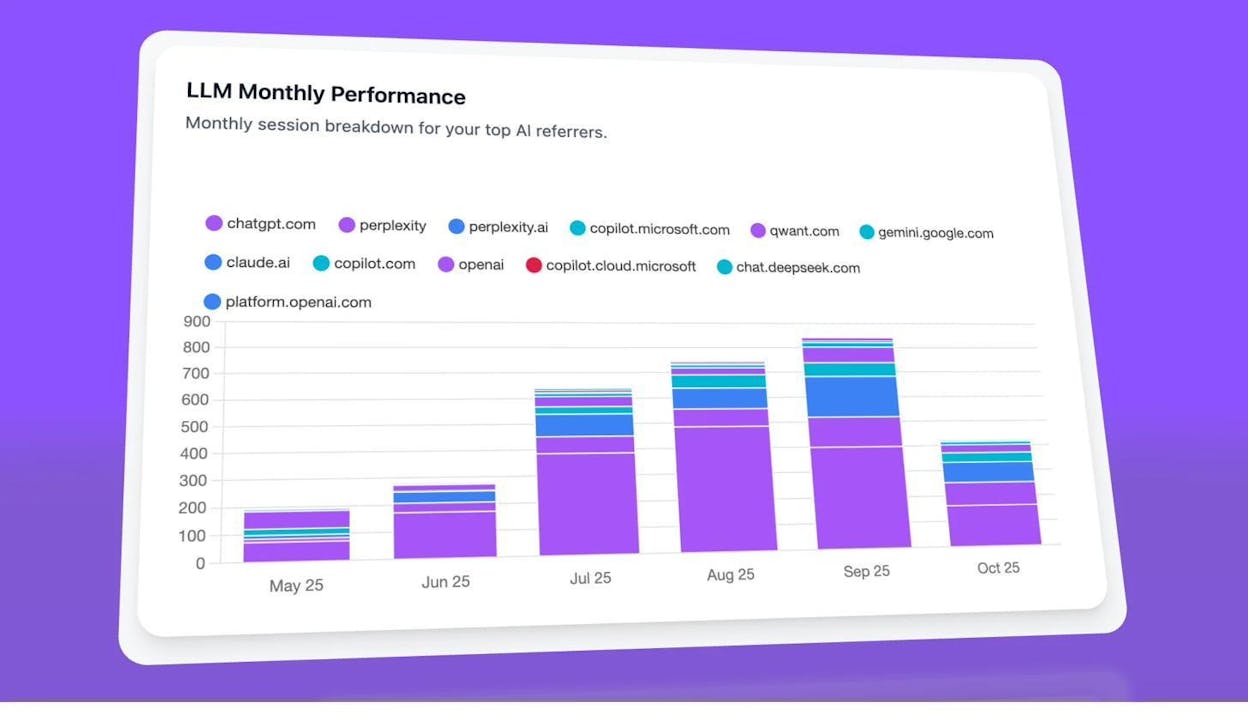
Step 6: Compare Performance Across AI Engines
Not all AI engines behave the same way. ChatGPT might cite you frequently while Claude doesn’t mention you at all. Analyze AI’s engine-level analytics break down your performance by platform so you can prioritize where to invest.
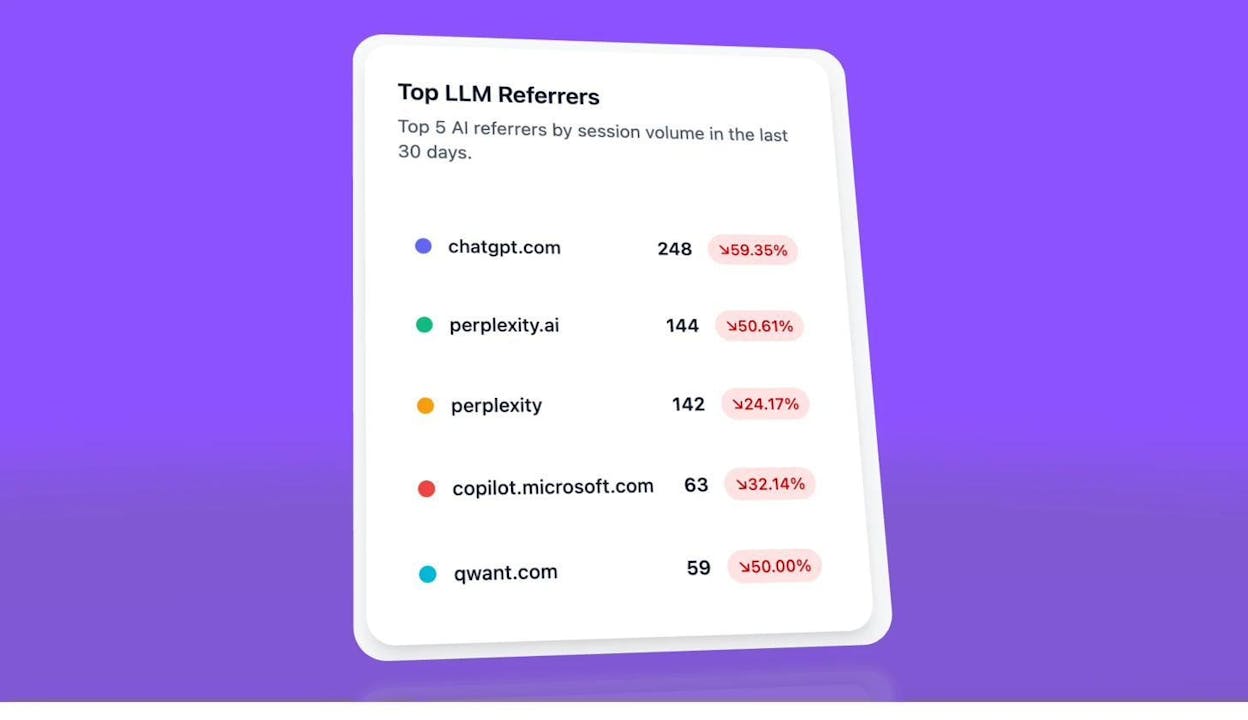
The Top LLM Referrers view ranks each engine by actual sessions sent to your site in the last 30 days, with percentage changes.
Step 7: Monitor Sentiment
SOV isn’t just about being mentioned. It matters how you’re mentioned. If an AI engine consistently recommends your competitor as “the market leader” and describes your product as “a budget alternative,” that sentiment gap affects consideration regardless of mention count.
Analyze AI’s Sentiment dashboard tracks average sentiment scores (0–100) for your brand and each competitor across all tracked prompts.
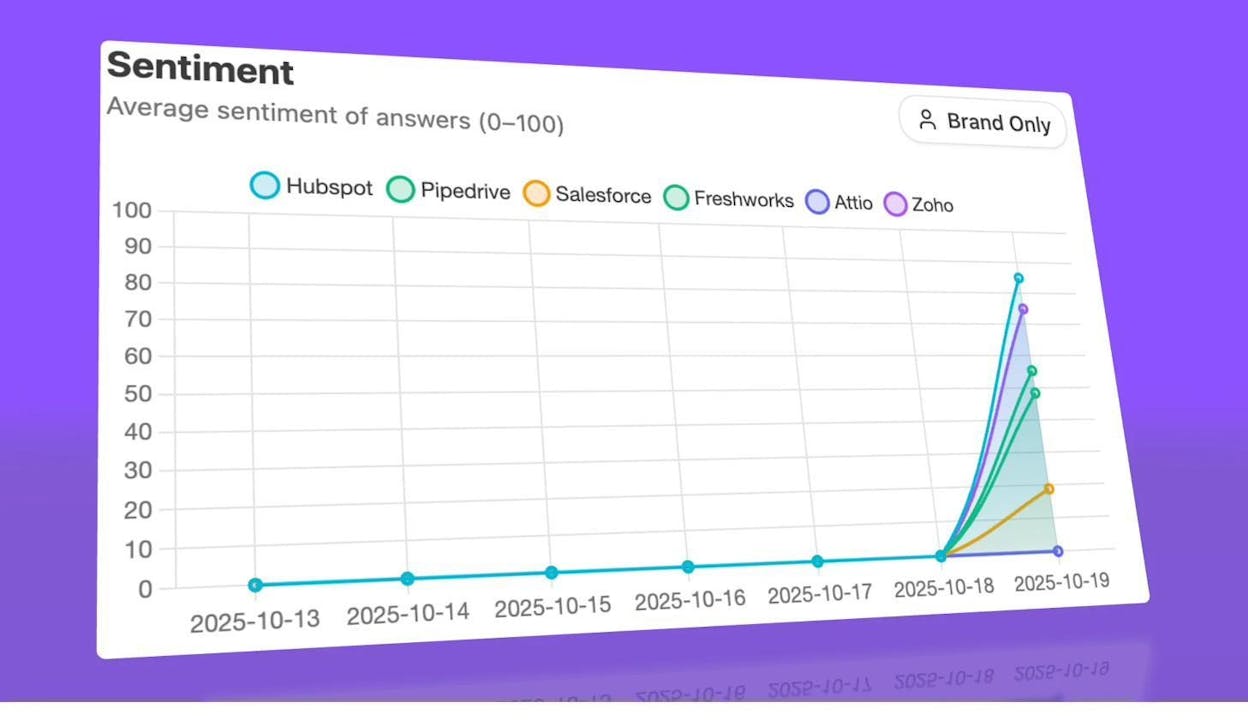
A sustained gap in sentiment—even when visibility is similar—signals a positioning problem that content changes can fix.
Step 8: Find Opportunities Where Competitors Win and You Don’t
The Opportunities dashboard surfaces prompts where your brand is absent but competitors appear. This is the AI search equivalent of a keyword gap analysis.
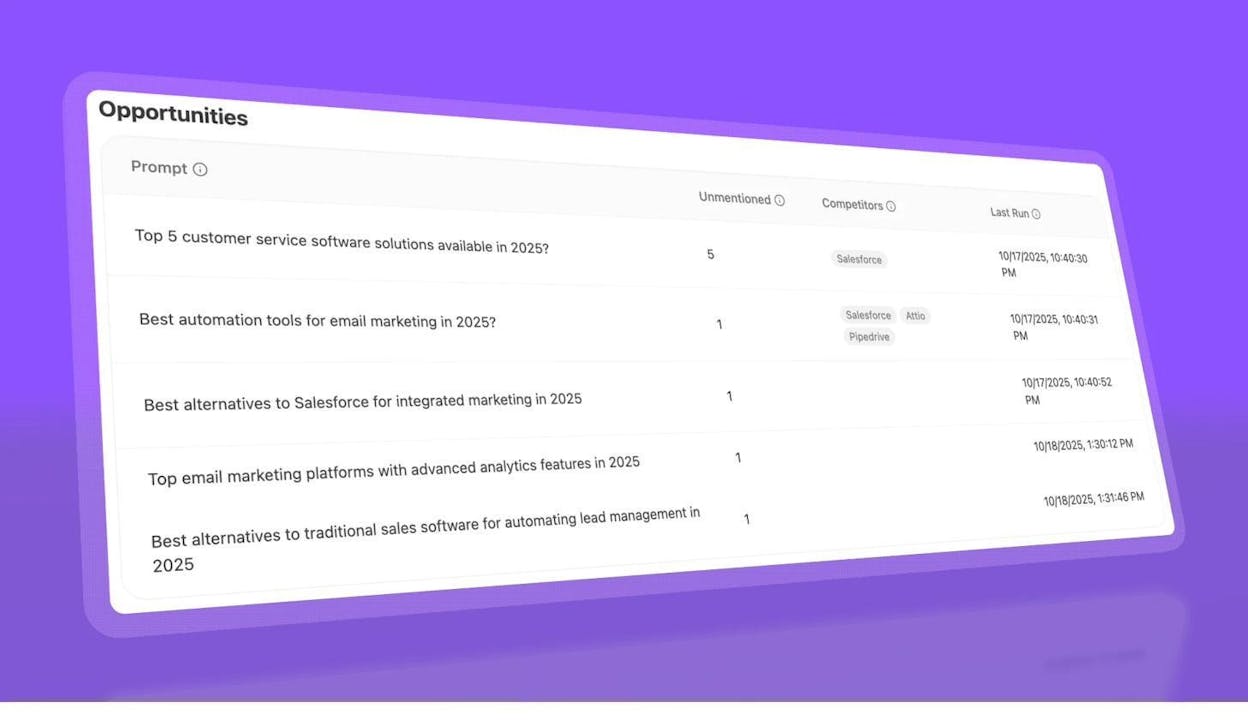
Each row shows a prompt, how many times you were unmentioned, and which competitors appeared instead. These are your highest-leverage content opportunities—create or improve content that directly addresses these prompts, and you close the gap.
For more on how to act on these opportunities, see our guides on how to rank on ChatGPT, how to rank on Perplexity, and how to outrank competitors in AI search.
How to Measure SOV for PPC (Google Ads)
For paid search, the most reliable SOV metric is impression share. Google Ads provides this natively, and it’s always going to be more accurate than data from third-party tools.
Impression share represents the percentage of times your ads were shown out of the total eligible impressions based on your targeting settings, budget, and quality score.
How to find it: In Google Ads, go to Campaigns or Ad Groups and click “Columns.” Under “Competitive metrics,” add “Search impression share.” This will show your IS as a percentage next to each campaign.
Google also provides two companion metrics worth tracking: “Search lost IS (budget)” tells you how much impression share you’re losing because of insufficient budget, and “Search lost IS (rank)” tells you how much you’re losing due to ad rank issues (bid amount, quality score, or ad relevance).
To calculate your PPC SOV against specific competitors, you’d need to combine impression share data with auction insights reports. Go to the Keywords tab, select relevant keywords, and click “Auction insights.” This shows you which competitors appear alongside you, their impression share, and their overlap rate.
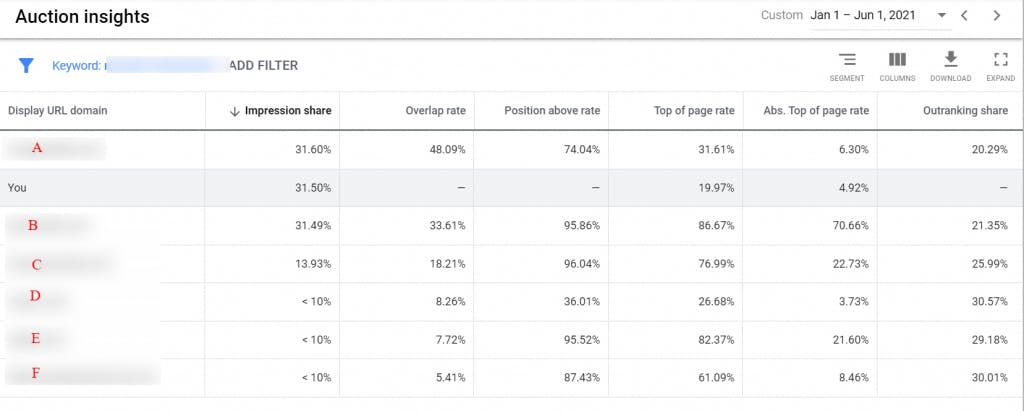
A key limitation: impression share is relative to your targeting settings. If you target a single exact-match keyword in a small geographic area, you can achieve 100% impression share without much spend. That doesn’t mean you have high SOV overall—it means you own one tiny slice. For meaningful PPC SOV measurement, track impression share across your full keyword portfolio, not just individual campaigns.
A practical PPC SOV goal might look like this: “Increase search impression share from 45% to 65% among UK-based searches for project management keywords by Q4.”
How to Measure SOV on Social Media
Social media SOV is measured through brand mentions. The concept is simple: track how often your brand is mentioned compared to competitors across relevant social platforms, and calculate your share.
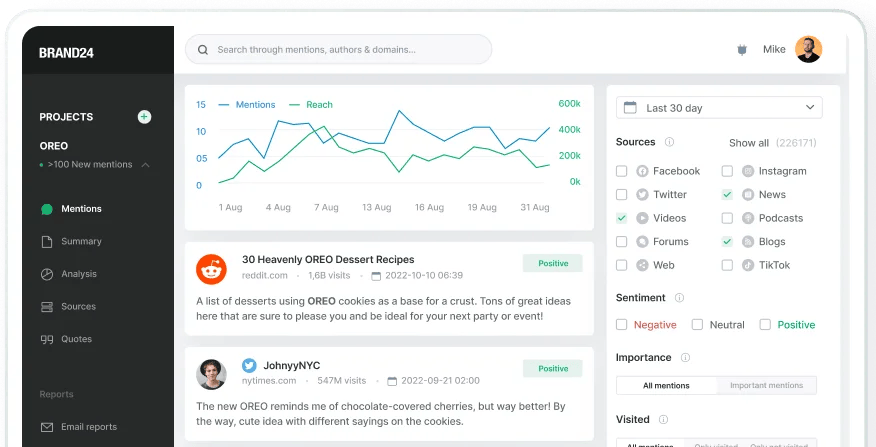
Step 1: Choose a Social Monitoring Tool
You need a tool that tracks brand mentions across social channels. Options include Brandwatch, Brand24, Mention, Sprout Social, and Hootsuite. Each works on the same principle—you enter brand names as keywords and the tool tracks mentions over time.
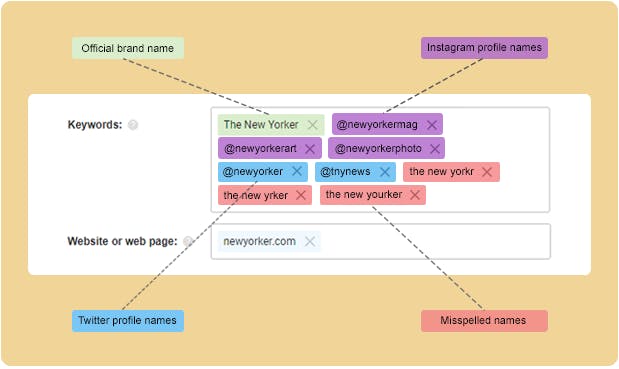
Step 2: Set Up Monitoring for Your Brand and Competitors
Add your brand name and your competitors’ brand names as tracked keywords. Most tools let you specify which platforms to monitor (Twitter/X, LinkedIn, Reddit, Instagram, Facebook, YouTube). Choose the platforms where your audience is most active.
Step 3: Pull Mention Counts and Calculate SOV
Over a set time period (weekly, monthly, or quarterly), pull the total number of mentions for each brand. Then apply the formula:
Social SOV = Your Brand Mentions / Total Mentions (All Tracked Brands) × 100
If your brand gets 133 mentions, Competitor A gets 200, and Competitor B gets 167—your total market mentions are 500, and your SOV is 26.6%.
Step 4: Layer in Sentiment
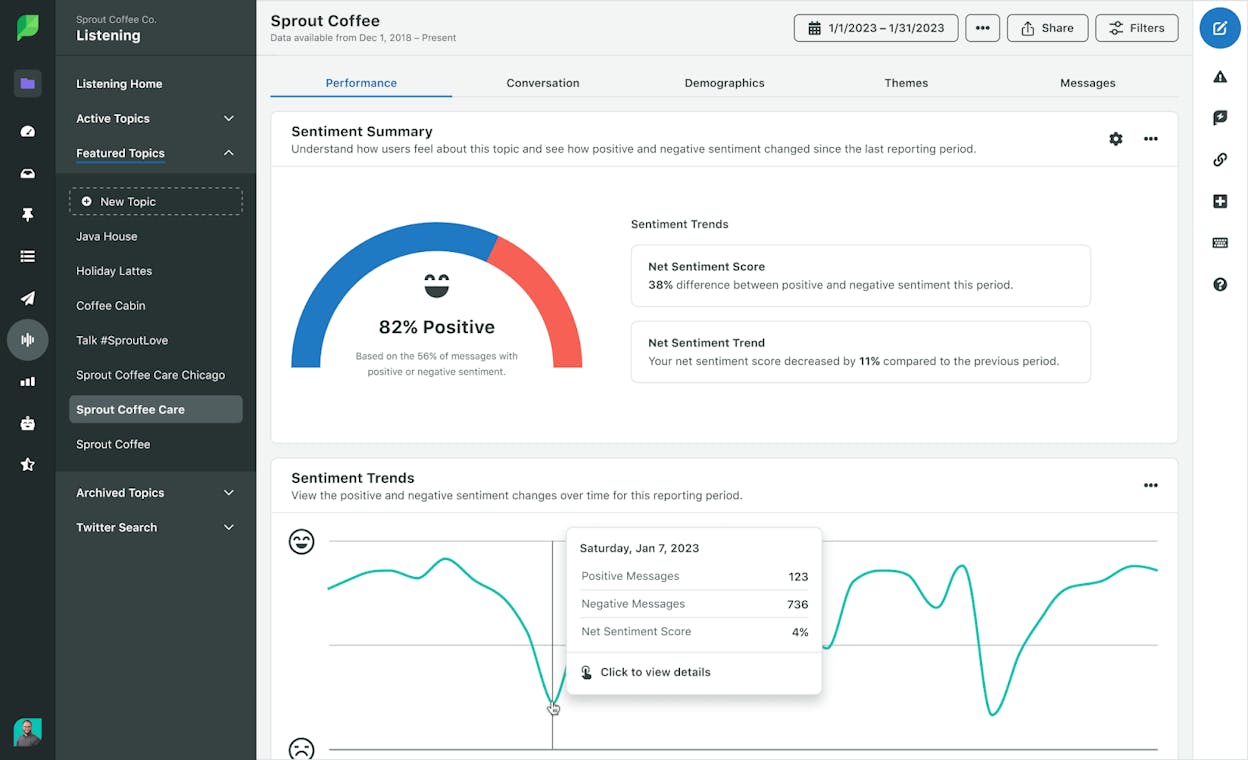
Raw mention count doesn’t tell the full story. A brand that gets 500 mentions—400 of which are complaints—has a very different SOV picture than a brand with 300 mostly positive mentions. Most social monitoring tools provide sentiment analysis (positive, negative, neutral), and this should be part of your SOV tracking.
A few caveats on social SOV: Bots inflate mention counts on some platforms. Apply filters to exclude spam and bot activity when your monitoring tool supports it. Also, social SOV can be volatile—a single viral post or crisis can spike or crash your numbers in a single day. Use rolling averages (7-day or 30-day) for trend analysis rather than raw daily counts.
How to Measure SOV in Earned Media
Earned media includes press coverage, guest articles, podcast appearances, review sites, and any media mention your brand receives without paying for it. This is the original “share of voice” from the pre-digital era, and it’s still relevant.
For Digital Earned Media
Use tools like Meltwater, Cision, or Google Alerts to track media mentions of your brand and competitors. The process is similar to social monitoring: track brand name mentions, count them over a time period, and calculate your share.
Focus on quality as well as quantity. A feature in a top-tier industry publication carries more weight than a brief mention in a low-authority blog. Some media monitoring tools assign influence scores or reach estimates to each mention, which can help weight your SOV calculation.
For Traditional Mass Media (TV, Radio, Print)
The standard metric for mass media is Gross Rating Points (GRP). GRP is calculated by multiplying audience reach by exposure frequency during a specific period.
For example: if your ad airs five times with 12% reach and three times with 15% reach, your GRP is (5 × 12) + (3 × 15) = 60 + 45 = 105.
Your SOV in mass media is your GRP divided by the total category GRP. Serious media houses provide these metrics as part of their reporting, and they’re often used as pricing units for campaign costs.
Most digital-first marketing teams won’t need to track mass media SOV. But if your brand runs TV, radio, or print campaigns, these numbers should be part of your overall SOV picture.
SOV Across Channels: A Quick Comparison
Each channel requires different metrics, tools, and methods. Here’s a summary:
|
Channel |
Key Metric |
Primary Tools |
Update Frequency |
Difficulty |
|---|---|---|---|---|
|
Organic Search |
Traffic share / Visibility % |
Ahrefs, Semrush, Analyze AI Keyword Tools |
Monthly |
Medium |
|
AI Search |
Mention rate / Citation share / AI sessions |
Daily (automated) |
Low |
|
|
PPC |
Impression share |
Google Ads (native) |
Real-time |
Low |
|
Social Media |
Brand mentions share |
Brandwatch, Brand24, Sprout Social |
Weekly/Monthly |
Medium |
|
Earned Media |
Media mention share |
Meltwater, Cision, Google Alerts |
Monthly |
Medium |
|
Mass Media |
GRP share |
Media house reports |
Per campaign |
High |
The channels with the highest strategic impact for most B2B and SaaS brands are organic search and AI search. For B2C brands, social media and paid search typically play a larger role. Prioritize measuring the channels where your audience spends the most time.
How to Improve Your Share of Voice
Measuring SOV is step one. Improving it is where the results come from. Here are actionable strategies by channel.
Improve Organic Search SOV
The most effective way to grow organic search SOV is to publish high-quality content targeting the keywords where you have gaps. Pull up your keyword tracking data, identify where competitors outrank you, and create content that’s more comprehensive, more actionable, and more current than what’s currently ranking.
Specifically: conduct a content strategy audit to find topics where competitors rank and you don’t. Then build a publishing calendar around those gaps. Update existing content that’s declining in rankings—refreshed articles often recover lost positions faster than new ones.
Internal linking also matters. Use strategic internal links to pass authority to your most important pages. And don’t ignore technical SEO—crawl errors, slow page speed, and poor mobile experience all drag down visibility.
Improve AI Search SOV
AI search SOV responds to different levers than traditional SEO, though there’s significant overlap. Based on analysis of 65,000+ AI citations, the sources AI engines cite most tend to share several traits: they’re well-structured, they contain specific data and examples, they’re authoritative (high domain authority, many backlinks), and they answer questions directly and concisely.
Here’s what to do:
Use the Opportunities dashboard. As shown earlier, Analyze AI identifies the exact prompts where competitors appear and you don’t. Each one of these is a content brief. Create or improve content that directly answers these prompts.
Double down on pages that already receive AI traffic. Check the AI Traffic By Page report. If certain content formats or topics already drive sessions from AI engines, create more content in the same format. AI engines tend to favor structured, factual, comparison-oriented content—so more of what works compounds your results.
Monitor your citations. Check which of your URLs are being cited and which aren’t. Content that gets cited tends to have clear, factual claims, structured data (like lists and tables), and strong E-E-A-T signals. Make sure your best content has all of these.
Optimize by engine. Different AI engines behave differently. If you’re getting cited by Perplexity but not ChatGPT, study what Perplexity is citing and look for patterns. Analyze AI’s engine-level analytics make this comparison straightforward.
For a deep dive, read our guides on answer engine optimization and what is generative engine optimization.
Improve PPC SOV
If your impression share is low due to budget, the math is obvious—increase budget on high-performing campaigns. If it’s low due to ad rank, focus on improving quality scores: tighten keyword-ad-landing page alignment, improve ad copy relevance, and increase landing page speed.
Also look at auction insights to identify where specific competitors are beating you. Sometimes a competitor owns a keyword segment that you’re barely present in—increasing bids on those specific segments can shift the balance.
Improve Social Media SOV
Content volume matters on social, but engagement drives mentions. Create content that people want to share and talk about—original research, strong opinions, practical tools, and timely takes. Employee advocacy programs can amplify reach without paid spend. And engage directly with industry conversations: commenting on and sharing others’ content increases your visibility in the feed.
Improve Earned Media SOV
Earn media coverage by having something worth covering. Publish original research and data studies. Offer expert commentary on industry trends. Build relationships with journalists and editors in your space before you need them. Repurpose earned media wins across your other channels to extend their impact—a press mention in a top-tier outlet can be shared on social, referenced in blog content, and highlighted in email campaigns.
Share of Voice vs. Related Metrics
SOV is often confused with similar metrics. Here’s how they differ:
|
Metric |
What It Measures |
Scope |
|---|---|---|
|
Share of Voice (SOV) |
Your brand’s visibility relative to competitors on a specific channel |
Channel-specific |
|
Share of Market (SOM) |
Your revenue or customer count relative to the total market |
Business-wide |
|
Share of Search |
How often people search for your brand name vs. competitors |
Brand awareness proxy |
|
Search Visibility |
The percentage of all possible organic traffic your site captures for tracked keywords |
SEO-specific |
Share of market measures outcomes (revenue, customers). Share of voice measures inputs (visibility, attention). The research shows that inputs drive outcomes over time, which is why SOV is a leading indicator and SOM is a lagging one.
Share of search is a narrower metric that’s useful as a brand awareness proxy. It looks specifically at branded search volume—how many people search for “your brand name” versus “competitor brand name.” It’s a good complement to SOV but doesn’t replace it, because SOV captures non-branded visibility too.
Final Thoughts
SOV measurement is the starting point for eSOV, which is the actual driver of market share growth. The goal isn’t to measure for measurement’s sake—it’s to identify where you’re underinvesting in visibility relative to competitors, and then close those gaps.
The channels worth measuring depend on your business. But for most brands today, organic search and AI search together represent the two largest organic visibility opportunities. Traditional search still drives the majority of discovery traffic. AI search is growing fast and already represents a meaningful channel for many companies—Kylian AI scaled from 200 to 1,000+ monthly AI sessions in six months by treating it as a measurable channel.
If you’re not measuring your visibility in AI search yet, you’re missing a piece of the SOV picture that gets larger every quarter. You can start tracking your AI search visibility with Analyze AI and see where you stand across ChatGPT, Perplexity, Claude, Gemini, and Copilot—alongside the competitor monitoring tools and brand tracking software you already use for other channels.
Ernest
Ibrahim


