


Summarize this blog post with:
In this article, you’ll learn what SEO forecasting is, why it matters for getting budget and resources, and how to build forecasts that actually persuade stakeholders. You’ll walk away with step-by-step methods for predicting organic traffic, benchmarking against competitors, and—because search is evolving—forecasting your visibility across AI engines like ChatGPT, Perplexity, and Claude.
Table of Contents
What Is SEO Forecasting?
SEO forecasting is the process of using historical data to estimate a website’s future organic search performance. You might forecast traffic, revenue, keyword rankings, or traffic value—whatever metric ties most directly to the goals your team cares about.
A typical forecast works like this: you take historical performance data (from Google Search Console, Google Analytics, or a third-party tool like Ahrefs), feed it into a statistical model, and project a trend line into the future. The output is a graph with a predicted trajectory and a confidence interval—an upper and lower bound that shows the range of likely outcomes.
![[Screenshot: Example traffic forecast graph showing historical data as a solid line and the future prediction as a dotted line with an 80% confidence interval shaded around it]](https://www.datocms-assets.com/164164/1774439881-blobid0.png?auto=format,compress&w=1248&fit=max)
That confidence interval is important. Forecasts are not guarantees. They are informed estimates based on patterns in the data. The value is not in the precision of the prediction itself, but in what the prediction enables you to do: secure budget, set realistic goals, prioritize projects, and make a case for change.
Why SEO Forecasting Matters
The reasons you’d invest time in SEO forecasting depend on your role. But in every case, the core benefit is the same: you move from opinion-based conversations to data-backed ones.
Getting buy-in for SEO investment
Most leadership teams think in terms of revenue projections, not keyword rankings. A forecast lets you speak their language. Instead of saying “we need to publish more content,” you can say “at current effort levels, organic traffic will grow 12% year over year. Our target is 25%. To close that gap, we need X additional resources.”
That framing changes the conversation entirely. You are no longer asking for budget. You are showing what happens with and without it.
Setting realistic goals
Companies often set organic growth targets without consulting the SEO team first. A forecast gives you a reality check. If leadership wants 30% growth but your data shows a 10% trajectory, you have evidence to push back—or to explain exactly what it would take to hit the more aggressive target.
Prioritizing projects and resources
When you forecast at the page or section level, you can see which parts of your site are gaining momentum and which are stalling. That makes resource allocation straightforward: invest more in what’s working, intervene where performance is declining, and deprioritize areas with low upside.
Justifying strategy changes
A forecast can reveal that your current trajectory puts you behind competitors within six months. That kind of evidence makes it much easier to justify a shift in strategy, whether that means investing in a new content cluster, building more backlinks, or reallocating headcount.
Proving SEO value to stakeholders
For agency teams, forecasts can elevate a pitch above competitors. For in-house SEOs, forecasts are a tool for proving the channel’s value over time. When you compare actual performance against your original forecast, you demonstrate that SEO is predictable, measurable, and worth continued investment.
If you want to dive deeper into how to tie SEO strategy to business goals, we break that down in our content strategy guide.
The Two Types of SEO Forecasts
Before you build anything, you need to decide which approach fits your situation. There are two broad categories: keyword-level forecasts and site-level forecasts. They serve different purposes.
Keyword-level forecasts
A keyword-level forecast estimates future traffic for specific search terms. The basic formula is:
Estimated traffic = Search volume × Click-through rate (CTR)
This approach is useful when you are building a business case for a new content initiative or evaluating a specific keyword opportunity. For example, if you’re planning to target a keyword cluster around “project management software,” a keyword-level forecast tells you approximately how much traffic you can expect if you rank in positions 1 through 5.
The limitations are real, though. The formula above only accounts for the keywords you manually enter, and most pages rank for dozens or even hundreds of terms beyond the primary target. You also need a CTR model, and generic CTR curves may not represent your site accurately. Your site’s brand recognition, SERP feature presence, and title tag quality all affect click-through rate.
To improve accuracy, use your own CTR data from Google Search Console rather than industry averages. Pull your impressions and clicks by position, and build a custom CTR curve that reflects how users actually interact with your listings.
![[Screenshot: Google Search Console Performance report showing CTR by average position for a site’s queries]](https://www.datocms-assets.com/164164/1774439881-blobid1.png?auto=format,compress&w=1248&fit=max)
Several practitioners have shared free spreadsheet templates for keyword-level forecasting:
|
Template Creator |
What It Does |
|---|---|
|
Estimates traffic based on target rankings and custom CTR curves |
|
|
Google Sheets template with volume and CTR inputs |
|
|
Includes seasonality adjustments and revenue projections |
These templates are a good starting point, but they all share the same weakness: they only account for the keywords you explicitly track, not the long tail of queries each page will naturally attract.
A better alternative is to use a metric like Traffic Potential, which estimates the total organic traffic the top-ranking page for your keyword receives across all the terms it ranks for—not just the one you targeted. This gives you a more realistic picture of what a page can earn if it reaches the top of the results.
![[Screenshot: Ahrefs Keywords Explorer showing the Traffic Potential metric for a keyword, with the number displayed alongside search volume]](https://www.datocms-assets.com/164164/1774439888-blobid2.png?auto=format,compress&w=1248&fit=max)
Site-level forecasts
Site-level forecasts take a broader view. Instead of projecting traffic for individual keywords, they use historical site or section performance data and apply time-series models to project future trends.
This approach is better for:
-
Estimating total organic growth for annual planning
-
Comparing your trajectory against competitors
-
Identifying whether your overall SEO program is accelerating or decelerating
-
Building executive-level presentations where keyword-level detail would be distracting
The most common models for site-level SEO forecasting include Prophet (developed by Meta) and SARIMA (Seasonal AutoRegressive Integrated Moving Average). Prophet is particularly popular because it handles seasonality and trend changes well, and it’s accessible through free tools like Google Colab without requiring deep statistical knowledge.
First-Party vs. Third-Party Data
Your forecast is only as good as the data behind it. There are two sources, and each has trade-offs.
First-party data (Google Analytics, Google Search Console)
If you want the most accurate estimate of your own site’s future performance, first-party data is the best input. Google Analytics gives you actual session and conversion data. Google Search Console gives you impressions, clicks, and average position for every query your site appeared for.
First-party data is also more granular. It captures daily fluctuations and seasonal patterns that third-party tools may smooth over. If you need to model seasonality—say, your business sees a major traffic spike in Q4—first-party data is essential.
The downside: first-party data only covers your site. It tells you nothing about your competitors.
![[Screenshot: Google Analytics traffic trend graph showing organic sessions over a 12-month period with visible seasonal patterns]](https://www.datocms-assets.com/164164/1774439888-blobid3.png?auto=format,compress&w=1248&fit=max)
Third-party data (Ahrefs, Semrush, Analyze AI)
Third-party tools like Ahrefs, Semrush, and Analyze AI fill that gap. They let you pull estimated traffic, keyword rankings, and competitive data for any domain—not just your own.
The trade-off is precision. Third-party traffic estimates are modeled, not measured. They won’t match your Google Analytics numbers exactly. But they are consistent across domains, which makes them ideal for competitive benchmarking. When you forecast your site against three competitors, you need all four datasets to come from the same source for the comparison to be valid.
At Analyze AI, we also track a dimension that traditional SEO tools miss: your brand’s visibility across AI search engines. More on that in the next section.
Use this as a rule of thumb:
|
Scenario |
Best Data Source |
|---|---|
|
Forecasting your own site’s traffic with maximum accuracy |
First-party (GSC + GA) |
|
Forecasting your site vs. competitors |
Third-party (Ahrefs, Semrush) |
|
Forecasting your AI search visibility and citations |
|
|
Seasonality-sensitive forecasts |
First-party (daily granularity) |
|
Annual planning with executive stakeholders |
Blend of first-party and third-party |
How to Build an SEO Traffic Forecast (Step by Step)
Here is a practical workflow you can follow today. We’ll use third-party data and a free forecasting tool, since this approach lets you forecast both your own site and your competitors.
Step 1: Export your historical traffic data
Go to Ahrefs Site Explorer and enter your domain. Navigate to the Overview page and find the Organic Traffic chart under the “Organic search” tab. Set the time period to “All time” to get the longest possible historical dataset, then click Export > CSV to download the file.
![[Screenshot: Ahrefs Site Explorer overview page with the Organic Traffic chart highlighted and the Export > CSV button circled]](https://www.datocms-assets.com/164164/1774439894-blobid4.jpg?auto=format,compress&w=1248&fit=max)
Your exported CSV should have two columns: one for the date and one for organic traffic. If you’re using a different tool, reformat your export to match this structure before uploading.
![[Screenshot: A spreadsheet showing two columns — Date and Organic Traffic — with sample rows of monthly data]](https://www.datocms-assets.com/164164/1774439896-blobid5.png?auto=format,compress&w=1248&fit=max)
Repeat this process for each competitor you want to include in your forecast. Download one CSV per domain.
Step 2: Choose your forecasting tool
You have several options depending on your technical comfort level.
For non-technical users: Use a Google Sheets template like the ones linked in the keyword-level forecasts section above. These require no coding.
For users comfortable with Google Colab: Use a Prophet-based notebook. Prophet is a time-series forecasting model that handles trends and seasonality automatically. Patrick Stox from Ahrefs created a set of open-source Google Colab notebooks that accept the CSV format described above and output forecast graphs instantly. There are separate notebooks for:
-
Single-site traffic forecasts
-
Single-site traffic value forecasts
-
Multi-site competitor traffic comparisons (2, 3, 4, or 5 sites)
-
Multi-site competitor traffic value comparisons
-
Page-level competitor traffic comparisons
For data teams: Build custom models using Python libraries like Prophet, statsmodels (SARIMA), or scikit-learn. This gives you full control over parameters, confidence intervals, and visualization.
Step 3: Run your forecast
If you’re using a Google Colab notebook:
-
Open the notebook link and click File > “Save a copy in Drive”
-
Click Runtime > “Run all”
-
When prompted, upload your CSV file(s) by clicking “Choose Files” and selecting the downloaded exports
![[Screenshot: Google Colab interface showing the “Run all” option in the Runtime menu and the file upload widget below the code cells]](https://www.datocms-assets.com/164164/1774439899-blobid6.jpg?auto=format,compress&w=1248&fit=max)
The notebook will process your data and generate a forecast graph. The output typically includes a trend line (your predicted future performance), a confidence interval (the range of likely outcomes), and markers for known events like Google core updates.
![[Screenshot: A completed traffic forecast graph showing the historical data, the projected trend line extending 12 months into the future, and the shaded confidence interval]](https://www.datocms-assets.com/164164/1774439901-blobid7.png?auto=format,compress&w=1248&fit=max)
Step 4: Interpret the results
A forecast graph tells you three things:
The trend direction. Is your traffic projected to grow, decline, or stay flat? If the trend is downward and your company expects growth, that’s an immediate conversation starter about investment.
The confidence interval width. A narrow interval means the model is relatively confident. A wide interval means there’s high uncertainty—often because the historical data is volatile or the time period is short. Wide intervals are not a reason to dismiss the forecast; they are a reason to run the forecast more frequently and update it as new data arrives.
The impact of known events. If you’ve marked Google core updates in your model, you can see how past algorithmic changes affected your trajectory. This helps you estimate the potential impact of future updates.
Step 5: Build competitive forecasts
The most persuasive forecasts are not about your site in isolation. They show where you stand relative to competitors—and where you’ll stand in 6 or 12 months if nothing changes.
To build a competitive forecast, download historical traffic data for your site and 2–4 competitors. Upload all files to a multi-site forecast notebook. The output will show each domain’s projected trajectory on the same graph.
![[Screenshot: A competitive traffic forecast graph showing 4 domains with different colored trend lines, where one competitor is projected to overtake the user’s site within 8 months]](https://www.datocms-assets.com/164164/1774439904-blobid8.png?auto=format,compress&w=1248&fit=max)
This type of visualization is extremely effective in stakeholder presentations. When a forecast shows that a competitor will surpass you at current effort levels, the natural follow-up question is: “What do we need to do differently?” That’s exactly the conversation you want to have.
You can apply the same approach to traffic value (the estimated cost of your organic traffic if purchased through Google Ads) and page-level traffic. Traffic value forecasts are particularly useful for tying SEO performance to a dollar figure that finance teams understand.
How to Forecast AI Search Visibility
Here is where most forecasting guides stop. They cover Google traffic, keyword rankings, and maybe traffic value. But search is no longer just Google.
According to data from SparkToro, ChatGPT, Perplexity, Claude, and Gemini now collectively drive measurable referral traffic to websites. Not massive volumes yet for most sites—but growing month over month. And the brands that are visible in AI-generated answers today are building a compounding advantage that will be difficult to replicate later.
SEO is not dead. Traditional search engine visibility is still the foundation. But AI search is an additional organic channel that deserves its own forecasting and measurement framework. At Analyze AI, this is exactly what we help teams do.
Why you need to forecast AI search separately
Traditional SEO tools cannot tell you how often your brand is mentioned in ChatGPT responses, whether Perplexity cites your content, or how Claude describes your product compared to competitors. Those data points live in a different layer of visibility.
Forecasting AI search visibility matters for three reasons:
AI engines are growing as a traffic source. Our research analyzing 83,670 AI citations shows that AI engines increasingly pull from authoritative, well-structured content. The sites earning citations today will compound their advantage as AI search adoption grows.
AI mentions influence buying decisions even without clicks. A user asks ChatGPT “what’s the best project management tool?” and sees your product mentioned first. Even if they never click a citation link, they remember your brand. That’s brand visibility that traditional analytics completely misses.
Your competitors may already be tracking this. If a competitor is actively optimizing for AI search citations and you’re not, they’re building a lead that gets harder to close over time.
Step 1: Track your AI search presence
In Analyze AI, start by setting up the prompts that matter to your business. These are the questions your target audience asks AI engines—things like “best CRM for small businesses” or “how to reduce customer churn.”
Analyze AI will run these prompts across ChatGPT, Perplexity, Claude, Copilot, and Gemini, then track which brands appear in the responses, what position they’re mentioned in, and how the AI engine’s sentiment toward each brand trends over time.
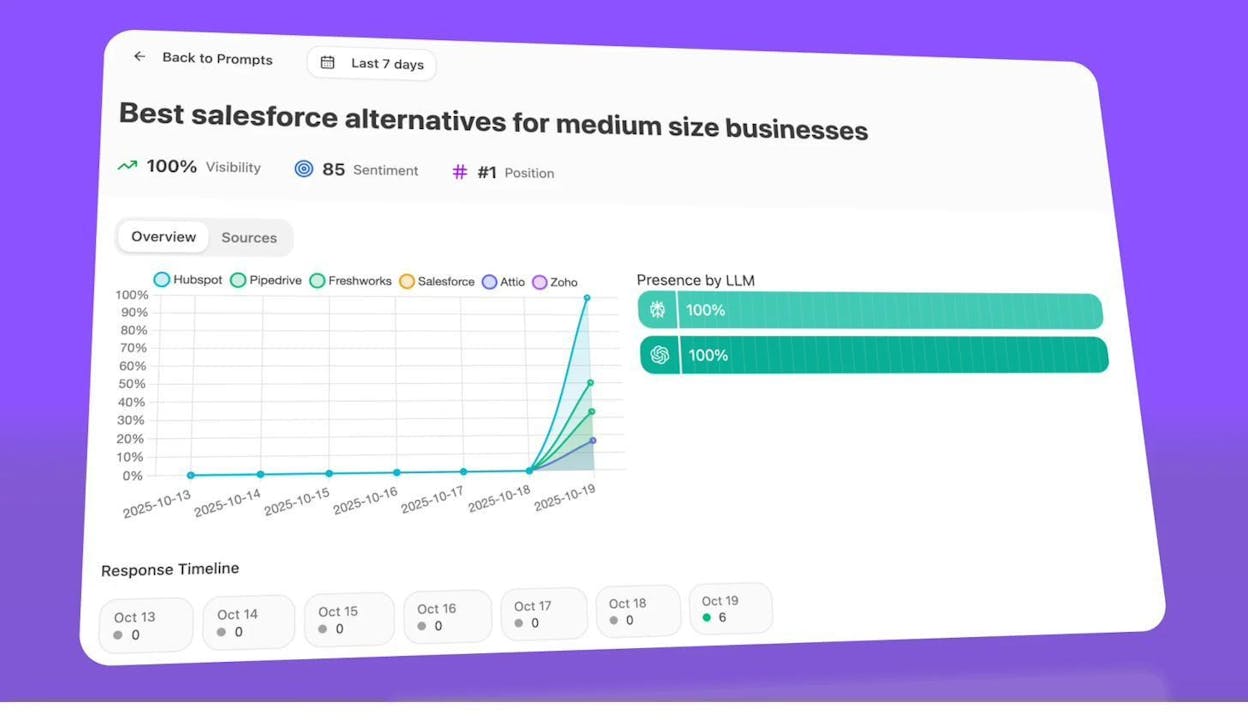
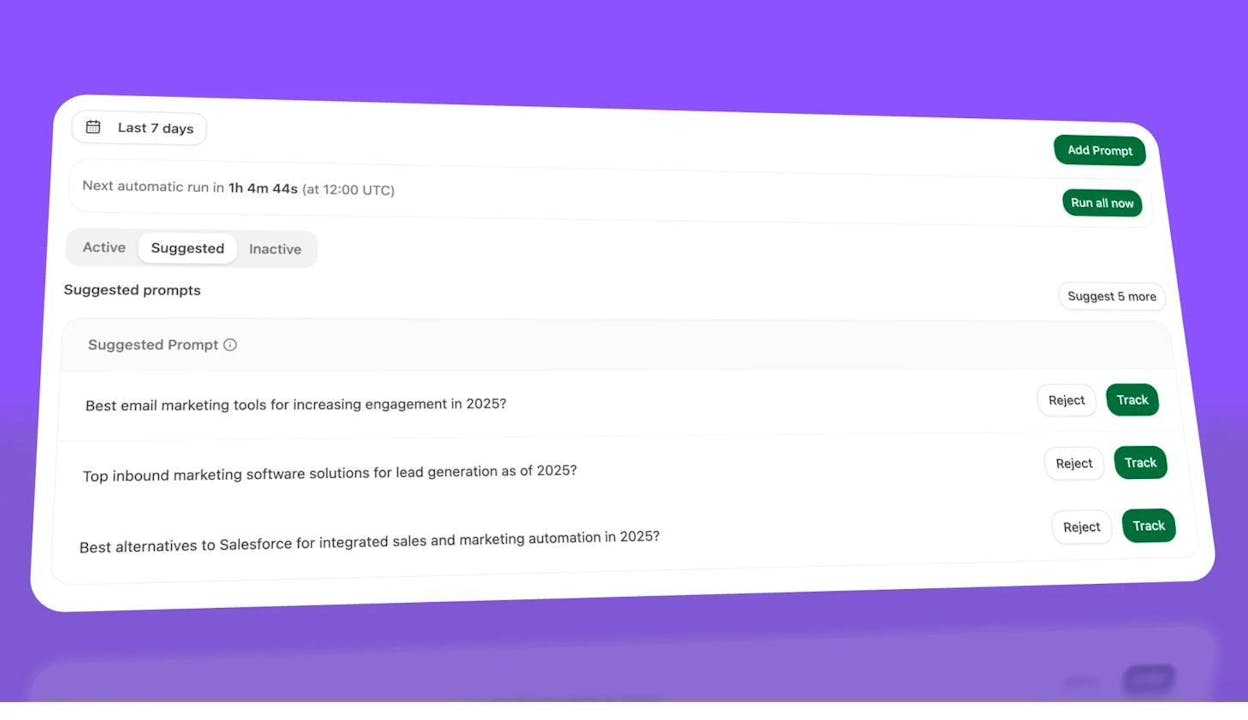
You can also use the Suggested tab to discover prompts you haven’t thought of. Analyze AI recommends prompts based on your tracked clusters, so you can expand coverage without manually brainstorming every possible query.
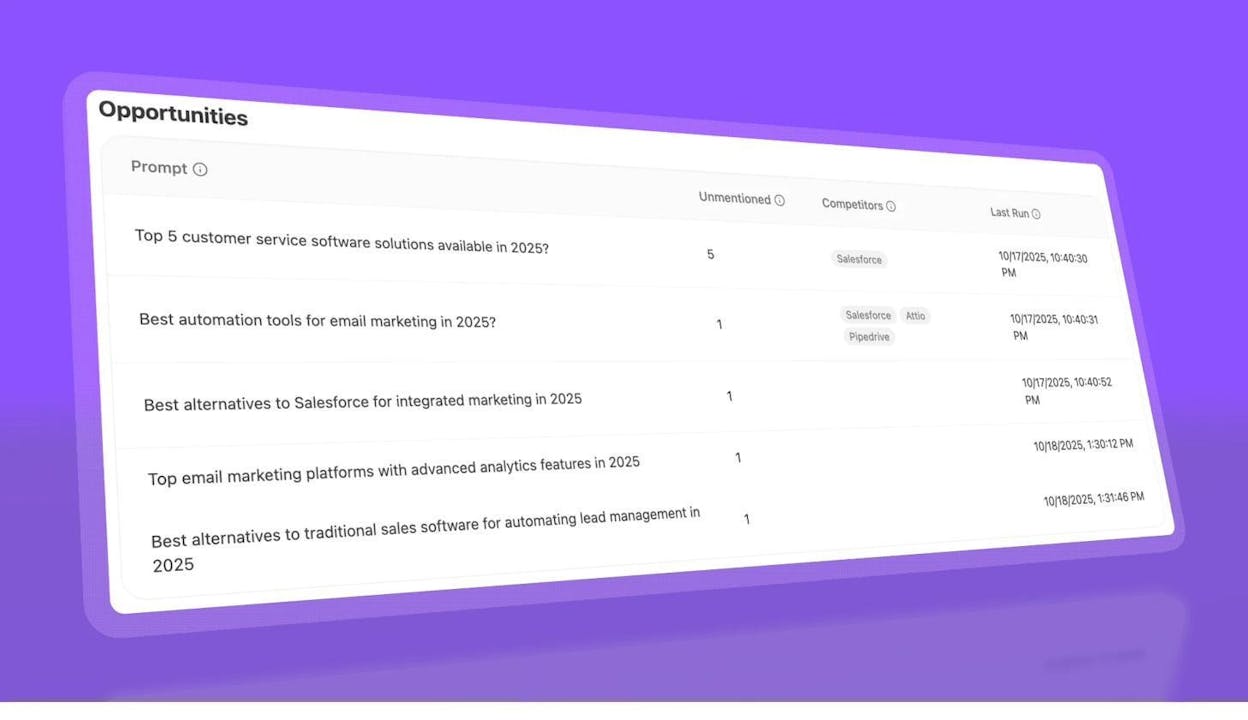
Step 2: Benchmark against competitors
The Competitor Overview in Analyze AI shows you exactly where competitors win and your brand does not. For each tracked prompt cluster, you can see your visibility share, your competitors’ visibility share, and the gap.
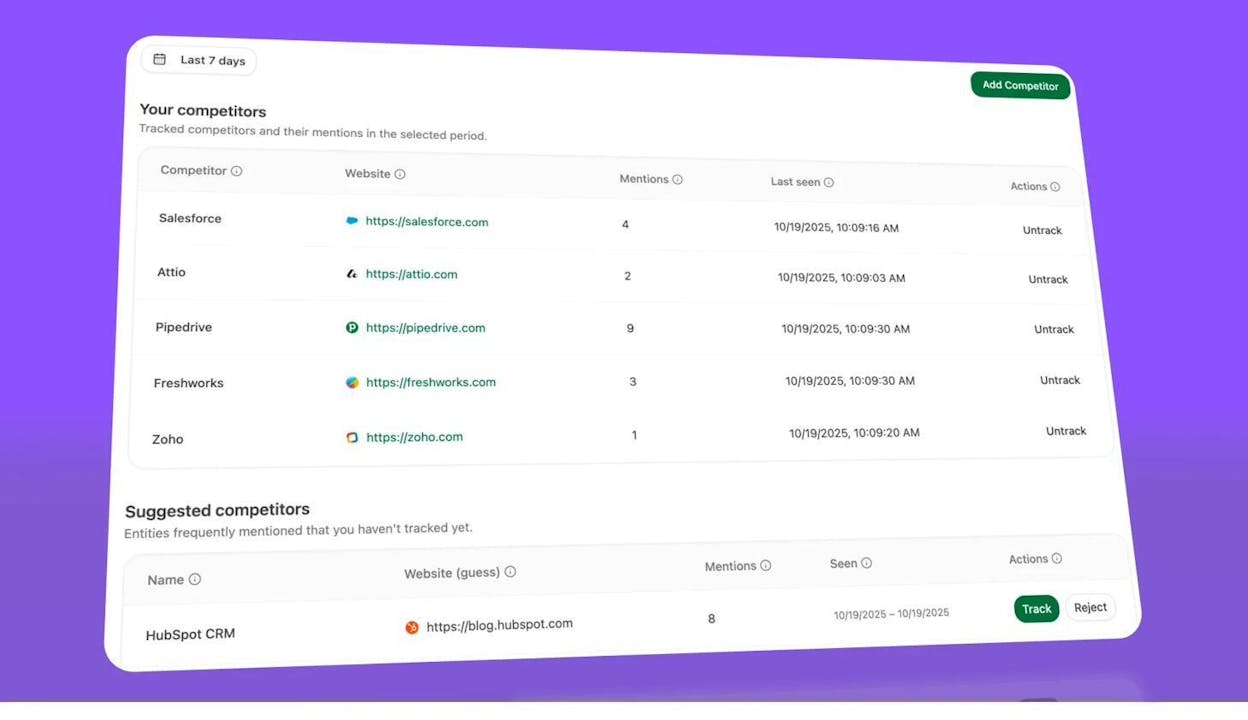
This is the AI search equivalent of a competitive traffic forecast. Instead of projecting future organic traffic, you’re seeing—in real time—where your brand is absent from AI-generated answers that your audience is asking right now. Each gap is an opportunity.
Step 3: Measure actual AI referral traffic
Visibility is one thing. Traffic is another. Analyze AI connects to your GA4 account and attributes sessions that originate from AI engines—broken down by engine, by landing page, and by time period.
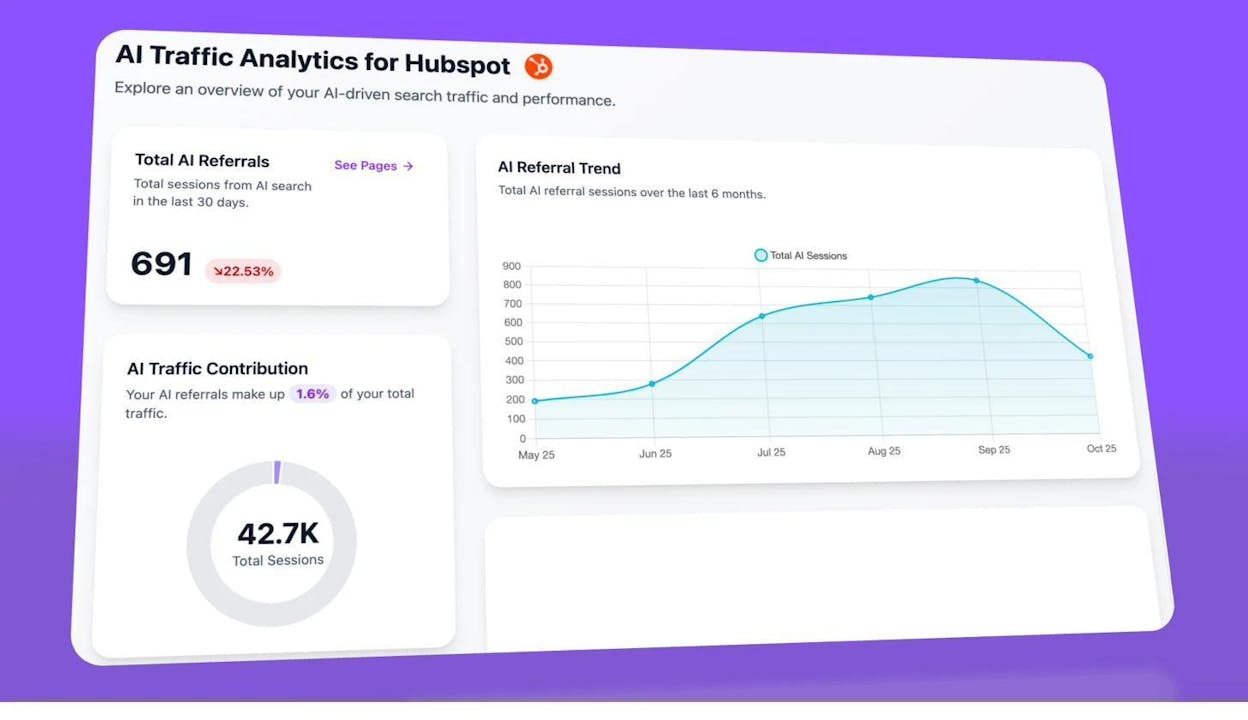
This lets you build a trend line of AI-driven traffic over time. If you’re seeing month-over-month growth (as many Analyze AI customers do), you can extrapolate that trend to forecast where AI traffic will be in 3, 6, or 12 months. More importantly, you can tie that traffic to conversions and revenue—making the business case for investing in answer engine optimization.
Step 4: Identify which pages attract AI traffic
Not all pages are equally likely to be cited by AI engines. Analyze AI’s landing page report shows which of your URLs receive AI referral traffic and from which engines.
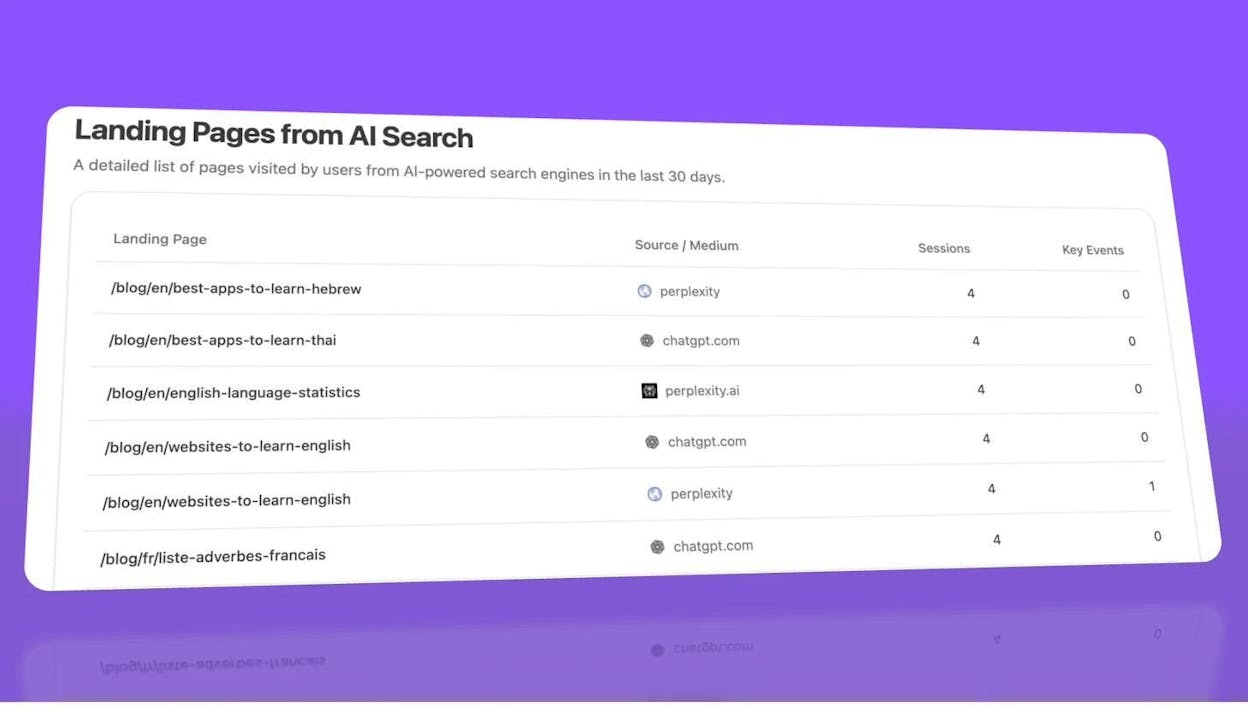
This data reveals patterns. You might find that long-form comparison guides earn significantly more AI citations than product pages, or that pages with structured data and clear definitions get picked up more often. Once you identify what works, you can double down on that format for future content.
If you want a detailed breakdown of what makes content citable by AI engines, read our guide on how to rank on ChatGPT or how to outrank competitors in AI search.
Step 5: Analyze your citation profile
AI engines cite sources to support their answers. Analyze AI tracks which of your URLs get cited, how often, and by which engine.
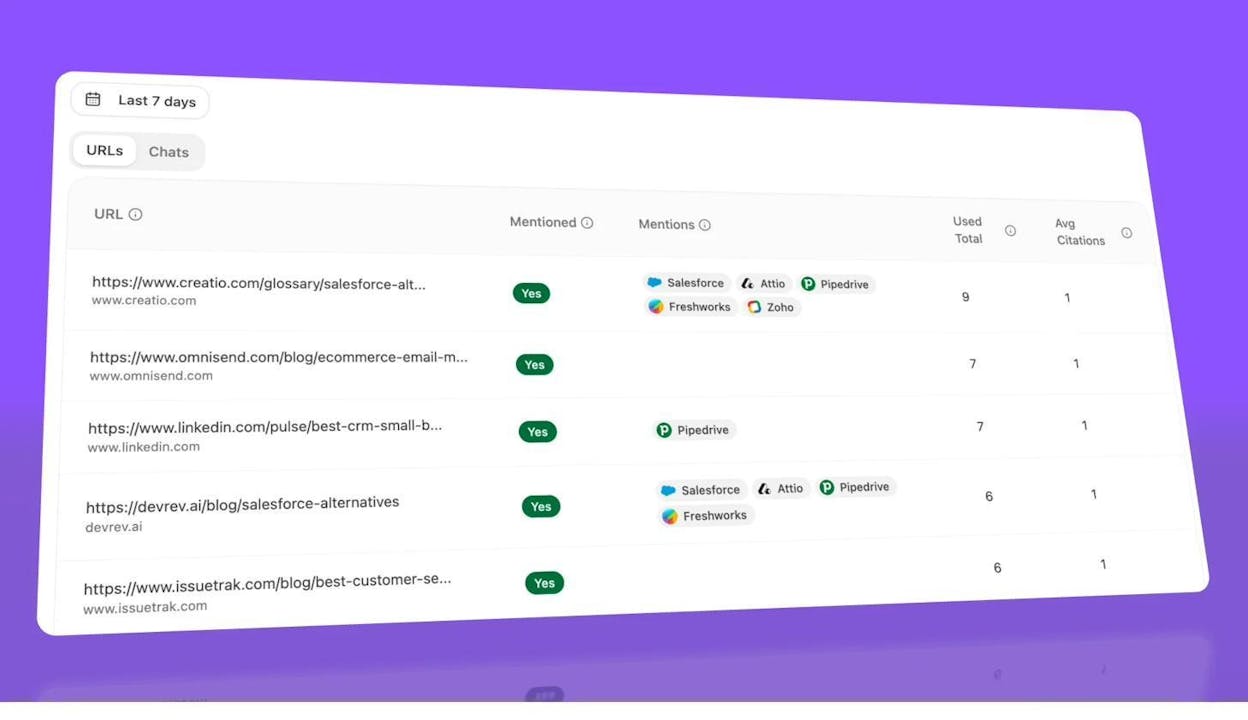
You can also see which external domains are most frequently cited alongside your brand. If a competitor’s content is consistently cited where yours is not, that’s a signal to improve the specific pages they’re outperforming you on.
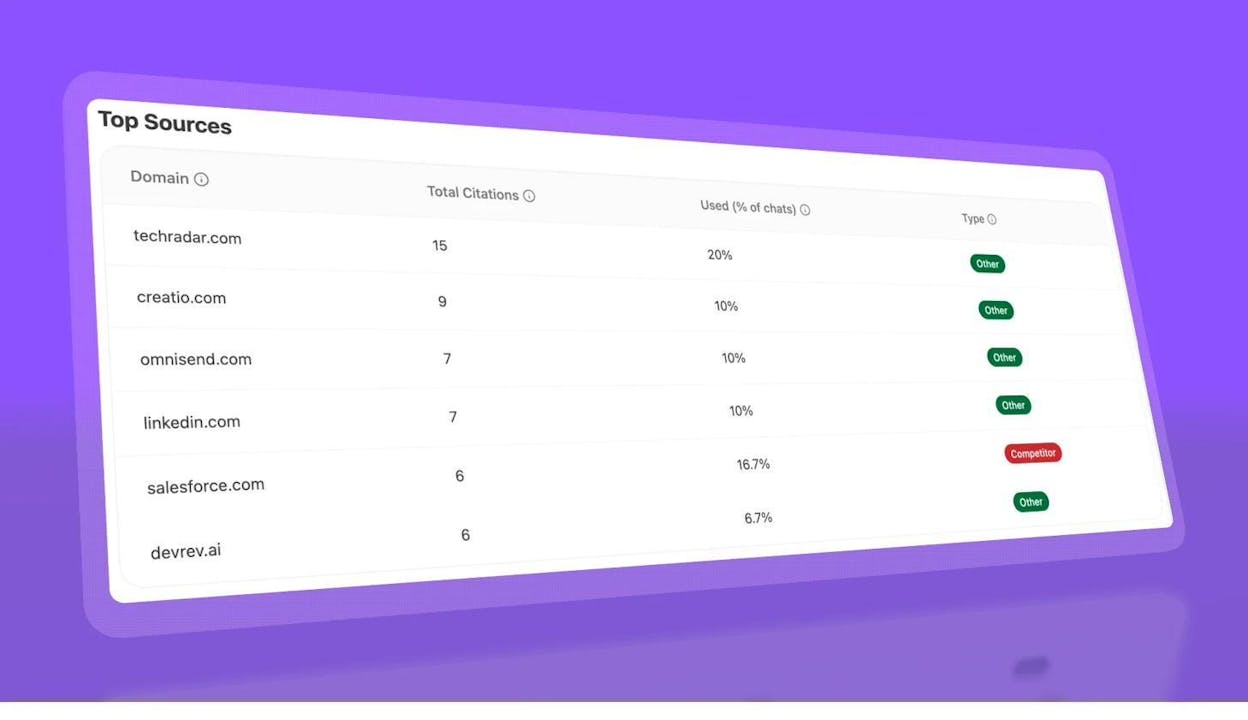
Over time, tracking your citation count by engine creates a trend line you can use for forecasting—much like you’d forecast organic traffic from Google, but for the AI search channel.
Step 6: Compare performance across AI engines
Not all AI engines behave the same way. ChatGPT may cite your content frequently while Perplexity favors a competitor. Analyze AI breaks down your visibility and traffic by engine so you can prioritize the platforms that drive the most value for your business.
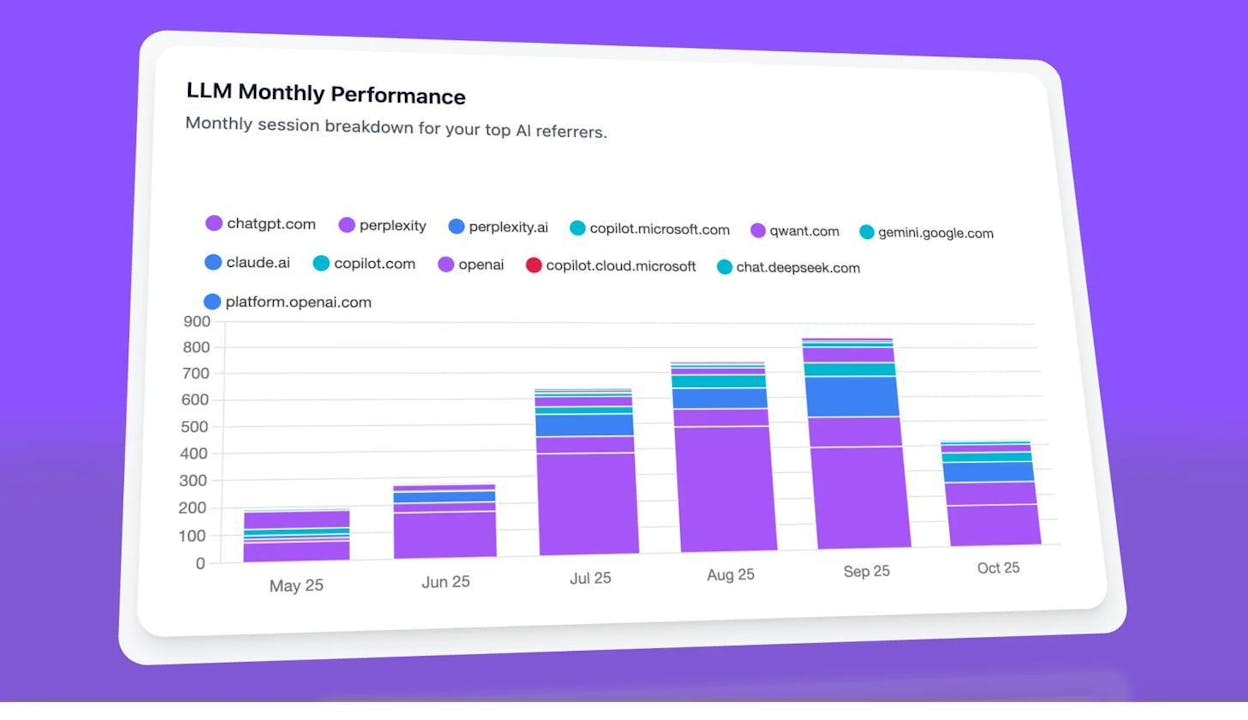
This engine-level view is critical for forecasting. If one engine is growing as a traffic source faster than others, you can allocate resources toward content formats and optimization tactics that perform well on that specific platform.
Adjusting Your Forecasts for Accuracy
No forecast is static. Here are the levers you should adjust to improve accuracy over time.
Use more historical data (when possible)
More data points give the model more patterns to learn from. If you only have six months of history, your forecast will be less reliable than one built on two or three years of data. When you export data from your SEO tool, choose the longest available time period.
There is a caveat: if your site underwent a major redesign, domain migration, or algorithm penalty in the past, including that data may skew your forecast. In those cases, it can be better to start your dataset from after the disruption.
Account for Google core updates
Google core updates can cause significant traffic shifts. If your forecasting model doesn’t account for these events, it may misinterpret a sudden drop or spike as a permanent trend change. Prophet’s “holiday” feature lets you mark specific dates as events, which helps the model separate algorithmic noise from the underlying trend.
Add the dates of known core updates to your model. You can find a comprehensive list of confirmed Google algorithm updates on Google’s Search Status Dashboard.
Forecast different time horizons
The default forecast period is typically 12 months, but you may need shorter or longer projections depending on your use case. For quarterly planning, a 90-day forecast is more actionable. For a three-year strategic plan, extend your projection accordingly.
Keep in mind that longer forecasts have wider confidence intervals. A 12-month forecast is a reasonable bet. A 36-month forecast is a directional guess. Use longer forecasts for strategy conversations, shorter ones for operational decisions.
Segment your data
A site-level forecast smooths over differences between sections of your site. If your blog is growing but your product pages are declining, a site-level forecast averages those trends and gives you a misleading picture.
Segment your forecasts by:
-
Site section (blog, product pages, documentation, landing pages)
-
Traffic type (branded vs. non-branded)
-
Geographic region (if you operate in multiple markets)
-
Content cluster (group pages by topic and forecast each cluster separately)
This segmentation reveals which parts of your strategy are working and which need intervention—information that a site-wide forecast hides.
How to Present Your SEO Forecast to Stakeholders
Building the forecast is half the work. Presenting it effectively is the other half. A technically perfect forecast that fails to persuade is no different from no forecast at all.
Lead with the business question
Do not start with methodology. Start with the question your stakeholders care about: “Will we hit our growth target?” or “Are we gaining or losing ground against competitors?”
Show the answer first—the graph with the trend line—then explain the assumptions behind it. Executives want the conclusion before the evidence.
Use competitive context
A forecast of your site alone has limited persuasive power. A forecast showing your site losing ground to a competitor is far more compelling. When a VP sees that a rival will surpass your organic traffic in nine months at current effort levels, the urgency becomes real.
Translate traffic to revenue
Traffic is a means, not an end. Whenever possible, extend your forecast from traffic to conversions to revenue. Use your site’s historical conversion rate and average order value (or average deal size for B2B) to project how forecasted traffic translates into money.
Forecasted revenue = Forecasted traffic × Conversion rate × Average order value
Even a rough estimate of revenue impact gives stakeholders a number they can compare against the cost of the resources you’re requesting.
Show multiple scenarios
Don’t present a single forecast. Present two or three:
-
Baseline scenario: What happens if we maintain current effort levels
-
Investment scenario: What happens if we increase resources by X%
-
Decline scenario: What happens if we cut SEO investment
The gap between scenarios makes the case for investment far more effectively than any single trend line.
Include AI search projections
This is where you stand out from every other SEO team making a budget case. Most organizations are not forecasting AI search visibility at all. By including data on your brand’s presence in AI-generated answers, the traffic AI engines are already sending to your site, and the competitive gaps in AI citations, you demonstrate forward-looking thinking that positions you as a strategic partner, not just a channel operator.
Use Analyze AI’s Competitor Overview and AI Referral Traffic dashboards to pull this data directly into your presentations.
Advanced SEO Forecasting Techniques
Once you’re comfortable with basic time-series forecasts, you can layer in additional complexity to improve your projections.
Incorporate SERP feature changes
Google’s search results pages are not static. Featured snippets, AI Overviews, People Also Ask boxes, and other SERP features shift the distribution of clicks. If your keyword set is increasingly triggering AI Overviews, your forecasted CTR for traditional organic results should be lower than historical rates.
Track SERP feature prevalence for your target keywords over time. If AI Overviews appear for 15% of your keywords today but 40% in six months, adjust your CTR assumptions accordingly—and factor in what optimizing for AI Overviews could mean for your traffic.
Model content production velocity
A site that publishes 10 articles per month will have a different trajectory than one publishing 2 per month. If you plan to increase your publishing cadence, you can model the incremental traffic each new article is expected to generate (based on historical averages) and add that to your site-level forecast.
Factor in backlink growth
Backlinks remain a strong ranking signal. If you know your site is gaining referring domains at a consistent rate, that growth contributes to your overall authority and supports higher rankings across your keyword portfolio. Some advanced forecasting models include backlink velocity as an input variable.
For a free quick check on your current domain authority, you can use the Website Authority Checker from Analyze AI.
Combine SEO and AI search forecasts
The most complete picture of your organic visibility comes from combining traditional SEO projections with AI search projections. Your total organic forecast should include:
-
Projected Google organic traffic (from your time-series model)
-
Projected AI referral traffic (from your Analyze AI trend data)
-
Projected AI brand visibility (from your prompt tracking data)
This combined view reflects the reality of modern search: users find information through Google, through AI engines, and increasingly through AI-integrated search experiences like Google AI Mode. A forecast that only covers one of these channels is incomplete.
Common SEO Forecasting Mistakes to Avoid
Even experienced teams make these errors. Avoid them to keep your forecasts credible.
Treating forecasts as promises. A forecast is a probability-weighted estimate, not a commitment. Frame it as “based on current trends, we expect traffic to land within this range” rather than “traffic will reach X.”
Using too little historical data. Three months of data is not enough to build a reliable forecast. Aim for at least 12 months, ideally 24 or more, to capture seasonal patterns and trend changes.
Ignoring competitive dynamics. Your traffic doesn’t exist in a vacuum. A competitor launching a major content initiative or earning a surge of backlinks will affect your rankings and traffic—even if your own site stays the same.
Forecasting only traffic. Traffic is a proxy metric. Stakeholders care about leads, signups, sales, and revenue. Extend your forecast to business outcomes whenever possible.
Updating too infrequently. A forecast built in January is less useful by June. Update your projections quarterly—or whenever a significant event (algorithm update, site migration, competitor move) changes the landscape.
Neglecting AI search entirely. If you’re only forecasting Google organic traffic, you’re missing a growing portion of how your audience finds information. AI search may account for a small share of referrals today, but the trend line points sharply upward. Teams that start tracking and forecasting AI visibility now will have a significant head start.
Tools for SEO Forecasting
Here is a summary of the tools available for building your forecasts.
|
Tool |
Best For |
Cost |
|---|---|---|
|
First-party keyword and CTR data |
Free |
|
|
First-party traffic and conversion data |
Free |
|
|
Third-party competitive traffic and keyword data |
Paid |
|
|
Third-party competitive traffic and keyword data |
Paid |
|
|
Time-series forecasting model |
Free (open-source) |
|
|
Google Colab |
Running forecasting scripts without local setup |
Free |
|
AI search visibility tracking, AI referral traffic, competitive AI benchmarking |
||
|
Quick rank position checks for target keywords |
Free |
|
|
Analyzing SERP features and competition for a keyword |
Free |
|
|
Estimating a competitor’s traffic for benchmarking |
Free |
For a broader roundup, see our guide to free SEO tools and SEO reporting tools.
Putting It All Together: Your SEO Forecasting Checklist
Before your next planning cycle, run through this checklist:
-
Export 12+ months of historical traffic data from Google Search Console or a third-party tool.
-
Build a site-level forecast using Prophet, a Google Colab notebook, or a spreadsheet template.
-
Build a competitive forecast comparing your site against 2–4 competitors on the same graph.
-
Segment your forecast by site section, traffic type, or content cluster to find where growth or decline is concentrated.
-
Set up AI search tracking in Analyze AI to monitor your visibility, citations, and referral traffic across ChatGPT, Perplexity, Claude, Copilot, and Gemini.
-
Identify AI search gaps using the Competitor Overview to see where competitors appear and you don’t.
-
Extend your forecast to revenue by multiplying projected traffic by your conversion rate and average order value.
-
Prepare a stakeholder presentation that leads with the business question, shows competitive context, and includes both SEO and AI search projections.
-
Update your forecast quarterly to incorporate new data and adjust for market changes.
Search is evolving. Google organic traffic remains the largest source of organic visits for most sites, and that’s unlikely to change soon. But AI-powered search engines are a growing channel that compounds over time. The teams that start forecasting, tracking, and optimizing across both traditional and AI search today will be the ones best positioned when the shift accelerates.
If you want to see how your brand shows up in AI-generated answers—and where you’re missing—start tracking with Analyze AI.
Ernest
Ibrahim


