


Summarize this blog post with:
In this article, you’ll learn what every major SEO metric means, how it’s calculated, where each tool (Ahrefs, Semrush, and Moz) differs, and which metrics actually move the needle for your rankings. You’ll also learn about a new category of metrics—AI search visibility metrics—that measures how your brand appears across ChatGPT, Perplexity, Claude, and other AI answer engines.
We’ll cover 25+ metrics across six categories:
-
Domain-level authority metrics (Domain Rating, Domain Authority, Authority Score)
-
Page-level authority metrics (URL Rating, Page Authority)
-
Keyword metrics (Search Volume, Keyword Difficulty, Traffic Potential, CPC)
-
Traffic metrics (Organic Traffic, Traffic Value, Paid Traffic Cost)
-
Backlink and trust metrics (Referring Domains, Spam Score, Toxic Score)
-
SERP and competitive metrics (Share of Voice, Organic Keywords, Organic Pages)
-
AI search visibility metrics (AI Visibility, Sentiment, Citation Share, AI Referral Traffic)
By the end, you’ll know exactly which metrics to prioritize, how to interpret them without getting misled, and how to track your brand’s presence across both traditional search and AI answer engines.
Table of Contents
What Are SEO Metrics?
SEO metrics are quantitative measurements that help you evaluate how well your website performs in search engines. They cover everything from how strong your backlink profile is to how much organic traffic a page receives to how difficult it will be to rank for a specific keyword.
Every major SEO tool uses its own proprietary metrics. Ahrefs has Domain Rating. Moz has Domain Authority. Semrush has Authority Score. They all aim to measure similar things, but their calculations differ—sometimes significantly.
The trouble is that many SEO practitioners treat these metrics interchangeably or, worse, use them as standalone KPIs. A Domain Rating of 60 doesn’t mean the same thing as a Domain Authority of 60. Understanding how each metric is calculated—and what its limitations are—gives you an edge when making decisions about content, link building, and competitive analysis.
And here’s the part most glossaries miss: these traditional SEO metrics only tell half the story. As search expands beyond ten blue links into AI-generated answers, a new set of metrics has emerged to measure visibility across AI answer engines. We’ll cover those too, because SEO isn’t dead—it’s evolving, and AI search is an additional organic channel worth tracking.
Domain-Level Authority Metrics
Domain-level authority metrics measure the overall strength and trustworthiness of an entire website. All three major SEO tools have their own version of this metric, and while they all use a 0-to-100 scale, the way they calculate that score is quite different.
Domain Rating (DR) — Ahrefs
Domain Rating measures the overall strength of a website’s backlink profile on a logarithmic scale from 0 to 100. The higher the DR, the stronger the site’s link profile.
How Ahrefs calculates DR:
Ahrefs looks at three factors:
-
The number of unique referring domains with at least one followed link. Nofollowed links don’t count toward DR. And because Ahrefs counts referring domains (not individual links), getting 50 links from one website has the same effect on DR as getting one link from that website.
-
The DR of the linking domains. A link from a DR 90 site carries more weight than a link from a DR 10 site. This also means your DR can increase even if you don’t acquire new links—if the sites that link to you improve their own DR.
-
How many other sites the linking domain links to. This is the dilution factor. A followed link from the New York Times (DR 94) sounds impressive, but it links out to nearly 300,000 other sites. That dilutes the “DR equity” each site receives. A link from a site like IMDB (DR 93), which links to far fewer external sites, would have a bigger impact on your DR.
What DR is good for: Quickly comparing the relative backlink strength of two websites. It’s useful for link prospecting (gauging whether a link from a particular site would be valuable) and competitive benchmarking.
What DR is not good for: DR is not a quality indicator. A site can have a high DR from lots of low-quality links. It’s not a proxy for traffic, trustworthiness, or content quality. Always pair DR with other metrics like organic traffic or referring domain quality.
![[Screenshot placeholder: Ahrefs Domain Rating overview showing DR score with referring domains count]](https://www.datocms-assets.com/164164/1774867952-blobid1.jpg?auto=format,compress&w=1248&fit=max)
Domain Authority (DA) — Moz
Domain Authority is Moz’s predictive metric that estimates how likely a website is to rank in search engine results. It also runs on a logarithmic scale from 1 to 100.
How Moz calculates DA:
Moz originally based DA purely on link metrics (MozRank and MozTrust). In 2019, Moz overhauled its algorithm with “Domain Authority 2.0,” which introduced machine learning and additional signals. The current calculation considers:
-
Linking root domains. The number and quality of unique domains linking to your site.
-
Total link count. How many inbound links (followed and nofollowed) point to your site.
-
Spam Score. Moz’s proprietary measure of how likely a site is to be penalized based on correlations with known penalized sites. Spam Score ranges from 0% to 100%—scores above 30% warrant a backlink audit.
-
Machine learning fit. Moz uses a neural network to predict how frequently a domain will appear in SERPs, effectively using actual Google rankings as a calibration signal.
Key difference from DR: Because DA factors in actual search performance (via its machine learning model), it’s technically a “predictive ranking metric” rather than purely a backlink strength metric. However, this also makes DA a relative metric—your DA can drop even if nothing about your site changes, simply because other sites improved.
The manipulation problem: DA is historically the most manipulated authority metric. Freelancers on platforms like Fiverr offer “DA boosting” services. Moz has improved its spam detection, but DA inflation through private blog networks (PBNs) and link farms remains a documented issue.
What DA is good for: Comparative analysis between competing sites. If you and a competitor both target the same keywords, DA gives you a rough sense of whose link profile is stronger in Moz’s eyes.
What DA is not good for: Using as a standalone KPI. Never set “increase DA to 50” as a goal. Focus on the underlying activities—acquiring quality links, creating valuable content—and let DA reflect the results.
![[Screenshot placeholder: Moz Domain Authority checker showing DA, PA, and Spam Score]](https://www.datocms-assets.com/164164/1774867958-blobid2.png?auto=format,compress&w=1248&fit=max)
Authority Score (AS) — Semrush
Authority Score is Semrush’s compound metric that grades the overall quality of a website on a scale from 0 to 100. It’s the most holistic of the three domain-level metrics because it considers factors beyond just links.
How Semrush calculates AS:
Semrush uses eight weighted factors grouped into three categories:
-
Link Power. The quality and quantity of backlinks pointing to the domain—similar to what Ahrefs and Moz measure.
-
Organic Traffic. The estimated monthly organic visits the site receives. This is unique to Semrush. If a site has a strong backlink profile but gets zero organic traffic, its AS will stay low.
-
Natural Profile (Spam Indicators). Six different spam checks including detection of private blog networks, unnatural link growth patterns, suspicious anchor text distributions, and the presence of domains with identical backlink profiles.
Key difference from DR and DA: Authority Score is the hardest to manipulate because it cross-references link data with actual organic traffic. A site that buys thousands of links but ranks for nothing will still score low. Semrush updates Authority Scores every two weeks.
What AS is good for: Evaluating the trustworthiness of potential link partners and comparing your site’s overall SEO health against competitors.
What AS is not good for: Like DR and DA, it’s a vanity metric when viewed in isolation. A “good” score is entirely relative to your niche.
![[Screenshot placeholder: Semrush Authority Score dashboard with backlink and traffic breakdown]](https://www.datocms-assets.com/164164/1774867963-blobid3.png?auto=format,compress&w=1248&fit=max)
How These Metrics Compare
|
Feature |
Domain Rating (Ahrefs) |
Domain Authority (Moz) |
Authority Score (Semrush) |
|---|---|---|---|
|
Scale |
0–100 (logarithmic) |
1–100 (logarithmic) |
0–100 (logarithmic) |
|
Primary signal |
Backlink strength |
Backlinks + ML ranking prediction |
Backlinks + traffic + spam checks |
|
Considers organic traffic |
No |
Indirectly (via ML model) |
Yes |
|
Spam detection |
Basic |
Spam Score (0–100%) |
6 spam indicators |
|
Manipulation resistance |
Moderate |
Low-moderate |
High |
|
Update frequency |
Continuous crawling |
Monthly |
Every 2 weeks |
|
Best use case |
Link prospecting, quick comparisons |
Relative site strength |
Holistic site quality assessment |
The bottom line: None of these metrics are Google ranking factors. Google has repeatedly confirmed it does not use any third-party authority score. These are tools for SEOs, not signals for search engines. Use them comparatively—not as targets.
How to Check Domain Authority for Free
You don’t need paid subscriptions to check these metrics. Several free tools give you quick access:
-
Analyze AI’s Website Authority Checker lets you check any domain’s authority score instantly.
-
Ahrefs offers a free Website Authority Checker that shows DR, referring domains, and backlinks.
-
Moz provides a free Link Explorer tool for DA, PA, and Spam Score lookups.
-
Semrush has a free Website Authority Checker for AS lookups.
Page-Level Authority Metrics
While domain-level metrics measure an entire website, page-level metrics evaluate the strength of a specific URL. This distinction matters because a page on a DR 80 site can still have a weak backlink profile, and a page on a DR 20 site can have unusually strong links.
URL Rating (UR) — Ahrefs
URL Rating measures the overall strength of a specific page’s backlink profile on a scale from 0 to 100. It follows principles similar to Google’s original PageRank formula:
-
It counts both internal and external links pointing at the target page
-
It weights links differently based on the linking page’s own UR
-
It respects the nofollow attribute
-
It uses a damping factor (each “hop” through a chain of links diminishes the value passed)
Ahrefs’ own research found a clear positive correlation between URL Rating and search traffic—higher UR pages tend to get more organic visits.
Practical uses for UR:
-
Link prospecting. When evaluating whether a specific page is worth getting a link from, UR tells you how much “link equity” that page might pass.
-
Internal link optimization. If you have a page with high UR but no strategic internal links, you’re leaving value on the table. Redistribute that authority to important pages through internal linking.
-
Gauging ranking difficulty. Before targeting a keyword, look at the UR of the top-ranking pages. If they all have UR 60+, you’ll need a strong backlink strategy for that particular page.
Page Authority (PA) — Moz
Page Authority works just like Domain Authority but at the individual URL level. It predicts how likely a specific page is to rank in SERPs on a scale from 1 to 100.
PA uses the same machine learning model as DA but applies it to a single page’s link profile rather than the whole domain. Like DA, it’s a relative metric—your PA can shift even without changes to your page because Moz recalibrates its model against the wider web.
When to use PA vs. UR: PA is more useful when you want a ranking prediction because it factors in more than just links. UR is better when you specifically want to understand the backlink strength of a page. In practice, most SEOs check both.
Keyword Metrics
Keyword metrics help you decide which search queries to target and how difficult it will be to rank for them. These metrics are available across all three tools, though the calculations vary.
Keyword Search Volume
Keyword search volume represents the average number of times people search for a specific query in a given country per month. All three tools (Ahrefs, Semrush, and Moz) pull from Google Keyword Planner data as a baseline, then apply their own models to refine the estimates.
Why search volume is tricky:
-
It’s a 12-month average. A keyword with seasonal spikes (like “Christmas gifts”) will show a smoothed-out number that understates December demand and overstates June demand.
-
It counts searches, not searchers. The same person can search for the same query multiple times a month, inflating the volume number.
-
Even Google doesn’t give exact values. Google Keyword Planner groups search volumes into ranges, so every third-party tool is working from approximations of approximations.
What to do instead: Don’t rely on search volume alone. Pair it with Traffic Potential (see below) to understand the realistic traffic a ranking could bring.
You can explore search volumes for free with Analyze AI’s Keyword Generator or platform-specific tools like the YouTube Keyword Tool, Amazon Keyword Tool, and Bing Keyword Tool.
Keyword Difficulty (KD)
Keyword Difficulty estimates how hard it will be to rank in the top 10 organic results for a given keyword. It’s measured on a scale from 0 to 100 across all three tools, but each calculates it differently.
How each tool calculates KD:
|
Tool |
Primary KD Factor |
Additional Factors |
|---|---|---|
|
Ahrefs |
Number of referring domains linking to the top 10 results |
None—intentionally kept simple |
|
Semrush |
Backlink profiles of top-ranking pages |
Domain authority of ranking sites, SERP features, search intent signals |
|
Moz |
Page Authority and Domain Authority of top results |
Click-through rate predictions, SERP features |
Ahrefs’ approach is the most transparent. They explicitly state that KD is based on one thing: how many linking websites the top-ranking pages have. The higher the number, the higher the KD. This makes it easy to interpret—a KD of 50 means you’ll probably need a significant number of backlinks to compete.
Semrush and Moz factor in more signals, which theoretically makes their KD more nuanced but also less transparent. It’s harder to know exactly why a keyword scored a 65 in Semrush versus a 45 in Ahrefs.
The critical caveat: KD doesn’t account for content quality, search intent alignment, topical authority, or brand signals. You should always manually review the top 10 results for any keyword before deciding whether to pursue it. A low-KD keyword can still be impossible to rank for if every result is from a major brand with deep topical coverage.
You can check keyword difficulty for free using Analyze AI’s Keyword Difficulty Checker.
Traffic Potential
Traffic Potential is an Ahrefs-specific metric that shows the total organic traffic the #1 ranking page for your target keyword receives from all the keywords it ranks for—not just the one you searched.
Why this matters more than search volume:
A single page can rank for hundreds (sometimes thousands) of keywords. If you only look at the search volume of your primary keyword, you’ll drastically underestimate the traffic opportunity.
For example, a keyword with a monthly search volume of 500 might have a Traffic Potential of 6,400. That’s because the page ranking #1 for that keyword also ranks for dozens of related queries that collectively drive far more traffic.
How to use it: When comparing two keyword opportunities, Traffic Potential gives you a more realistic picture of the upside. A keyword with lower search volume but higher Traffic Potential is often the better target because it represents a broader content opportunity.
Parent Topic
Parent Topic is another Ahrefs metric that helps you determine whether you need a dedicated page for a keyword or whether you can target it with broader content.
Ahrefs identifies the Parent Topic by looking at the #1 ranking page for your keyword and finding the query responsible for sending the most traffic to that page. If the Parent Topic is different from your keyword, it means you can likely cover both topics on a single page.
Example: If you search for “how to do lunges with weights,” the Parent Topic might be “lunges with weights.” The #1 page for your specific query gets most of its traffic from that broader term. This tells you to create content targeting the Parent Topic rather than the narrow variation.
Practical application: Use Parent Topic to avoid creating multiple pages that compete with each other for similar queries—a problem known as keyword cannibalization.
Cost Per Click (CPC)
CPC shows how much advertisers pay, on average, for a click on a Google ad for a specific keyword. It’s primarily a PPC metric, but SEOs use it as a proxy for commercial value.
Why CPC matters for SEO:
A high CPC signals that the keyword has strong commercial intent—businesses are willing to pay good money for that traffic. When you rank organically for high-CPC keywords, you’re essentially getting for free what others pay significantly for.
This is exactly what the Organic Traffic Value metric quantifies (covered in the next section).
The limitation: CPC is volatile. It can change by the second based on bidding competition, seasonality, and advertiser budgets. Treat it as a directional signal, not a precise number.
Traffic Metrics
Traffic metrics estimate how much organic search traffic a website or page receives and how valuable that traffic is.
Organic Traffic
Organic Traffic estimates how many monthly visits a website, subfolder, or URL gets from organic search. All three tools calculate it by:
-
Finding all keywords the target ranks for in the top 100 results
-
Estimating the click-through rate (CTR) for each ranking position
-
Multiplying each keyword’s search volume by the estimated CTR
-
Summing all the estimates
Why these estimates are imperfect:
-
No tool knows every keyword a page ranks for
-
Search volumes are approximations
-
Ranking positions fluctuate constantly
-
CTR models are estimates based on aggregated data
Despite these limitations, organic traffic estimates are highly valuable for competitive comparison. If Ahrefs estimates that competitor A gets 50,000 monthly organic visits and competitor B gets 15,000, that relative difference is almost certainly directionally accurate—even if the absolute numbers are off.
Pro tip: If you have access to your own Google Search Console data, you can calculate a “discrepancy factor” to calibrate the tool’s estimates. Divide your actual GSC traffic by the tool’s estimate, then apply that ratio to your competitors’ estimates for a more accurate comparison.
Organic Traffic Value
Organic Traffic Value puts a dollar amount on a website’s organic traffic by calculating what it would cost to buy the same traffic through Google Ads.
The calculation is straightforward:
For each keyword a site ranks for, multiply the estimated organic clicks by the CPC for that keyword. Sum all the values to get the total traffic value.
Example: If a page ranks for two keywords: - “blue widgets” (100 monthly organic visits × $2 CPC) = $200 - “red widgets” (100 monthly organic visits × $1 CPC) = $100 - Total traffic value = $300
Why this metric is useful:
It helps you prioritize which pages and keywords deliver the most commercial value. A page generating 50 visits from $30 CPC keywords is more commercially valuable than a page generating 500 visits from $0.50 CPC keywords. Use this to make a case for SEO investment—showing stakeholders the equivalent ad spend for your organic performance.
Paid Traffic Cost
Paid Traffic Cost is the inverse of Organic Traffic Value. Instead of estimating the value of organic traffic, it estimates the monthly spend a website is investing in paid search ads.
Semrush and Ahrefs calculate it by:
-
Identifying the paid keywords a site is bidding on
-
Estimating the paid traffic for each keyword
-
Multiplying by the CPC
The caveat: This metric is a rough estimate. Tools don’t capture all paid keywords because advertisers sometimes bid on queries not in the keyword index, or they target hyperlocal areas that the tools don’t scan.
When it’s useful: Paid Traffic Cost helps you understand a competitor’s paid search strategy. If a competitor spends heavily on paid ads for keywords you rank organically for, that’s a strong signal of the keyword’s value—and a competitive advantage you should protect.
Backlink and Trust Metrics
Beyond domain and page authority, SEO tools provide metrics that measure the quality and trustworthiness of a site’s link profile.
Referring Domains
Referring domains counts the number of unique websites (root domains) that link to your target. It’s distinct from total backlinks—a single referring domain can link to your site from multiple pages.
Why referring domains matter more than total backlinks:
Google’s algorithms weight link diversity. 100 links from 100 different websites is far more valuable than 100 links from a single website. That’s why all major SEO tools track referring domains as a core metric.
What to watch for: - A sudden spike in referring domains could signal a negative SEO attack or unnatural link growth. - A steady decline might indicate that sites are removing their links to you, or that previously linking sites have gone offline. - The quality of referring domains matters more than the quantity. 10 links from DR 60+ sites outweigh 1,000 links from DR 5 sites.
Spam Score — Moz
Spam Score is Moz’s metric that indicates how likely a domain is to be penalized by search engines. It ranges from 0% to 100%, with higher scores suggesting higher risk.
Moz evaluates multiple spam signals including: thin content, lack of contact information, excessive external links relative to content, and patterns consistent with known penalized sites.
Interpretation guidelines: - 0–30%: Low risk. Most legitimate sites fall here. - 31–60%: Moderate risk. Worth investigating the site’s link profile. - 61–100%: High risk. Likely spammy or manipulated.
When to use it: Before building links from a site, check its Spam Score. If it’s above 30%, dig deeper before pursuing a link. Also audit your own backlink profile periodically—if you’re receiving many links from high Spam Score sites, consider disavowing those links.
Toxic Score — Semrush
Semrush’s Toxic Score works similarly to Moz’s Spam Score but applies specifically to individual backlinks rather than whole domains. It flags backlinks that could potentially harm your rankings.
Semrush uses over 45 toxicity markers including: links from known PBNs, links with manipulative anchor text, links from sites with no organic traffic, and links from domains with identical backlink profiles (a strong indicator of link schemes).
Practical use: Run a backlink audit in Semrush periodically. If you find a cluster of high Toxic Score links, you can reach out to the linking sites to request removal, or submit them to Google’s Disavow Tool.
SERP and Competitive Metrics
These metrics help you understand your overall search visibility relative to competitors.
Organic Keywords
Organic Keywords shows the total number of keywords your target ranks for in the top 100 organic search results. It’s available in all three tools and provides a quick snapshot of a site’s search footprint.
What it tells you: A site ranking for 50,000 keywords has a much broader search presence than one ranking for 500. But raw numbers can be misleading—a site might rank for thousands of irrelevant or ultra-low-volume keywords.
Better approach: Filter organic keywords by ranking position (top 10 or top 3), search volume (above a threshold), and business relevance. This gives you a more actionable view of which keywords actually matter.
Share of Voice (SOV)
Share of Voice represents a website’s overall visibility in organic search for a set of tracked keywords. Ahrefs calculates it by dividing a site’s estimated traffic from tracked keywords by the total search traffic available for those keywords.
Why SOV is one of the most important SEO metrics:
Unlike organic traffic, which can grow simply by targeting more keywords, SOV measures your share of a specific market. If your SOV is 15% and a competitor’s is 35%, you know exactly where you stand—and how much ground you need to make up.
How to use SOV effectively:
-
Define a keyword set that represents your market (your core product or service categories)
-
Track SOV over time for yourself and your competitors
-
Correlate SOV changes with specific SEO activities (content launches, link building campaigns) to understand what moves the needle
SOV is particularly powerful for SEO competitor analysis because it provides a normalized comparison that isn’t inflated by vanity metrics.
Organic Pages
Organic Pages shows how many pages on a domain rank in the top 100 organic search results. It’s useful for understanding the breadth of a site’s indexed and ranking content.
What to look for: Compare your Organic Pages count to your total indexed pages. If you have 500 indexed pages but only 50 ranking, that’s a 10% hit rate—suggesting that most of your content isn’t performing. This might indicate content quality issues, cannibalization, or thin content that could benefit from a content audit.
Crawled Pages
Crawled Pages (Ahrefs-specific) shows the number of unique pages that AhrefsBot has visited and saved to its index. Higher-authority sites tend to get crawled more thoroughly.
If your site’s Crawled Pages count is significantly lower than your actual page count, it might mean: your robots.txt is blocking Ahrefs’ crawler, your site has crawlability issues, or your site doesn’t have enough authority to attract frequent crawling.
AI Search Visibility Metrics
Traditional SEO metrics measure your performance in Google’s ten blue links. But search is changing. AI answer engines like ChatGPT, Perplexity, Claude, Gemini, and Copilot now generate direct answers to user queries—and they cite sources when doing so.
This creates a new layer of visibility that existing SEO tools don’t measure. Your brand might rank #1 on Google for a keyword but not appear at all when someone asks ChatGPT the same question. Or vice versa—your content might get cited frequently in AI responses even if your traditional rankings are modest.
AI search is not replacing SEO. It’s an additional organic channel. And like any channel, you need metrics to measure it.
Here are the key AI search visibility metrics and how to track them with Analyze AI.
AI Visibility Score
AI Visibility measures the percentage of times your brand is mentioned in AI-generated responses across tracked prompts. If you track 100 prompts related to your industry and your brand appears in responses to 75 of them, your AI Visibility is 75%.
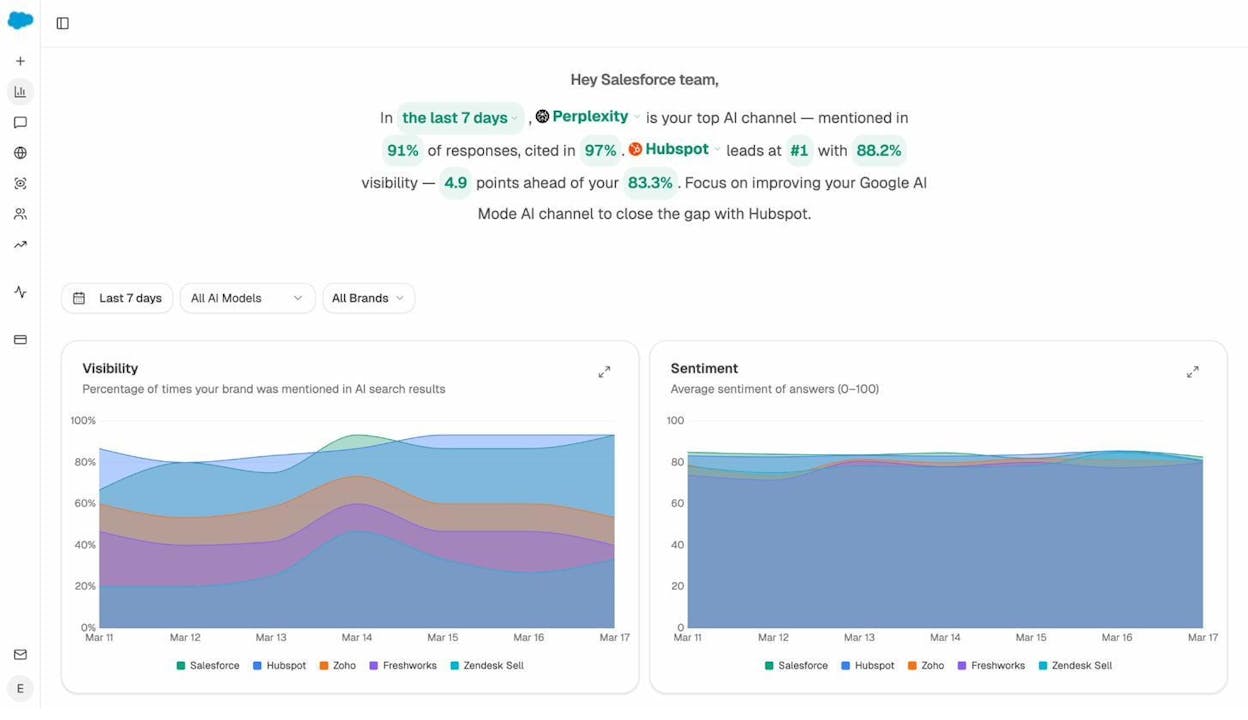
In Analyze AI’s dashboard, AI Visibility is broken down by AI model (ChatGPT, Perplexity, Claude, Gemini, Copilot) and by time period. The overview page shows your visibility trend alongside your competitors’ visibility, so you can immediately see who’s winning in AI search for your market.
Why it matters: AI answer engines are becoming a significant source of brand discovery. When a user asks “best CRM software for small businesses” and an AI lists your product, that’s valuable exposure—even if it doesn’t immediately drive a click.
How to act on it: If your AI Visibility is low for specific prompt clusters, examine which competitors appear instead. Then look at what content they have that you don’t—this is the AI equivalent of a content gap analysis.
AI Sentiment Score
AI Sentiment measures how positively or negatively AI models describe your brand when they mention it. It’s scored from 0 to 100, where higher scores indicate more favorable descriptions.
This is a metric that has no equivalent in traditional SEO. Google doesn’t care about sentiment when ranking pages—but AI models construct narratives about your brand, and those narratives can be positive, neutral, or negative.
Why it matters: A brand that appears frequently in AI responses but with negative sentiment has a reputation problem. Analyze AI’s Perception dashboard lets you monitor sentiment across different AI models and over time, so you can catch negative narrative drift early.
How to act on it: If sentiment dips, investigate which prompts are generating negative mentions. Then examine the sources the AI models cite when they say something negative. Those sources are where you need to focus your content and PR efforts.
Citation Share
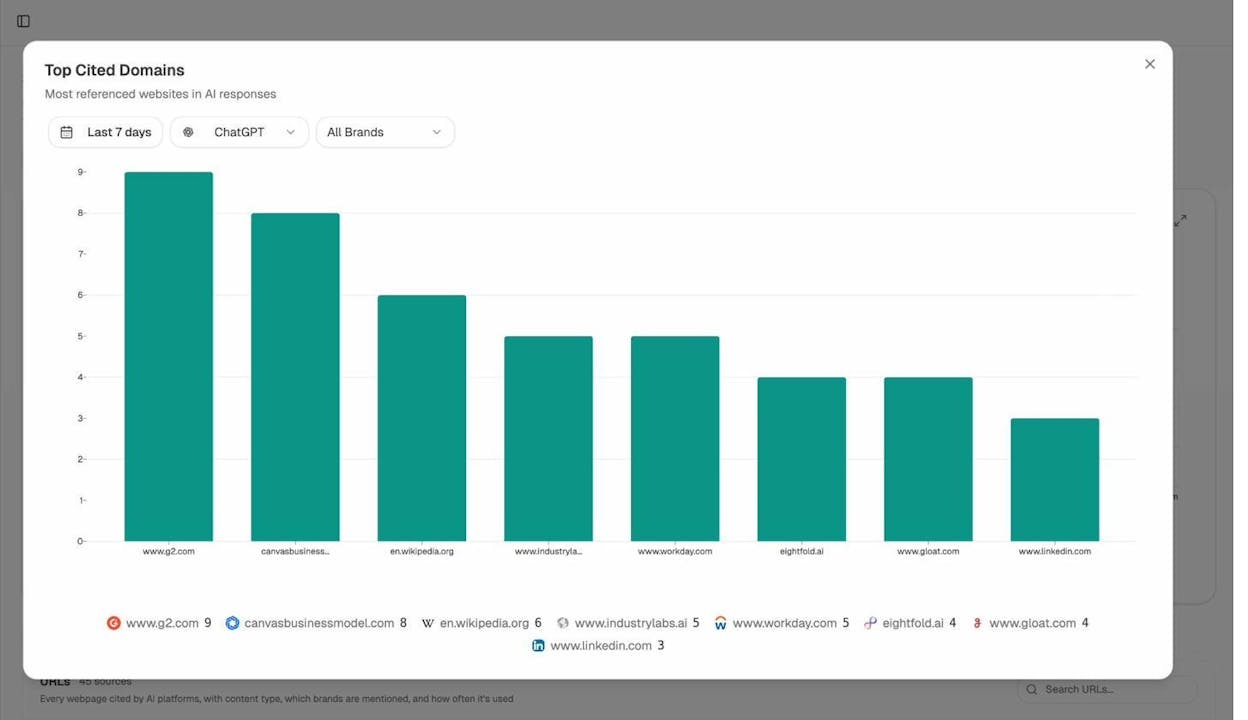
Citation Share measures how often AI models cite your URLs as sources in their responses, compared to competitor URLs. This metric appears in Analyze AI’s Sources dashboard.
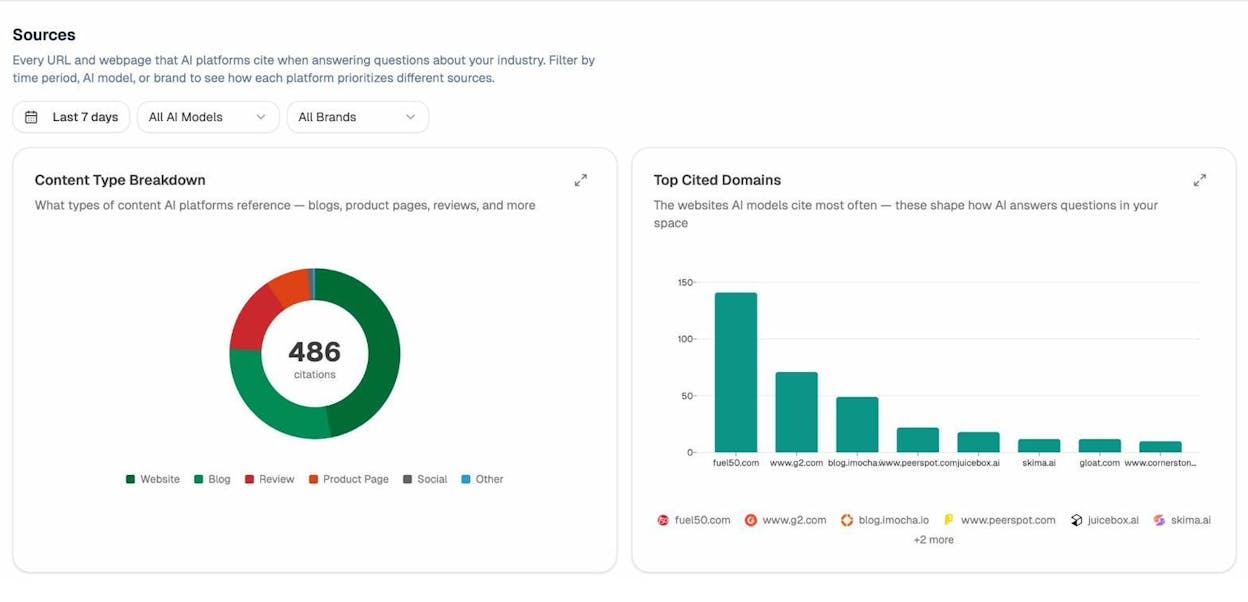
The Sources view shows: - Content Type Breakdown: What types of content AI models reference (blogs, product pages, reviews, social posts) - Top Cited Domains: Which websites the AI models cite most frequently in your industry
Why it matters: Citations are the link equity of AI search. When an AI model cites your URL, it drives both brand awareness and direct traffic. Understanding which of your pages get cited—and which competitor pages get cited instead—tells you where to focus your content optimization.
How to act on it: Look at the most-cited domains in your space. If a competitor’s blog gets cited 3x more than yours for a specific topic, study what makes their content more citable: Is it more structured? More data-driven? More comprehensive? Use those insights to improve your own content. For a deeper dive, read our guide on how LLMs cite sources.
AI Referral Traffic
AI Referral Traffic measures actual sessions on your website that originate from AI platforms. Unlike Visibility and Citation Share (which measure your presence in AI responses), this metric tracks confirmed visits.
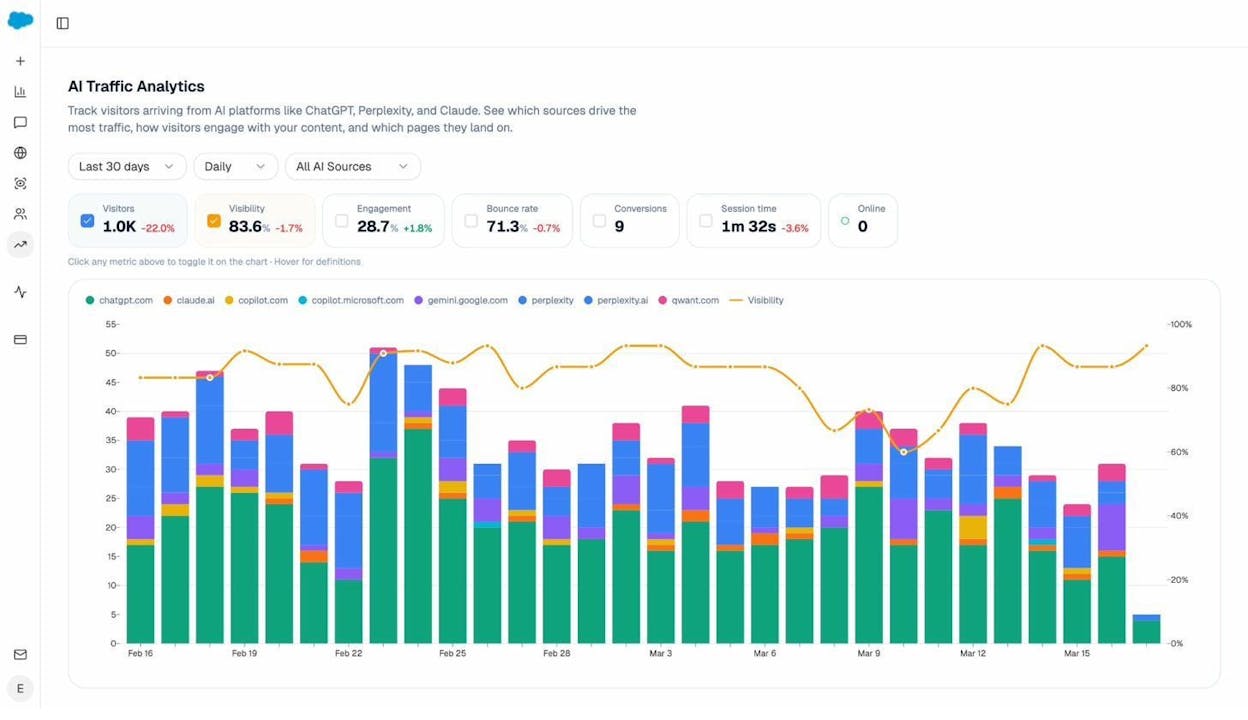
Analyze AI connects to your GA4 data and shows AI referral traffic broken down by source (chatgpt.com, claude.ai, perplexity.ai, copilot.microsoft.com, gemini.google.com), time period, and landing page. The dashboard also overlays engagement metrics—bounce rate, session time, conversions—so you can see not just how much traffic AI sends, but how valuable that traffic is.
Why it matters: Visibility is nice, but traffic is what matters. AI Referral Traffic lets you prove the channel’s ROI to stakeholders with real numbers.
How to act on it: Identify your top-performing landing pages from AI traffic.
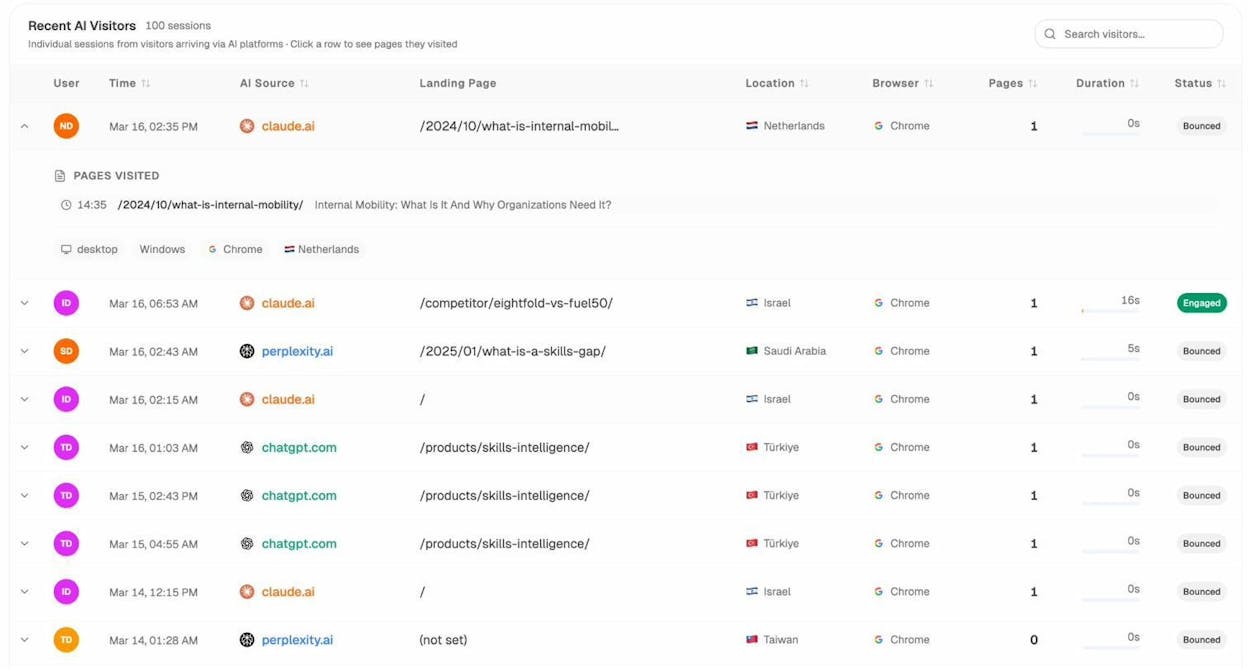
In Analyze AI, the AI Traffic by Page view shows exactly which pages receive AI-driven visits and from which engines. Double down on the content formats and topics that AI models already prefer. If your “how to choose a CRM” guide gets strong AI traffic but your “CRM pricing comparison” page doesn’t, that tells you something about what AI models value.
For more detail on tracking AI traffic, read our case study on how Kylian AI grew AI traffic by 800%.
Prompt Position
Prompt Position is the rank at which your brand appears in an AI-generated response for a specific prompt. If ChatGPT lists five CRM tools and your brand is the third one mentioned, your Prompt Position is #3.
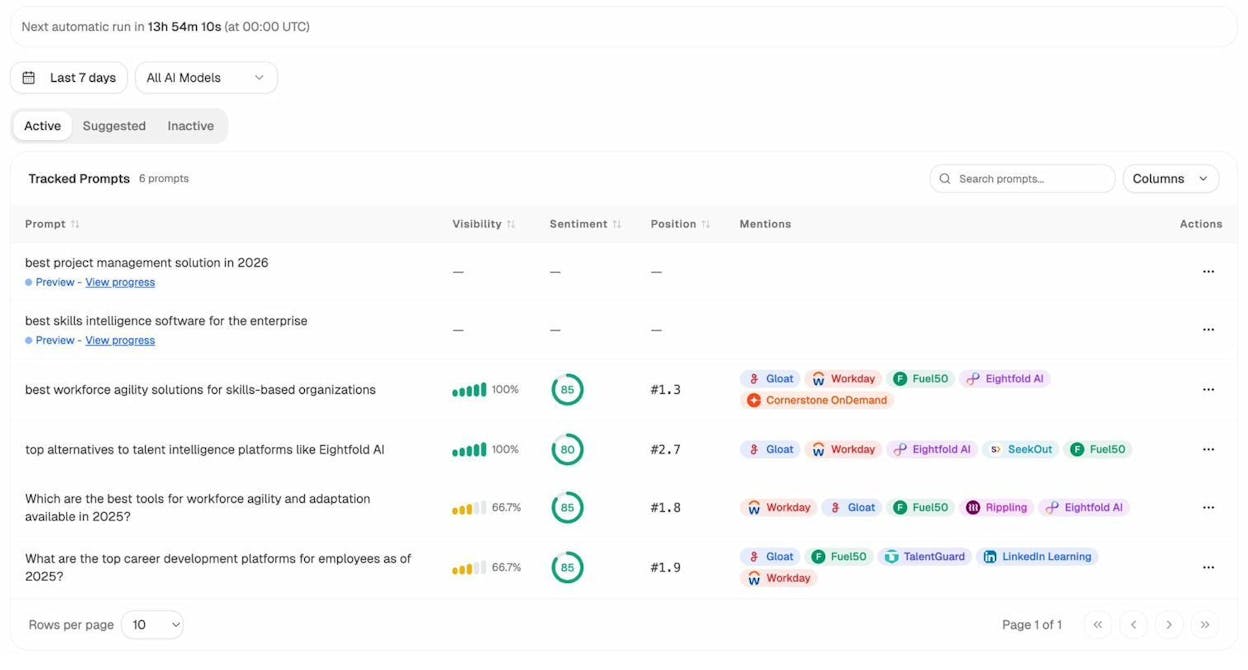
Analyze AI tracks Prompt Position for each tracked prompt across all major AI models. The Prompts dashboard shows your position, visibility, sentiment, and which competitors appear alongside you.
Why it matters: Position in AI responses matters just like position in Google SERPs. The first brand mentioned typically gets the most attention and clicks.
How to act on it: Filter your tracked prompts by those where you appear but not in the top position. Then compare your content against the brands ranked above you. Often, the difference comes down to E-E-A-T signals—more authoritative sources, better-structured content, or stronger brand signals.
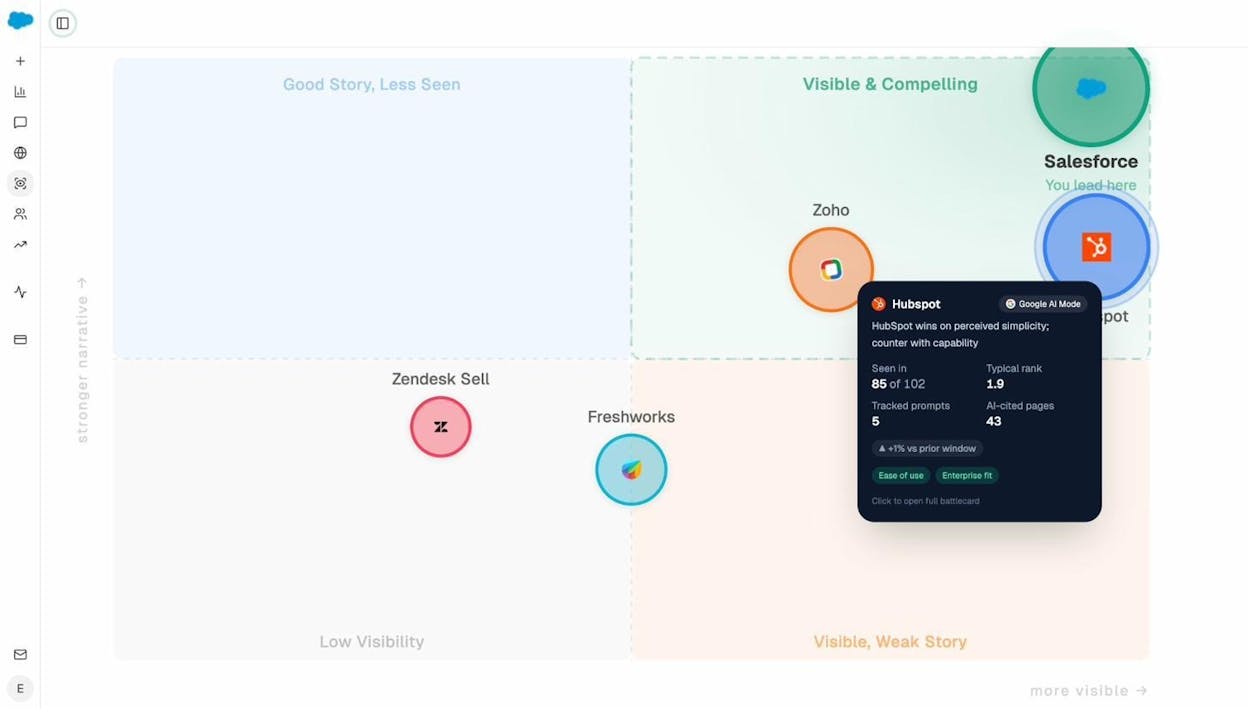
Competitor Visibility Map
Beyond individual metrics, Analyze AI provides a Competitor Overview that maps where competitors win and where your brand leads across AI search.
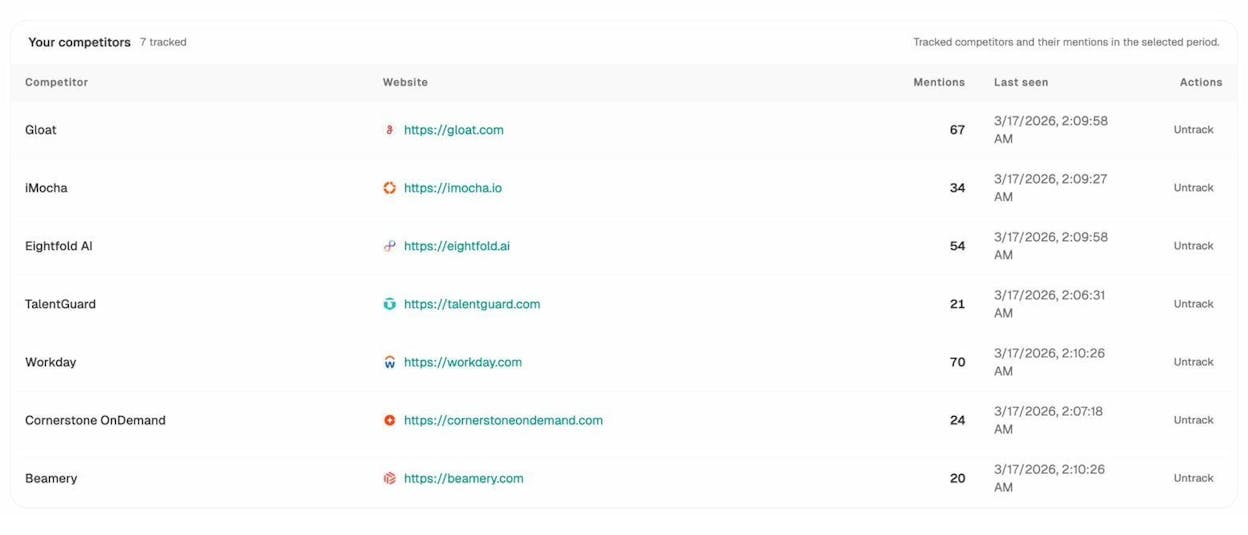
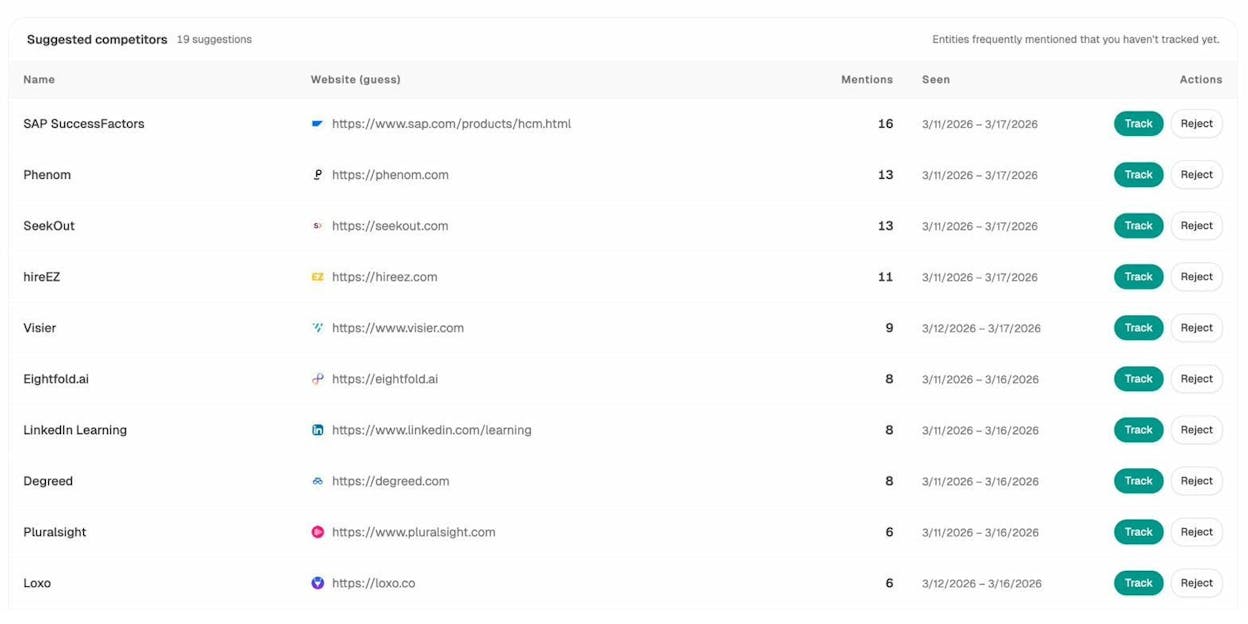
The Suggested Competitors feature automatically identifies brands that frequently appear alongside yours in AI responses—even ones you might not have considered direct competitors. You can track or reject each suggestion to build a competitive set that reflects AI search reality, not just your traditional market assumptions.
How to act on it: Look at the Opportunities view to find prompts where your competitors appear and you don’t. These are your highest-priority gaps. Create or optimize content to fill them.
Smart Prompt Suggestions
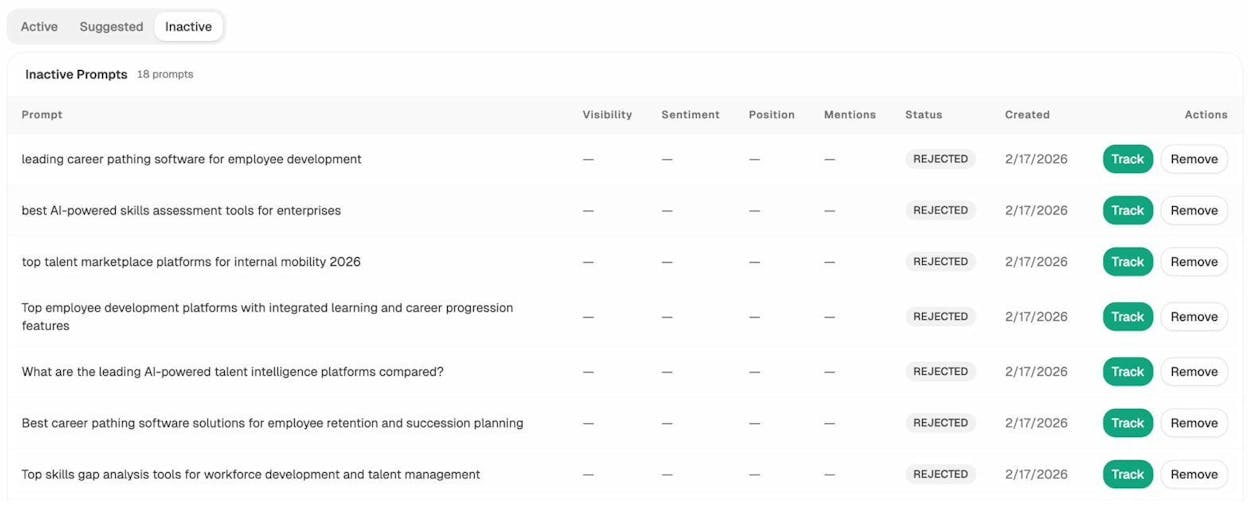
Not sure which prompts to track? Analyze AI suggests prompts based on your industry and competitors’ activity. The Suggested tab in the Prompts dashboard shows prompt ideas you can add to your tracking set with one click.
This removes the guesswork from AI search tracking. Instead of brainstorming which questions people ask AI about your category, the platform identifies them automatically. For more on building a prompt tracking strategy, explore our AI Prompts Library.
Which SEO Metrics Actually Matter?
With 25+ metrics across multiple tools, it’s easy to get paralyzed by data. Here’s a simple framework to cut through the noise.
Metrics That Drive Decisions
These are the metrics you should check regularly and act on:
|
Metric |
Why It Matters |
Frequency |
|---|---|---|
|
Organic Traffic (yours vs. competitors) |
Shows whether your SEO efforts are producing results |
Weekly |
|
Share of Voice |
Measures your market share in search |
Monthly |
|
Keyword Rankings (top 3 positions) |
Top 3 positions capture the majority of clicks |
Weekly |
|
Referring Domains (net new) |
Leading indicator of future ranking improvements |
Monthly |
|
AI Visibility |
Measures your brand’s presence in AI-generated answers |
Weekly |
|
AI Referral Traffic |
Proves the ROI of AI search as a channel |
Monthly |
Metrics That Provide Context
These are useful for diagnostics but shouldn’t be KPIs:
|
Metric |
Use It For |
|---|---|
|
Domain Rating / Domain Authority / Authority Score |
Comparing your site to competitors and evaluating link prospects |
|
Keyword Difficulty |
Prioritizing which keywords to target |
|
Traffic Potential |
Estimating realistic traffic from a keyword opportunity |
|
CPC / Organic Traffic Value |
Understanding commercial value of your keywords |
|
Spam Score / Toxic Score |
Identifying risky backlinks during audits |
Metrics to Avoid Obsessing Over
-
Raw keyword count (Organic Keywords). More keywords ≠ better performance.
-
Total backlinks. Referring domains matter more than raw link count.
-
Domain-level metrics as standalone KPIs. Never set “reach DR 50” as a goal. Focus on the activities that improve DR as a byproduct.
How to Track SEO and AI Search Metrics Together
The most effective marketers in 2026 don’t treat SEO and AI search as separate channels. They track both in a unified view because the same content quality that drives organic rankings also drives AI citations.
Here’s a practical setup:
-
For traditional SEO metrics: Use Ahrefs, Semrush, or Moz (or a combination) to track domain authority, organic traffic, keyword rankings, and backlink health. Supplement with Google Search Console for first-party data.
-
For AI search metrics: Use Analyze AI to track AI visibility, sentiment, citation share, AI referral traffic, and prompt positions across ChatGPT, Perplexity, Claude, Gemini, and Copilot.
-
For keyword research: Combine traditional keyword tools with AI prompt research. Use Analyze AI’s prompt suggestions and Keyword Generator to identify queries people ask in both traditional search and AI search.
-
For competitive analysis: Cross-reference traditional SEO competitor analysis with Analyze AI’s Competitor Overview. Your competitive landscape in AI search may differ from traditional search—some brands that don’t rank well on Google might dominate AI answers, and vice versa.
-
For content audits: Use organic traffic data alongside AI citation data to identify content that performs well in one channel but not the other. A page with strong organic traffic but no AI citations might need structural improvements (like better schema or more structured answers) to become citable. A page with strong AI citations but weak organic traffic might need more backlinks or better on-page optimization.
Additional Resources
Now that you understand what each metric means and how to use it, here are some guides to put them into action:
Ernest
Ibrahim
![Link Building Outreach: A Step-by-Step Guide [With Templates]](/_next/image?url=https%3A%2F%2Fwww.datocms-assets.com%2F164164%2F1774864954-blobid0.png&w=3840&q=75)


