
Getting started
Reading your Overview dashboard
The Overview is your daily read on AI visibility — here's what each chart means, how to filter it, and the opportunities table that tells you what to fix next.
The insight banner
The top of the Overview isn't a chart — it's a sentence. Analyze AI writes a plain-language summary of your current window: your top AI channel, who leads on visibility, and the one thing to focus on. The highlighted values are interactive — switch the time window, engine, or competitor and the narrative rewrites itself.
The three trend charts
Visibility, sentiment, and position, each comparing your brand against every tracked competitor. All three share the same filters: date range, AI model, and brands.
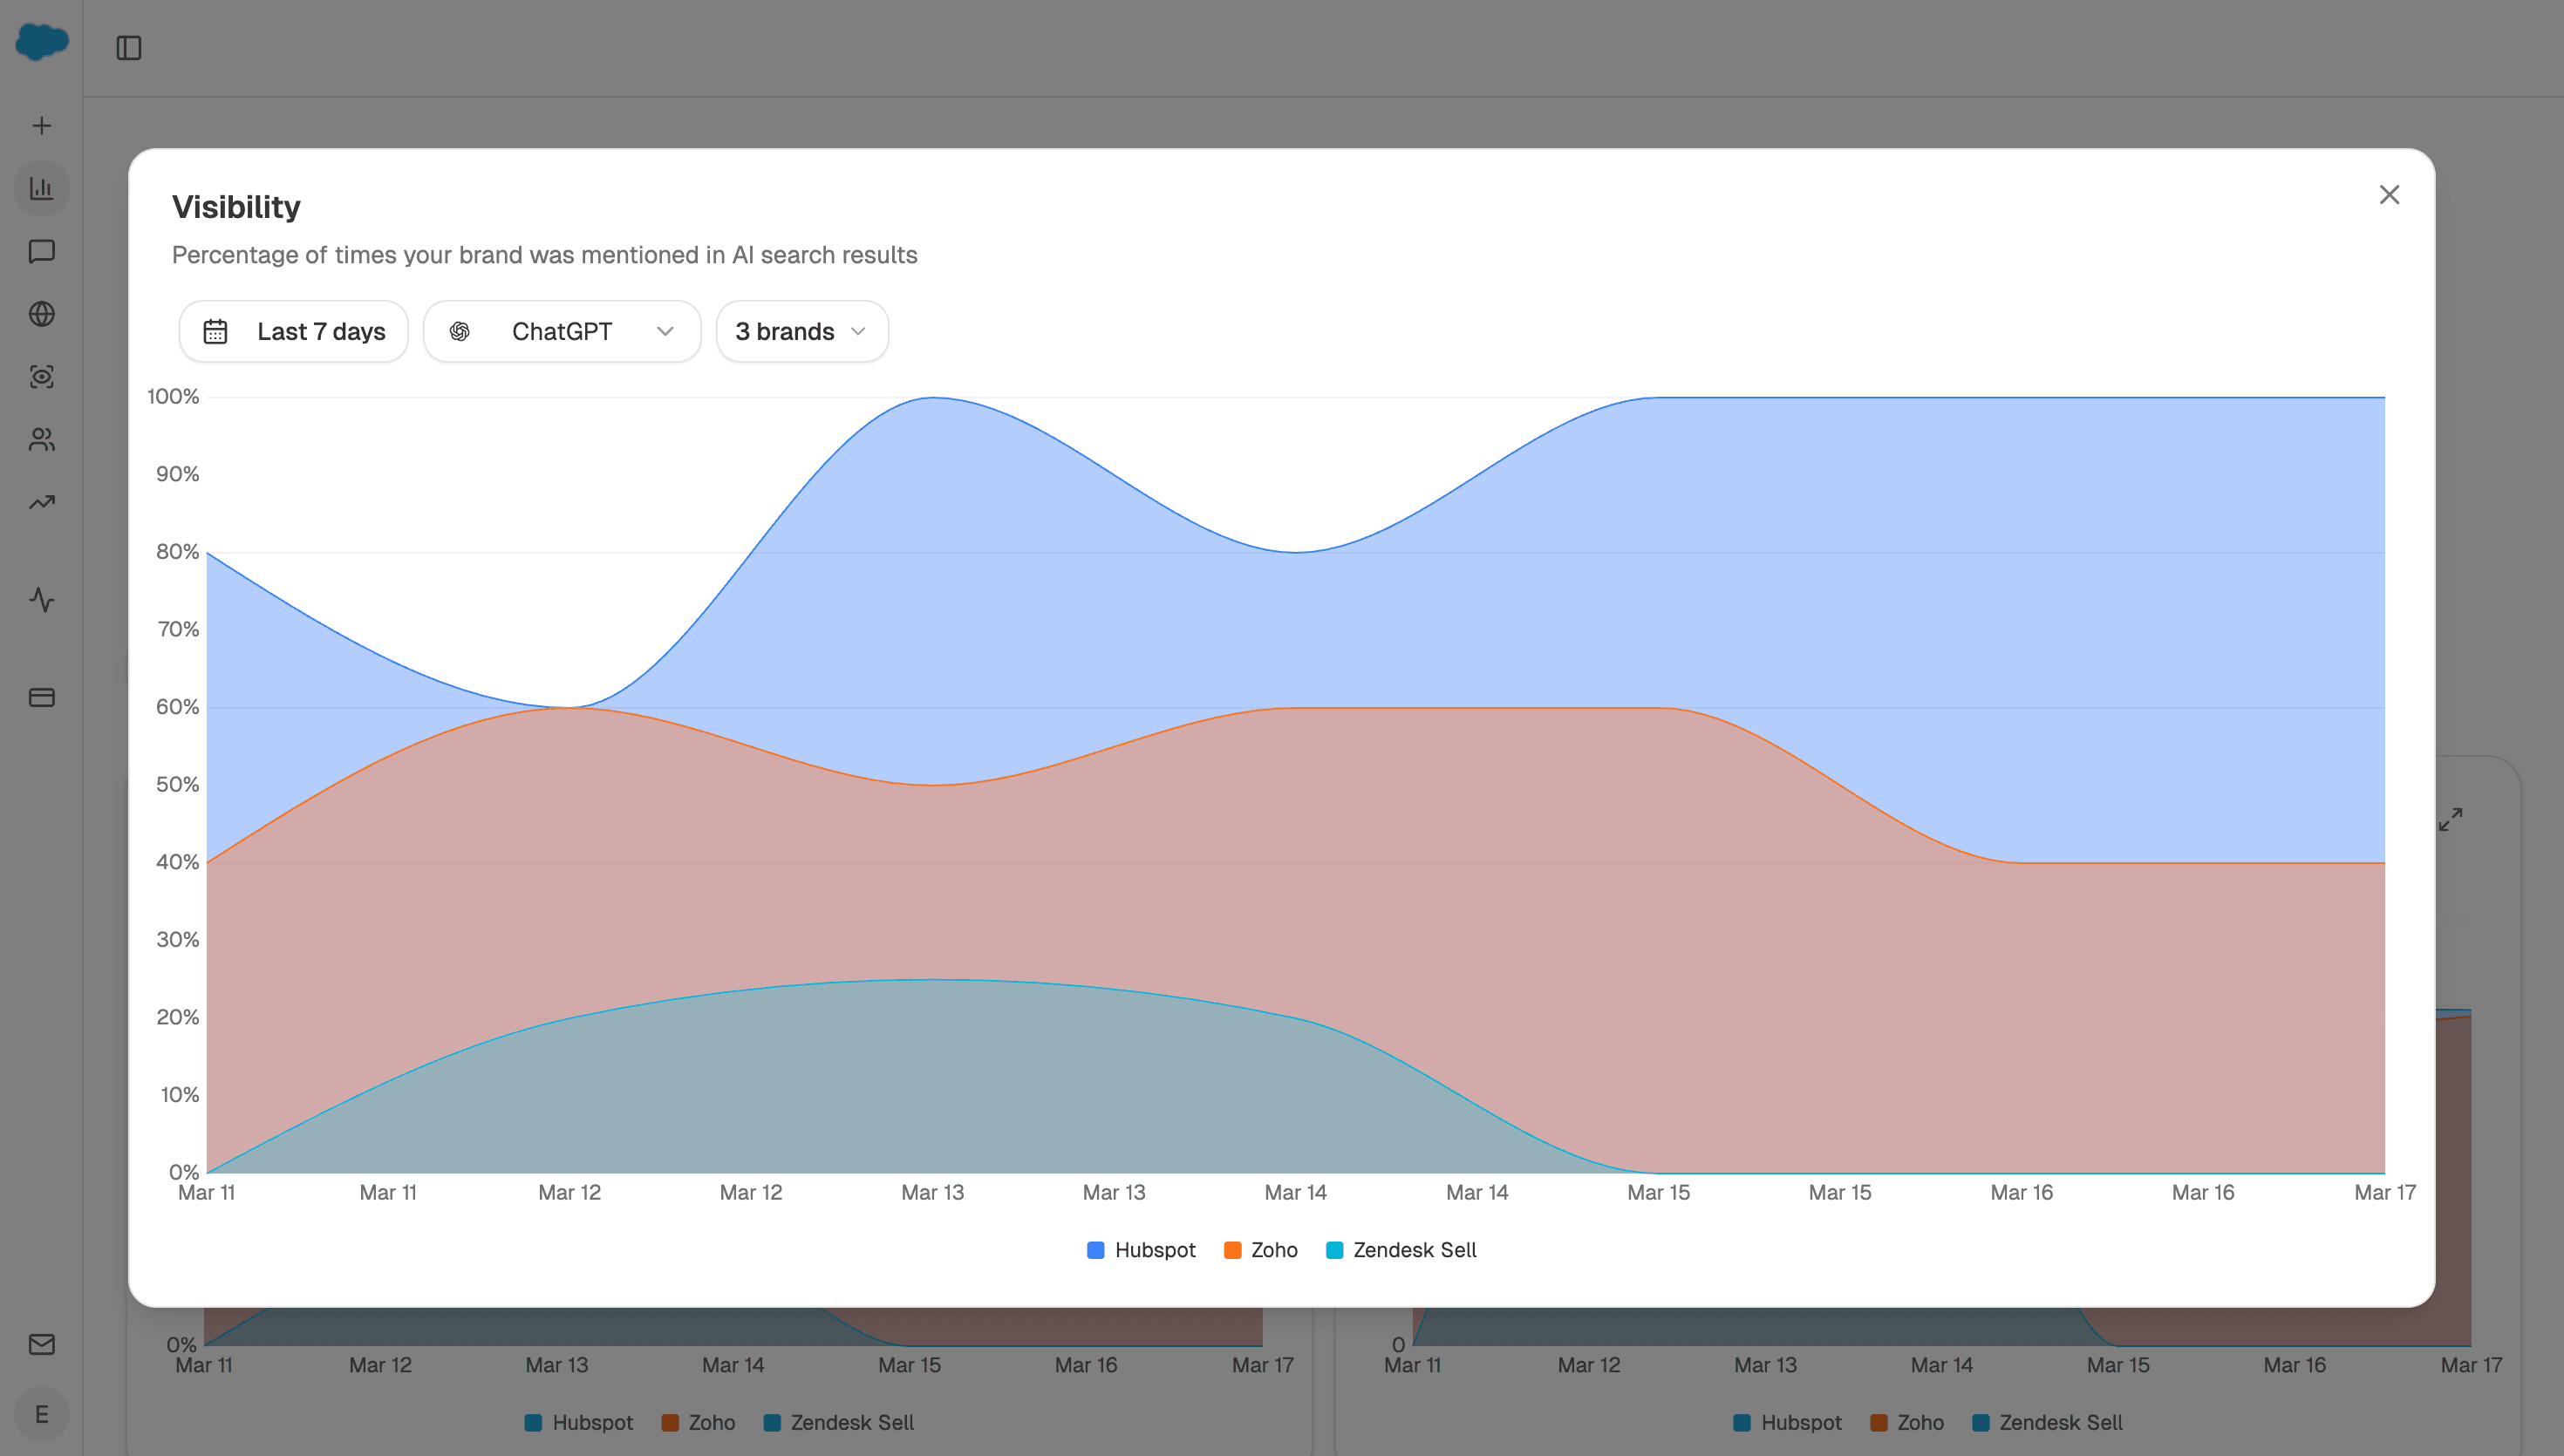
- Visibility — the percentage of AI answers that mention each brand. Your share of the conversation.
- Sentiment — how positively the answers talk about each brand, 0–100.
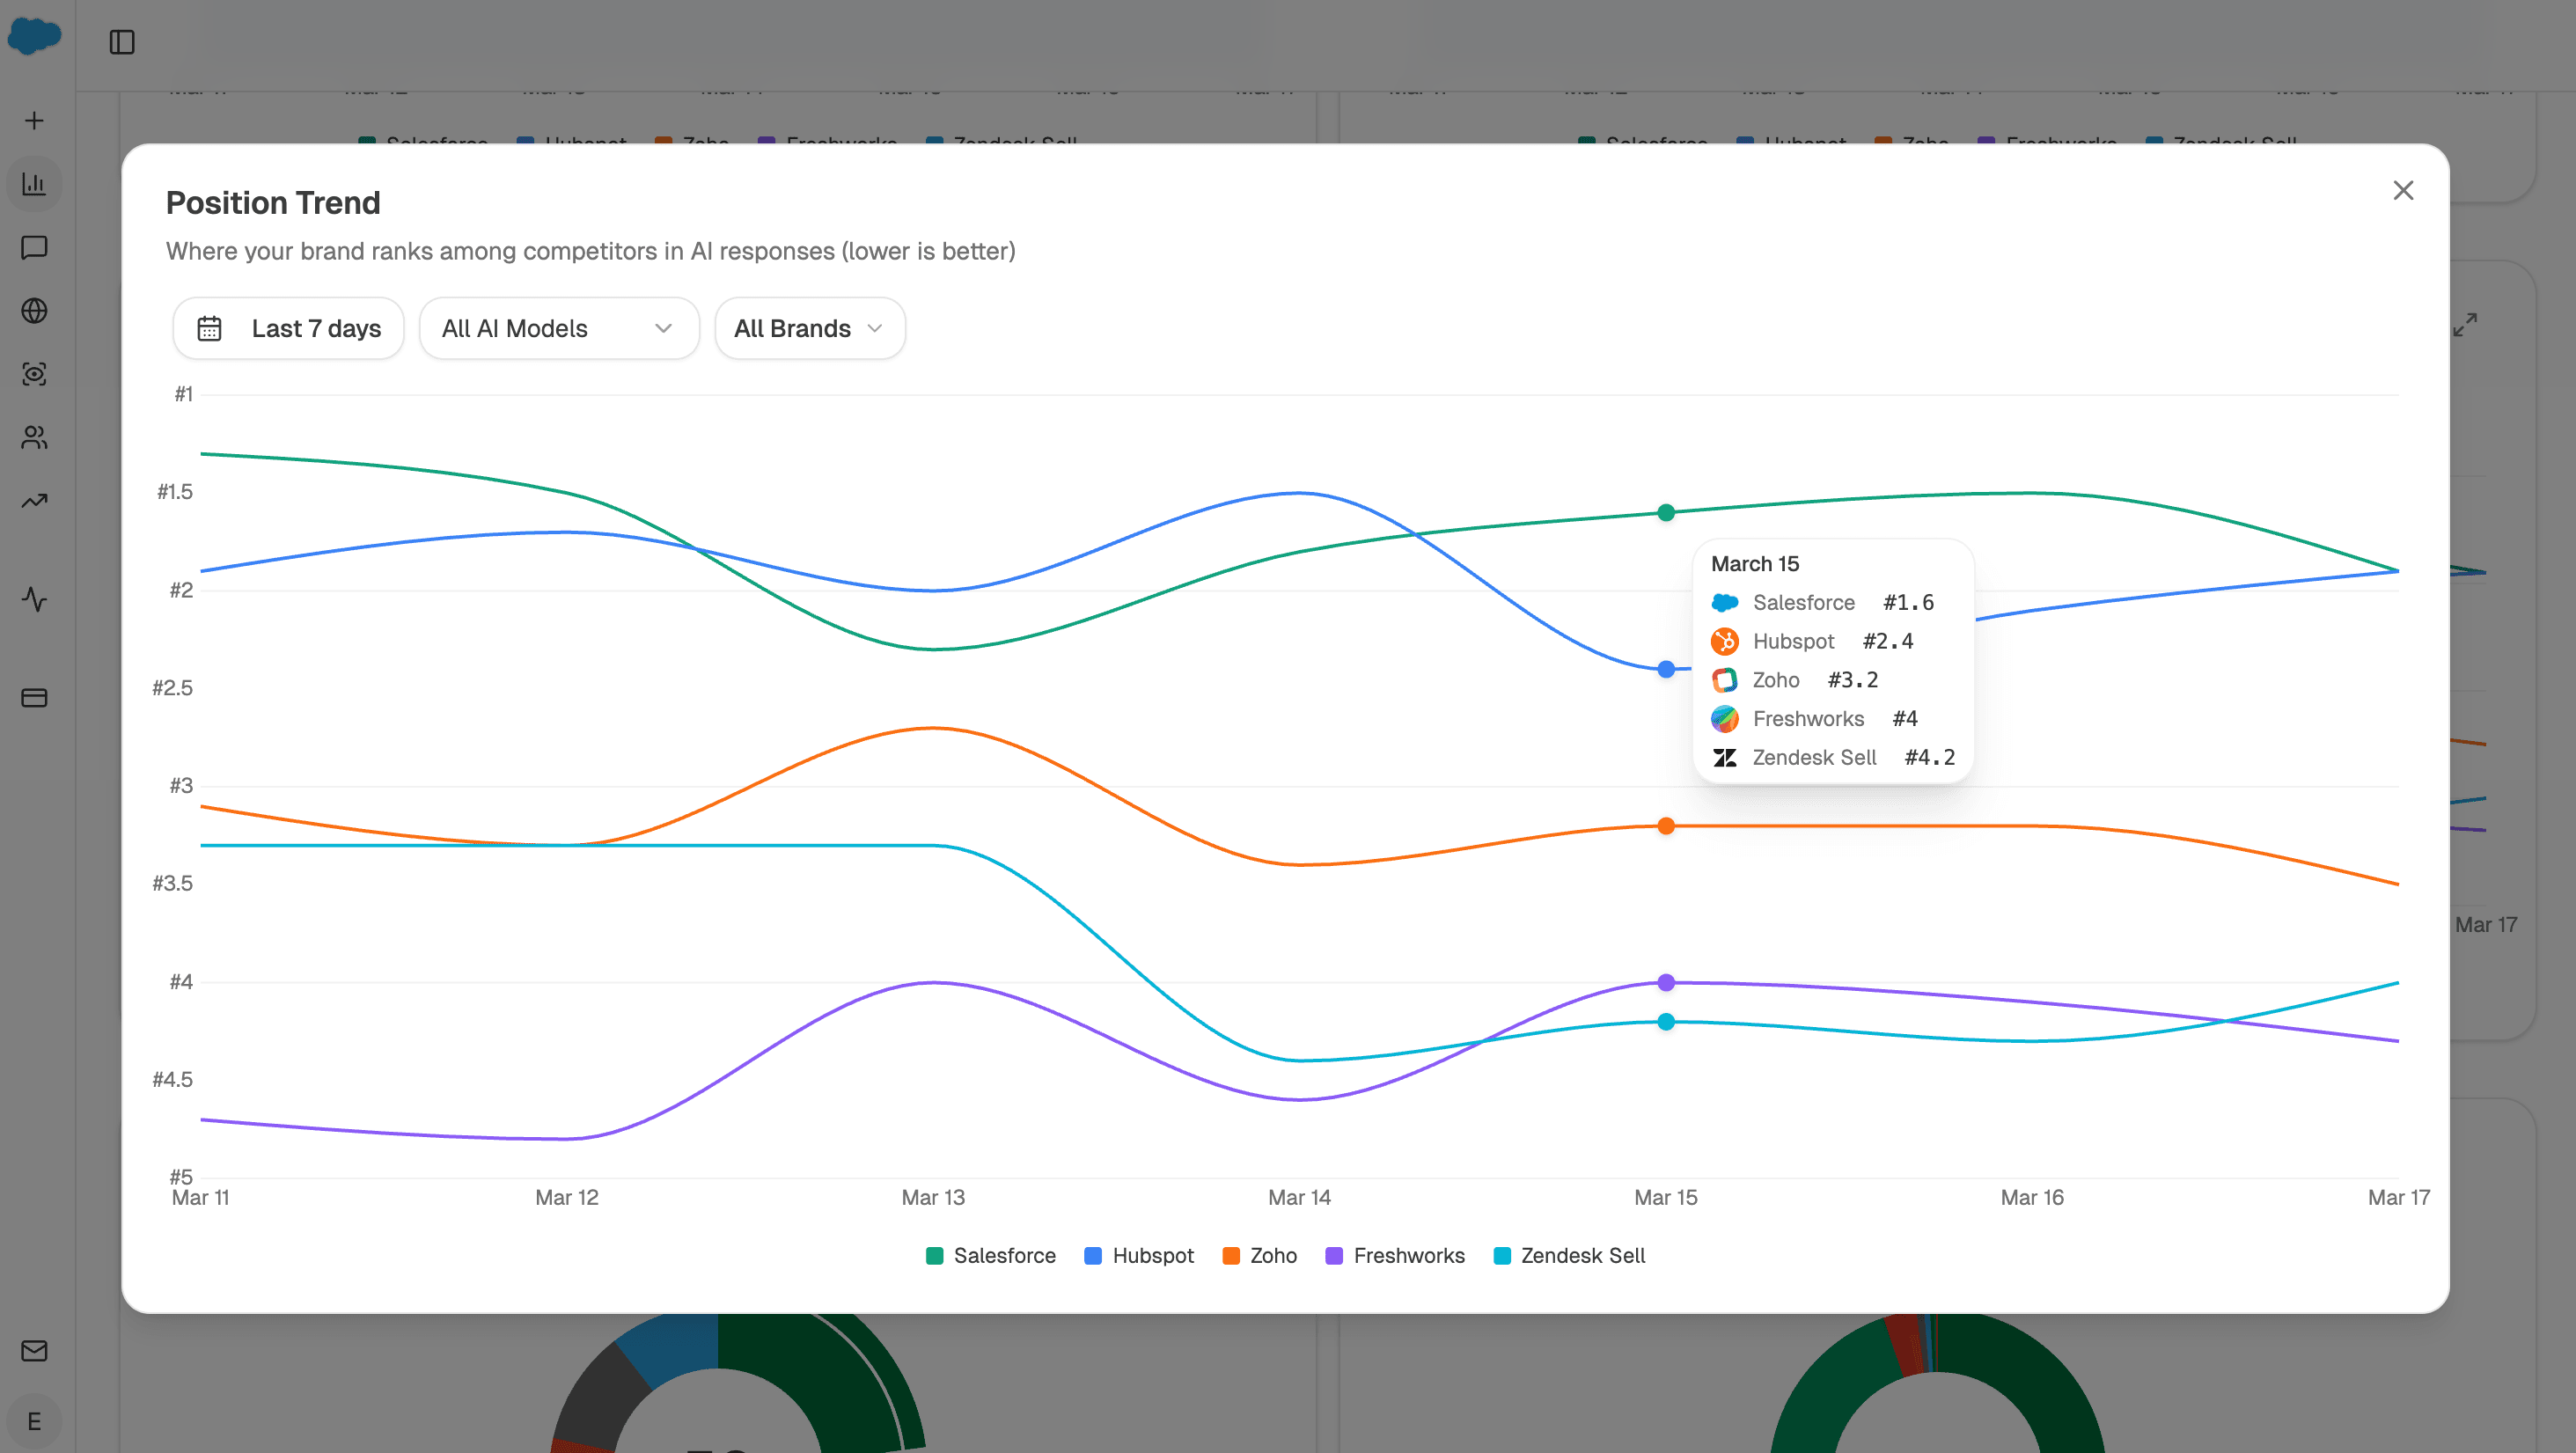
- Position — where each brand ranks inside the answers (lower is better; #1 means you're the first recommendation).
Expand any chart to filter it down — for example, visibility on ChatGPT only, for three brands:
Drill into any day
Click a day on the position chart and you get the Position Breakdown — the actual per-prompt rankings behind that day's average: which prompt, which engine, who was mentioned, and at what rank.
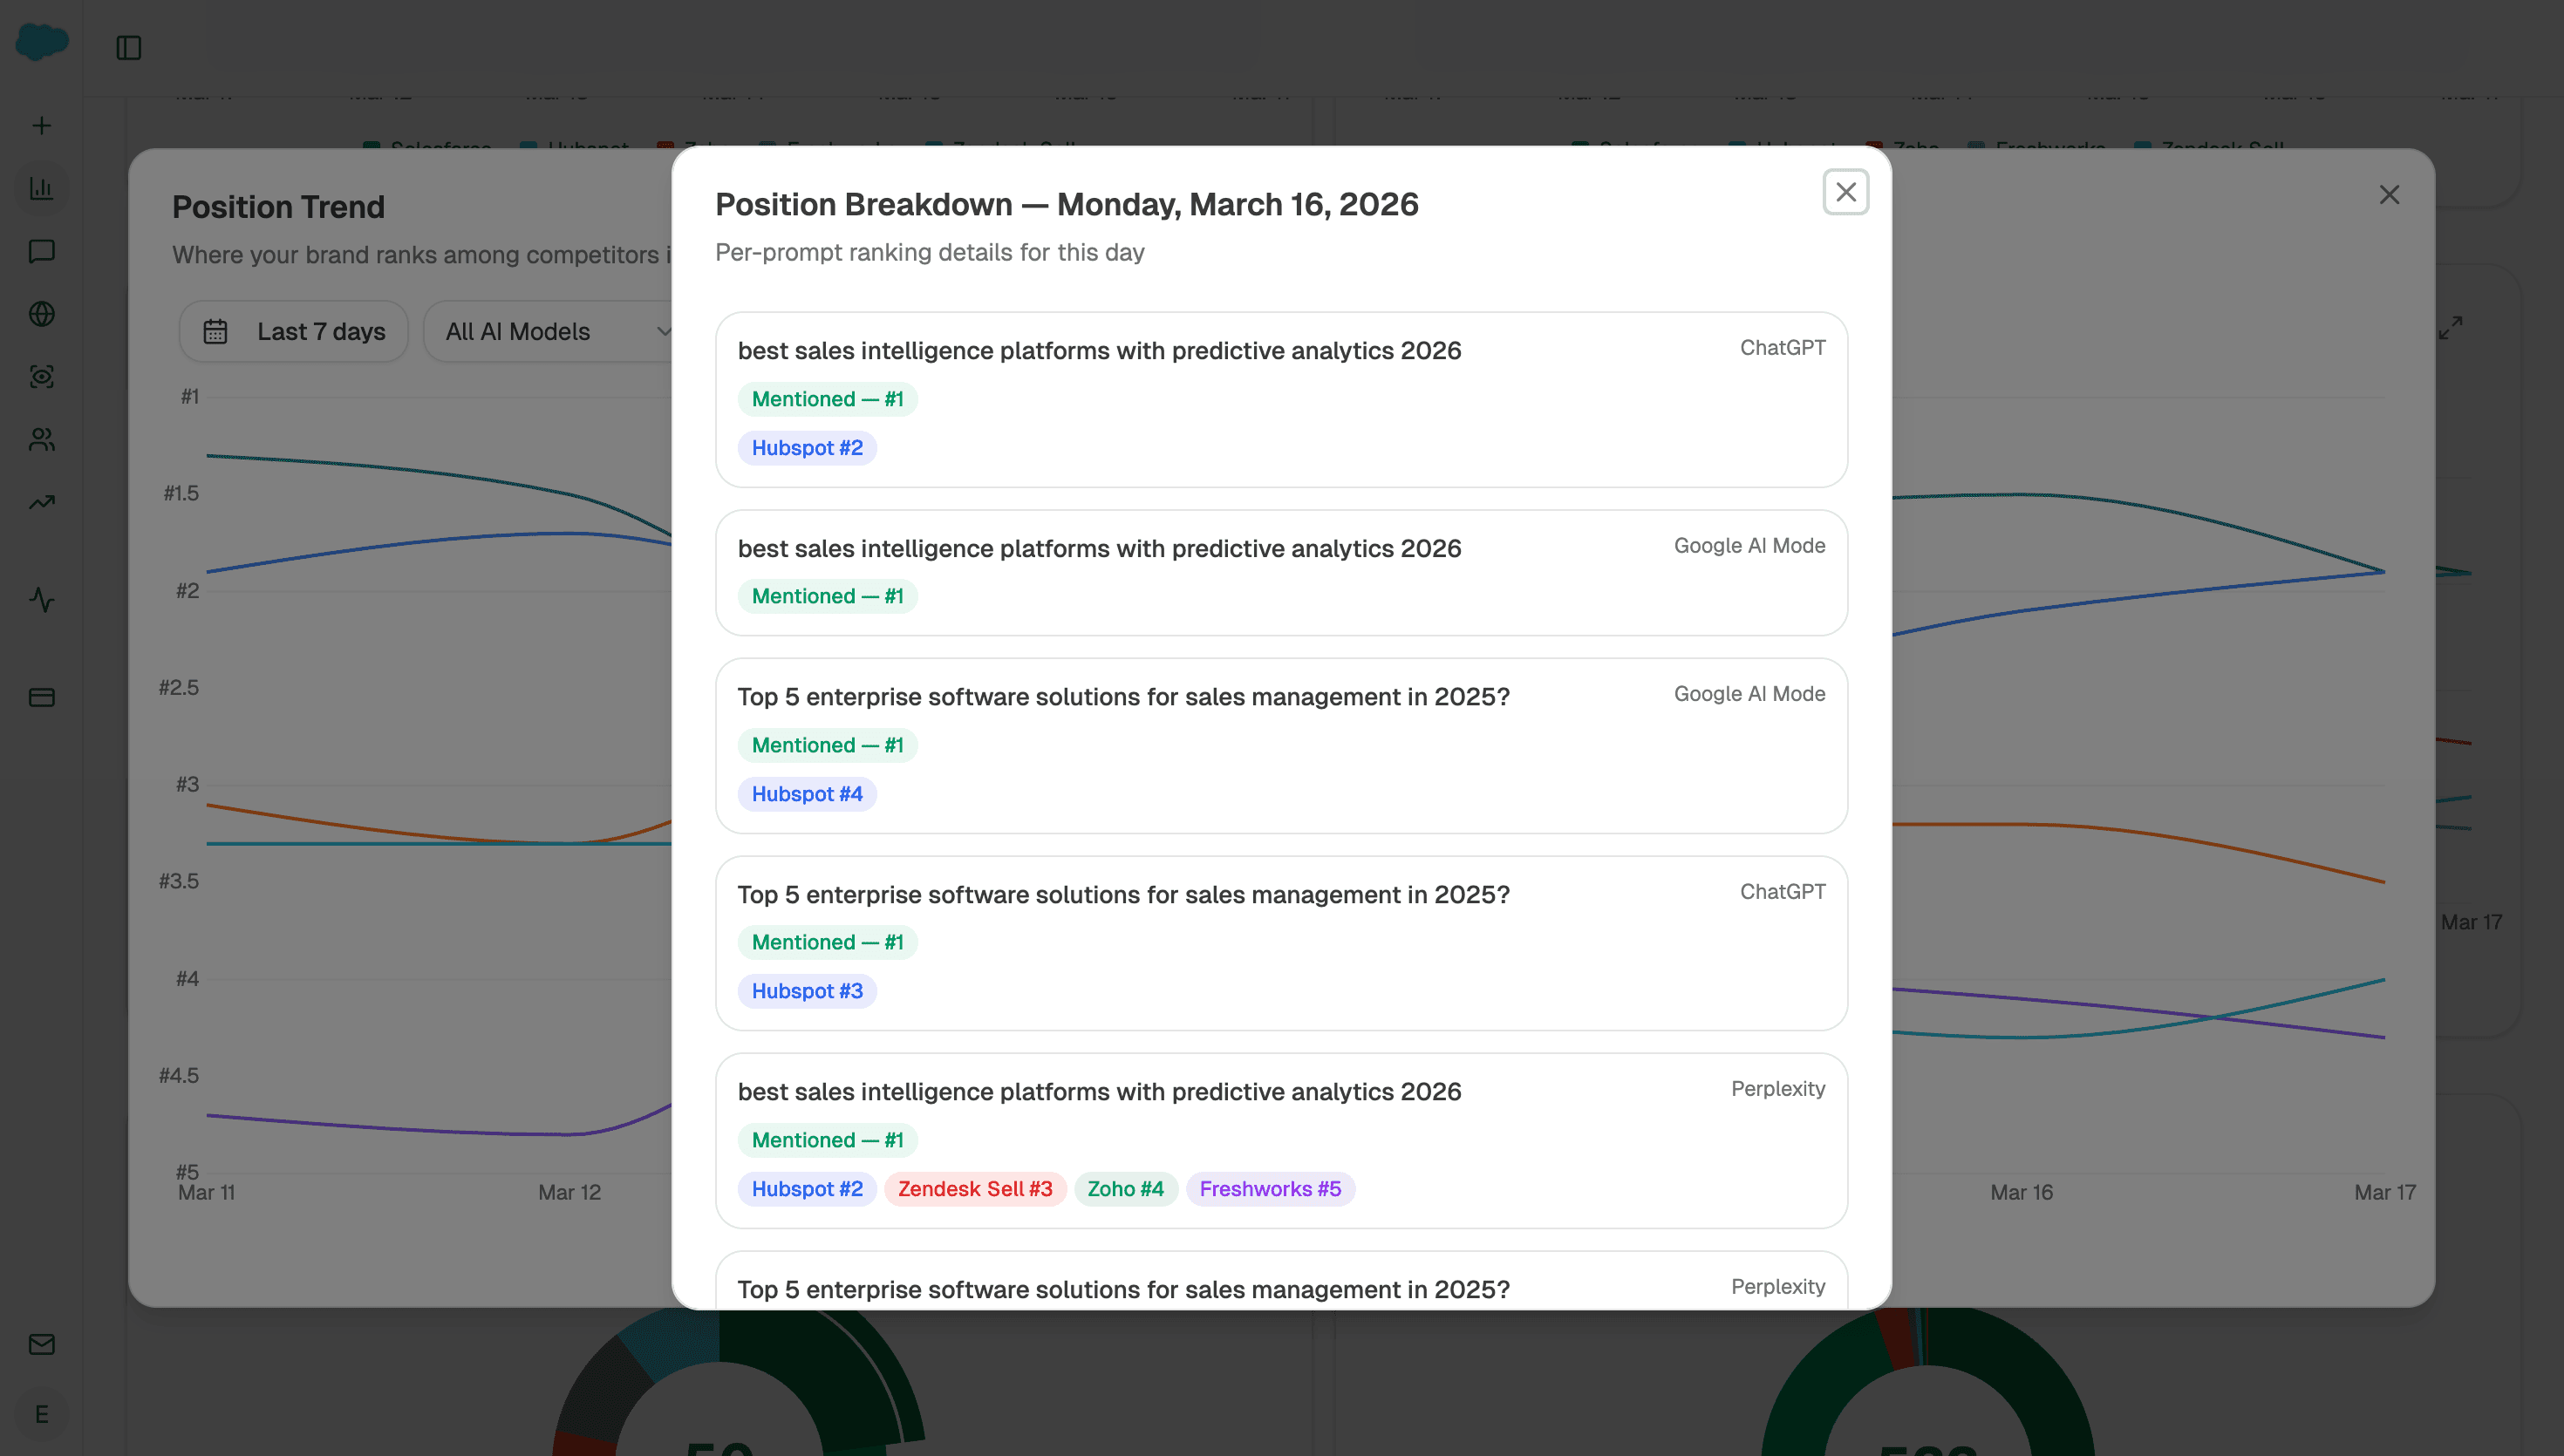
One habit makes the Overview pay off: never stop at "visibility dropped." Expand the chart, isolate the engine, click the day, and you'll usually find the two or three specific prompts that moved.
Sources and citation types
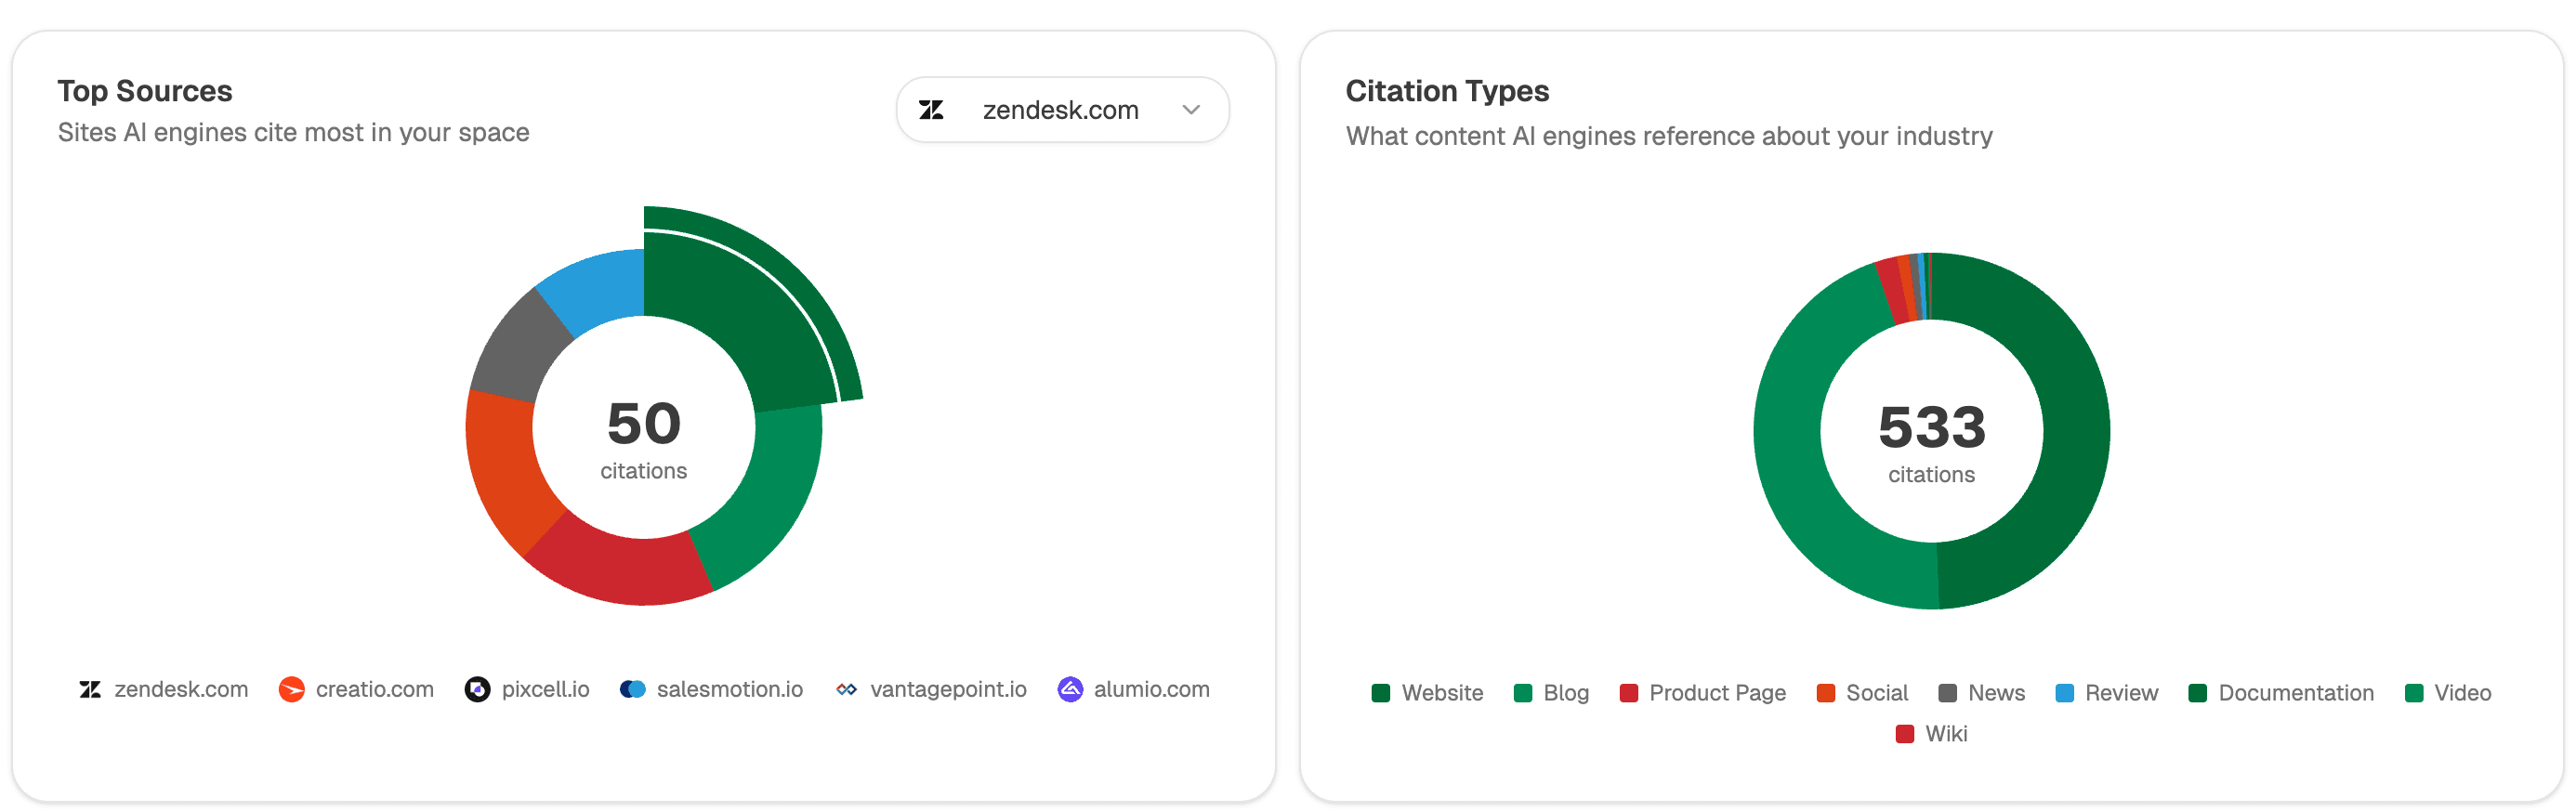
Two donuts summarize the source landscape: Top Sources (the sites AI engines cite most in your space — select any competitor to see who powers their answers) and Citation Types (what kind of content gets referenced: websites, blogs, product pages, reviews, documentation).
The Opportunities table
The bottom of the Overview lists the prompts where competitors get cited but your brand doesn't — sorted by how many times you went unmentioned, with the competitors who took the spot.
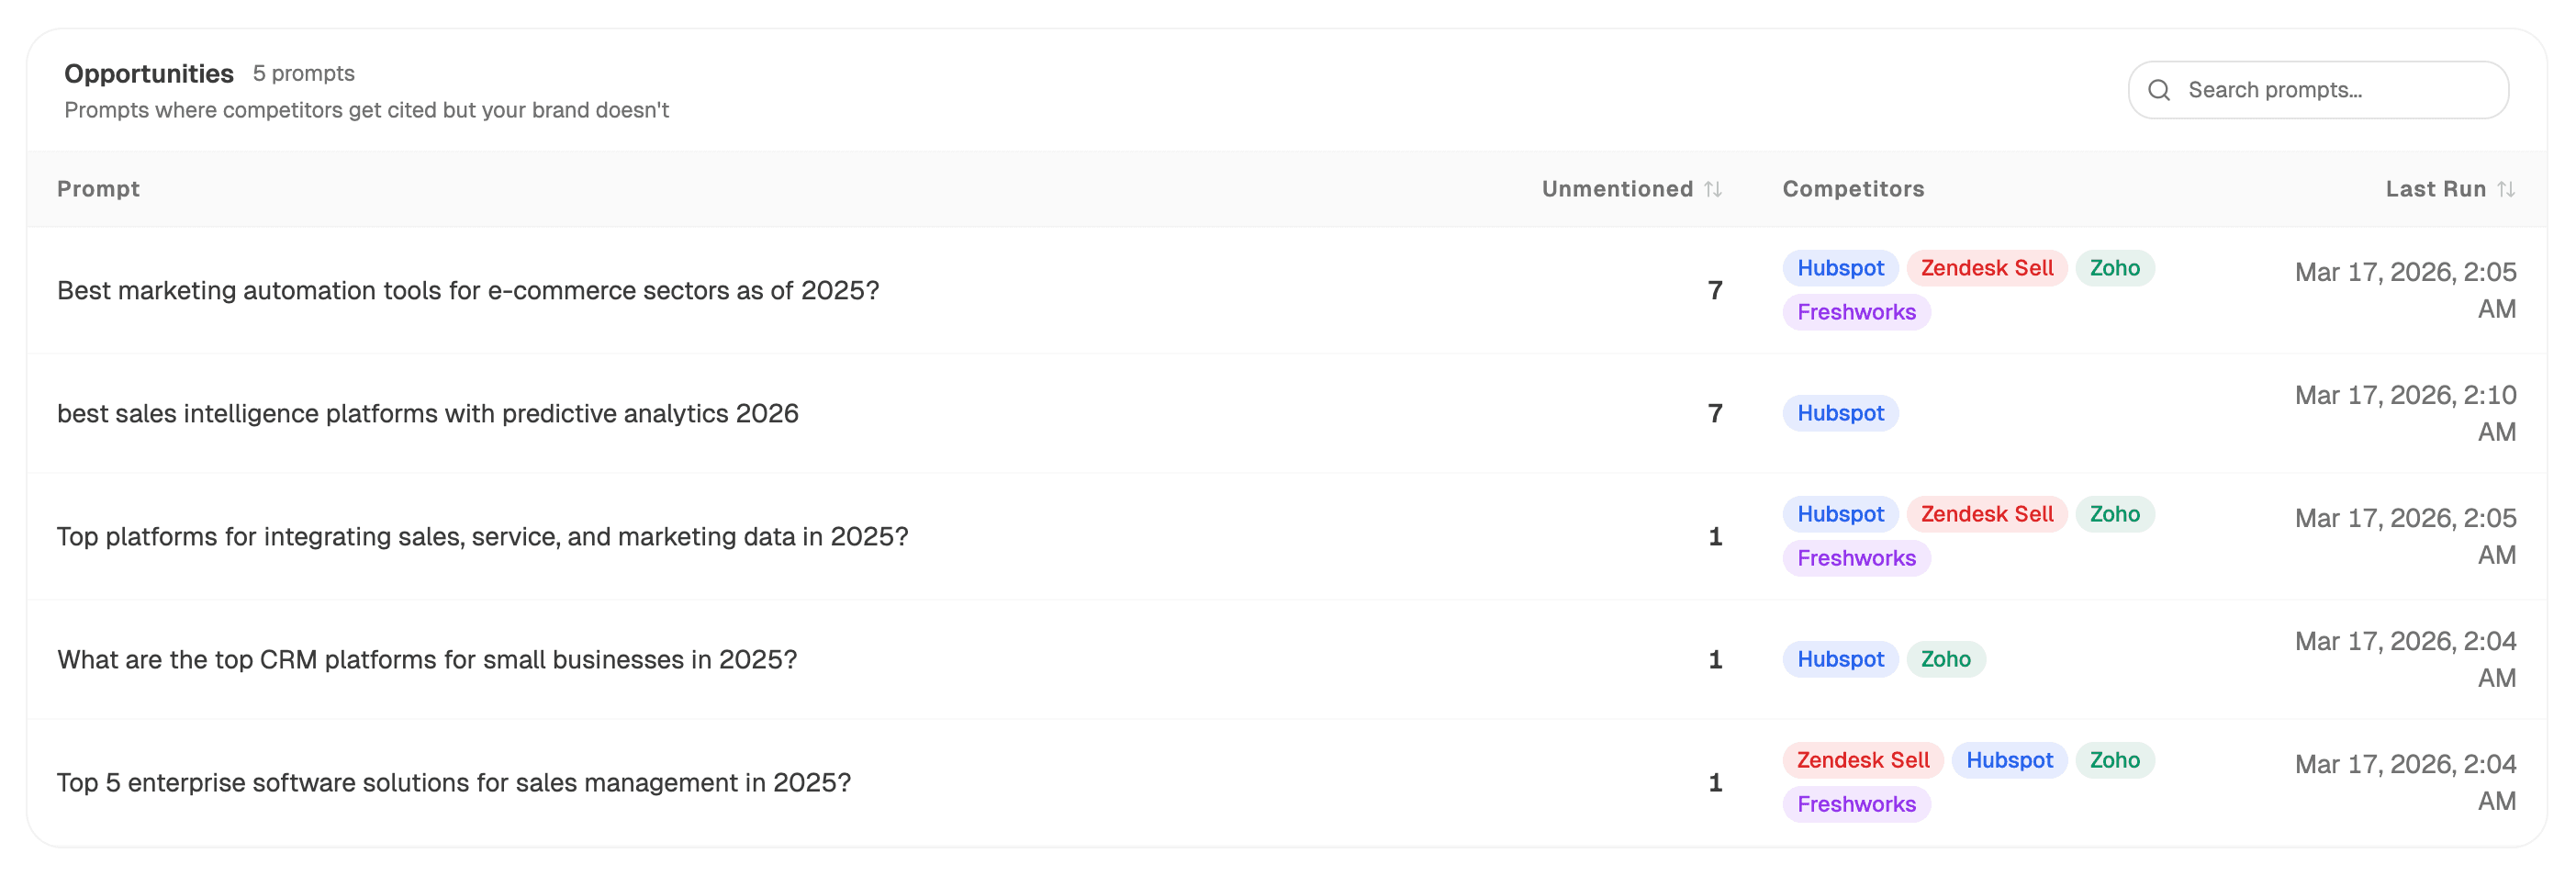
Each row names the prompt, how often you went unmentioned, and who took the spot. The natural next step is content that closes the gap.